Stats Analysis Using Data Science - IJCRT
←
→
Page content transcription
If your browser does not render page correctly, please read the page content below

www.ijcrt.org                                     © 2021 IJCRT | Volume 9, Issue 4 April 2021 | ISSN: 2320-2882

                   Stats Analysis Using Data Science

 Polamarasetty Srinu, Department of Computer Science and Engineering, Lovely Professional University,
                                 polamarasettysrinu007@gmail.com
 Neerumalla Apparao, Department of Computer Science and Engineering, Lovely Professional University,
                                     appiappu459@gmail.com
 Bandaru Charan Kumar Patrudu, Department of Computer Science and Engineering, Lovely Professional
                           University, charan.bandaru333@gmail.com
     Savita Verma, Department of Computer Science and Engineering, Lovely Professional University,
                                   savitaverma010197@gmail.com
   Pulugu Pavan Sai, Department of Computer Science and Engineering, Lovely Professional University,
                                     pavansai.pulugu@gmail.com
      Under the guidance of, Navjot Kaur, Department of Computer Science and Engineering, Lovely
                             Professional University, navjot.23838@lpu.co.in

Abstract

Data science is a department of study that integrates programming skills, domain proficiency, the ability of
mathematics, statistics, and applying advanced analytics techniques and principles to withdraw the
significant awareness of data. Data science has grabbed a lot of attentiveness, help to turn a huge quantity of
data into functional predictions and insights. As we know the Indian Premier League has transformed the
approach of the people towards cricket. It is examined as one of the merchantable extravaganzas that are a
combination of zeal, enjoyment, anxiety, popular cricketers, corporate bodies, and Bollywood figures with a
huge viewership around the globe. Many corporate bodies have examined Indian Premier League (IPL) as
the finest platform to merchandise their service. To be more precise to issue additional clarity this paper
focuses on using data science to forecast player performance and statistics in the Indian Premier League
(IPL)by using the tools and functions of data science.
Keywords: Data Science, Prediction, Tableau.

I. INTRODUCTION

[1] Cricket is a fascinating sport that is played in three different formats all over the world: Test cricket (5
days), One-day cricket (50 overs), and the 20-20 format, in which a team consists of 11 players and four
substitutes. Nevertheless, of the format in which it is played, cricket has its fan base around the world.
Twenty-Twenty cricket is the most recent version of the game. It has ushered in a whole new level of
batting, bowling, and fielding transformations and techniques.

The Indian Premier League (IPL) is an executive T20 tournament held in India that began in 2008. It is the
utmost attractive 20-20 league in the world, with eight teams participating. A league is an annual event in
which teams from various Indian cities play against one another. The Board of Control for Cricket in India
   IJCRT2104611       International Journal of Creative Research Thoughts (IJCRT) www.ijcrt.org        5092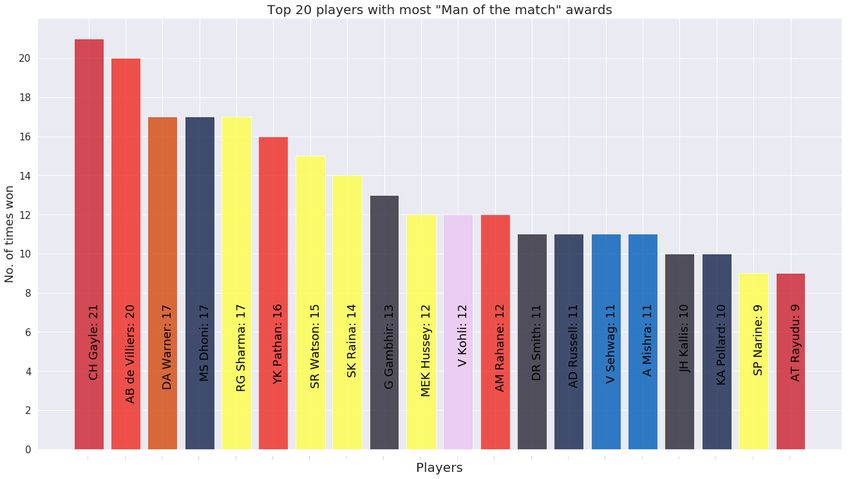
www.ijcrt.org                                    © 2021 IJCRT | Volume 9, Issue 4 April 2021 | ISSN: 2320-2882

(BCCI) initiated it, Throughout the league level, each team plays each other twice, once at home ground and
once away. After qualifiers, the head four teams advance to the playoffs.

In the group stage, each team plays 14 matches, this league lasts two months, and it has since grown into a
massive, lucrative cricket company. The teams for the IPL are chosen by an auction. In the world of sports,
player auctions are not a new occurrence. players are selected for their franchise based on their previous
results and records, and a large amount of money is bid on them from all the teams. The result of matches
is extremely significant for all stakeholders due to the financial stakes, team spirit, city pride, and a large
fan base. This, in turn, is determined by the game's complicated rules, the team's luck (the coin toss), and
the players' abilities and results on any given day. Other natural variables, such as historical player records,
play an important role in predicting a cricket match's outcome. The team selection process can be aided by
a method of predicting the results of matches between different teams. However, because of the many
variables involved, accurately predicting the outcome of a game is difficult. Furthermore, the precision of a
forecast is determined by the amount of data used.

The method described in this paper can be used to assess player performance. This tool allows you to see
how well your players are doing. Several predictive models for predicting the outcome of a match are also
being created, based on each player's previous performance as well as some match-related data. During
IPL matches, the built models will assist decision-makers.

II. LITERATURE SURVEY

Ashok pal [2019] developed a report by using the webometric evaluation of the website of the Indian Premier
League (IPL) teams that were based on the survey on ranking of IPL websites and franchise as well as the
overall assessment of those websites, that is used to calculate the types of WIFs those are (SWIF) Simple Web
Impact Factor, (IWIF) Internal-Link Web Impact Factor and (EWIF) External-link Web Impact Factor and
in which half of the websites have .com domain addition and the other half possess .in domain extensions and
this webometric scrutiny of websites of IPL leads them to see the position of WIFs which results in the ranking
of the IPL teams.
Nyambura [2012] investigated the reasons why people watch the IPL on television. Escape, drama,
socialization, knowledge and skills, aesthetics, and fascination were among the six factors they found. With
the last three variables, there was also a substantial gender difference. The role of participation incorrect
sponsor recognition was investigated by Yousuf and Gupta [2015], who discovered that highly involved
individuals remember more sponsors than less involved viewers. They were also able to discover major
gender gaps in participation.
A new form of player assessment technique has been explored by H Perera et al. [2014]. They looked at how
much extra run a player could potentially contribute as compared to a regular player. They investigated the
issue of a player being overpaid or underpaid in the IPL and gave an alternative measure of player success
in T20 from the viewpoint of relative value statistics, instead of the normal Strike Rate, Batting Average, and
so on. They also created a T20 simulator that, based on the batsman, bowler, number of overs bowled, and
number of wickets lost in the first innings, can calculate a target score and how aggressively the batsman
should play in the second innings.
Ayesha Choudhary and A. Rabindra Lamsal [2020] used data from the official website of the Indian Premier
League to compile this article. Since the data had a lot of features, they analysed it and picked out a few of
the most important ones. They pre-processed the data and implemented some selection models using the sci-
kit-learn machine learning library. Using these feature selection models, they were able to identify 5 main
features out of a total of 15. Home team, away team, location, toss winner, toss decision, and winner are the
features. They used 10 seasons of IPL data to train the Random Forests and Multiple Linear Regression
models, followed by the 11th season's data. Their model was able to correctly identify 41 out of 60 matches.
So, their accuracy is just 68.33%, which is not great. This model has limitations in that it only uses 5 features
and two machine learning methods.
   IJCRT2104611       International Journal of Creative Research Thoughts (IJCRT) www.ijcrt.org       5093
www.ijcrt.org                                   © 2021 IJCRT | Volume 9, Issue 4 April 2021 | ISSN: 2320-2882

Shah [2017] also proposed new metrics for evaluating players' results. The new batsman's measure considers
the quality of each bowler he faces, while the new bowler's measure considers the quality of each batsman he
bowls too. The total performance index of a batsman is the amount of each batsman's performance against
each bowler. Similarly, a bowler's overall performance index is the amount of his or her performance against
each batsman.
Srinivas Munukutla and Shruthi Racha [2020] used 16 features to train the model in this paper. Average runs
scored by a player, the average number of 4s and 6s struck by a player, average strike rate of a player, number
of times a player is not out, Number of the 50s and 100s scored by a player, total number of matches played
by a player, present and average batting position, average number of wickets taken in a match by a bowler,
average economy and average runs conceded, average number of wide and no-balls bowled, and last but not
least, an average number of maiden overs bowled, They had collected data from all domestic, league, and
international T20 matches. Many machine learning algorithms are used, including Randomizes Forest, Naive
Bayes, Decision Trees, Linear SVM, and Non-Linear SVM, with data from 5390 T20 matches being used to
train them. After putting the model through its paces, the Support Vector Machine came out on top with a
prediction accuracy of 63.9 percent.
Saravanan, D. Swetha [2017] This paper only mentions the most important factors that determine the outcome
of a cricket match. To predict the match outcome, no machine learning model has been trained. Pitch, toss,
and team strength are among the variables addressed in this paper, as are previous records, home-field
advantage, current results, and weather. The pitch is extremely significant in the match because it determines
how the ball will behave. The toss is also significant because teams chasing first win more games. After all,
the goal is known, and dew comes into play later in the evening. We can easily determine the team's strength
by measuring the average of all players and their current form. Past outcomes are crucial in predicting future
results; how a team performs on the field against a specific opponent is crucial. When a team plays on its
home turf, the crowd becomes the team's 12th man, and the players are more familiar with the playing
conditions. To predict the winner, it is also essential to look at the team's and players' current form. The
weather affects the ball's swing and the outcome of the game. These features can be used to improve the
model's prediction accuracy by training it with them.
Jaishankar Harshit, E. Gundam Rajkumar [2018] This paper compares different supervised machine learning
algorithms for predicting match outcomes. Cric info provided a dataset of 5000 one-day international
matches, of which 70% were used to train the model and 30% were used to test it. They use machine learning
algorithms such as Support Vector Machine, Logistic Regression, Decision Tree, and Bayes Classifier. They
received 60, 65, 67, and 72 percent of the vote, respectively. As can be shown, the Bayes classifier has the
highest accuracy of all the classifiers.

III. PROPOSED TOOLS
Tableau Desktop: Tableau Desktop may be a business intelligence and knowledge mental image tool that
may be employed by anyone. It makes a specialty of remodelling boring tabulated knowledge into eye-candy
graphs and representations. With tableau desktop, you will get pleasure from the period knowledge analytics
by directly connecting to knowledge from your knowledge warehouse. you will simply import your knowledge
into Tableau’s knowledge engine from multiple sources Associate in Nursing integrates them by combining
multiple views in an interactive dashboard.
Tableau Online: This is a hosted version of the Tableau Server. it is sometimes battery-powered with the
assistance of cloud computing to create the package accessible to everybody. this permits quicker and easier
access to business intelligence on the go. you will publish dashboards created in Tableau Desktop and share
them with colleagues.

   IJCRT2104611      International Journal of Creative Research Thoughts (IJCRT) www.ijcrt.org      5094
www.ijcrt.org                                   © 2021 IJCRT | Volume 9, Issue 4 April 2021 | ISSN: 2320-2882

IV. PROPOSED FUNCTIONS
Number Function: Number functions enable you to perform computations on the information values in your
fields. variety functions will solely be used with fields that contain numerical values. For a lot of data, see
information varieties. For example, you may have a field that contains values for the variance in your budget,
titled Budget Variance. one in every one of those values can be -7. you will be able to use the ABS operate to
come back absolutely the price of that variety, and everyone the opposite numbers in this field.

String Function: String functions enable you to control string information (i.e., information made from text).
For example, you may have a field that contains all your customers' 1st and last names. One member may be
Jane Johnson. you will be able to pull the last names from all your customers into a replacement field
employing a string operates.
Date Function: Date functions enable you to control dates in your information supply. For example, you may
have a date field with year, month, and day for every price (2004-04-15). From these existing values, you will
be able to produce new date values with a date operation, as the DATETRUNC operates. as an example, you
will be able to notice the date of the start of the quarter for any existing date price.
Type conversion: Type conversion functions enable you to convert fields from one information sort to a
different one. as an example, you will be able to convert numbers to strings, like age values (numbers) to
string values so Tableau does not try and mixture them. The results of any expression in a very calculation
are often reborn to a particular information sort. The conversion functions square measure STR (), DATE (),
DATETIME (), INT (), and FLOAT (). as an example, if you would like to forge a floating purpose variety.
logical functions: Logical calculations enable you to work out if a precise condition is true or false (Boolean
logic). as an example, you may need to quickly see if sales for every country you distribute your merchandise
to were higher than or below a precise threshold.
Aggregate Functions: Aggregate functions enable you to summarize or modification the coarseness of your
information. For example, you may need to grasp specifically what percentage of orders your store had for a
specific year. you will be able to use the COUNT operate to summarize the precise variety of orders your
company had, so break the image down by year.
V. EXPERIMENTATION AND RESULT

Fig 1.0 All man of the match awards MI – CSK games.

   IJCRT2104611      International Journal of Creative Research Thoughts (IJCRT) www.ijcrt.org      5095
www.ijcrt.org                                  © 2021 IJCRT | Volume 9, Issue 4 April 2021 | ISSN: 2320-2882

Fig 1.1 MI vs CSK.

  IJCRT2104611       International Journal of Creative Research Thoughts (IJCRT) www.ijcrt.org    5096
www.ijcrt.org                                  © 2021 IJCRT | Volume 9, Issue 4 April 2021 | ISSN: 2320-2882

Fig 1.2 No. of games hosted in each stadium.

Fig 1.3 No of games hosted in each city.

  IJCRT2104611       International Journal of Creative Research Thoughts (IJCRT) www.ijcrt.org    5097
www.ijcrt.org                                 © 2021 IJCRT | Volume 9, Issue 4 April 2021 | ISSN: 2320-2882

Fig 1.4 Top 20 players with most “man of the match awards”.

Fig 1.5 Total wins by each team.

  IJCRT2104611      International Journal of Creative Research Thoughts (IJCRT) www.ijcrt.org    5098
www.ijcrt.org                                  © 2021 IJCRT | Volume 9, Issue 4 April 2021 | ISSN: 2320-2882

Fig 1.6 Highest run scorers by season.

Fig 1.7 Total wickets by tournament winners by season

  IJCRT2104611       International Journal of Creative Research Thoughts (IJCRT) www.ijcrt.org    5099
www.ijcrt.org                                 © 2021 IJCRT | Volume 9, Issue 4 April 2021 | ISSN: 2320-2882

Fig 1.8 Total runs by tournament winners by season

Fig 1.9 Breakdown of dismissal type

  IJCRT2104611      International Journal of Creative Research Thoughts (IJCRT) www.ijcrt.org    5100
www.ijcrt.org                                   © 2021 IJCRT | Volume 9, Issue 4 April 2021 | ISSN: 2320-2882

Fig 2.0 Biggest win by runs per season.

Fig 2.1 Toss decision at each venue in MI vs CSK matches

VI. FUTURE SCOPE
The twenty-first century is dominated by knowledge and really, it is bobbing up to be the ‘blood’ of this
technology-driven era. The upsurge of knowledge on a world platform foretells that it is aiming to dictate the
planet for coming years, all credit goes to IoT, digit media platforms, and smartphones. While talking
concerning knowledge Science future scopes, Eric solon states, “the whole human civilization is
   IJCRT2104611      International Journal of Creative Research Thoughts (IJCRT) www.ijcrt.org     5101
www.ijcrt.org                                    © 2021 IJCRT | Volume 9, Issue 4 April 2021 | ISSN: 2320-2882

manufacturing such a colossal quantity of knowledge in barely forty-eight hours that it's compared with the
information. since the dawn of civilization till fifteen years before”. One of the foremost prevailing usages of
knowledge Science is that the recommendation engine. the majority might have detected that searching sites
or a web series website usually advocate series of products consistent with one’s past selections. That is
specifically what knowledge scientists do. With the assistance of associate degree formula and client
behaviours, they manage to create made-to-order recommendation charts. In today’s situation, the massive
quantity of knowledge of information is birth to nice future scope for data analytics.

VII. CONCLUSION
The biggest advantage info science over ancient statistics is that it will draw conclusions from a trash heap
of purportedly unrelated information an overwhelming growth of information archives displays a challenge
to varied industries as these are currently troubled to form use of such a huge quantity of data virtually
ninetieth of all knowledge ever recorded worldwide has been created within the last decade alone this
clearly suggests that administrations and firms that adopt modern knowledge science analysis will expect
business growth and better revenues.
For instance, knowledge scientists calculated that the us attention system may save 300 billion annually
through an adequate implementation of information science principles today it is the necessary precondition
for all stakeholders to research knowledge and use those conclusions to get growth knowledge science is
attracting a lot of and a lot of young minds thus we have set to allow you a first-hand summary of the foremost
necessary lessons learned from knowledge science comes.
                                                REFERENCE

[1] Dr Ranjith, Dr Aparna Varma, Dr Ashwini and Rajesh Nair, "Indian Premier League - Cricket,
entertainment or business? " (2020).
[2] Passi and Nirav Kumar Pandey, "Predicting player's performance in one day international cricket
matches using machine learning", Computer Science & Information Technology (CS & IT) (2017).
[3] Ashok Pal, “Webometric evaluation of the website of IPL” (2017).
[4] Davis, Jack, Harsha Perera, and Tim Swartz. "Player evaluation in Twenty20 cricket." Journal of Sports
Analytics 1.1 (2015): 19-31.
[5] Ayesha Chowdary and A. Rabindra Lamsal, "Predicting Outcome of Indian Premier League (IPL)
Matches Using Machine Learning" (2020).
[6] Srinivas and Sruthi Racha, "Prediction of the outcome of a Twenty-20 cricket match” (2020).
[7] Saravanan, D. Swetha, "Analysis on attributes deciding cricket winning “(IRJET, 2017).
[8] Jaishankar Harshit, and Rajkumar, "Cricket match outcome prediction using Machine learning"
(IJRASET, 2018).
[9] H.H. Lemmer, “A test for cricket players batting efficiency”, South African Journal for Research in Sport,
Physical Education and Recreation 26(1), 55-64, 2004.
[10] H.H. Lemmer, “Batting and bowling success tests for list- and first-class cricket matches”, South African
Journal for Research in Sport, Physical Education and Recreation (SAJR SPER).
[11] IPLT20.Com "Indian Premier League Official Website", http://www.iplt20.com.
[12] Tableau.com “Tableau Official Website” https://www.tableau.com/

   IJCRT2104611       International Journal of Creative Research Thoughts (IJCRT) www.ijcrt.org      5102
You can also read