Strategic Review of Food Security and Nutrition in Indonesia - 2019-2020 Update SMERU Research Report
←
→
Page content transcription
If your browser does not render page correctly, please read the page content below
SMERU Research Report

     Strategic Review of Food Security and
     Nutrition in Indonesia
     2019–2020 Update

    Sirojuddin Arif

    Widjajanti Isdijoso

    Akhmad Ramadhan Fatah

    Ana Rosidha Tamyis
SMERU RESEARCH REPORT

Strategic Review of Food Security and Nutrition in
          Indonesia: 2019–2020 Update

                     Sirojuddin Arif

                   Widjajanti Isdijoso

                Akhmad Ramadhan Fatah

                  Ana Rosidha Tamyis

            The SMERU Research Institute
                    August 2020
Strategic Review of Food Security and Nutrition in Indonesia: 2019–2020 Update

Authors: Sirojuddin Arif, Widjajanti Isdijoso, Akhmad R. Fatah, Ana R. Tamyis

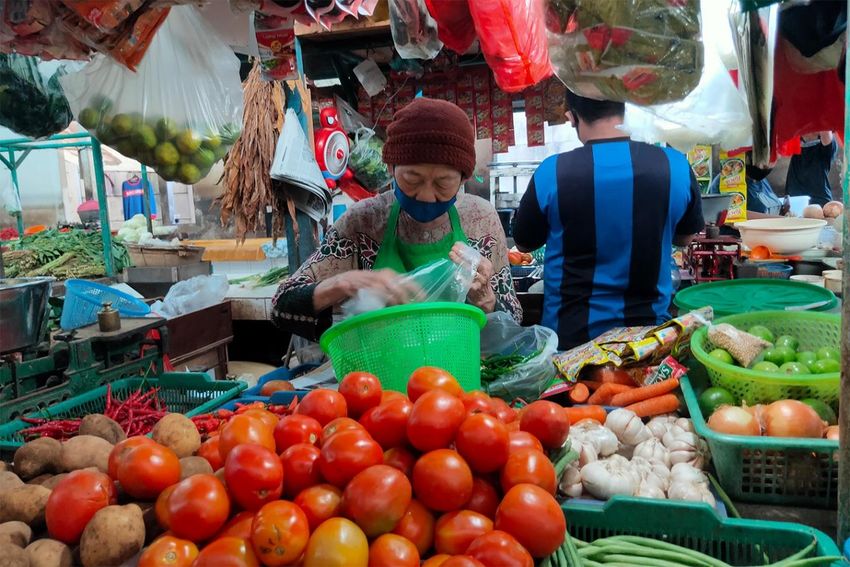
Cover photo: Mukti Mulyana.

This work is licensed under a Creative Commons Attribution-NonCommercial 4.0 International License.

The World Food Programme encourages the dissemination of the material contained in this publication on condition that reference is made
to the source.

The findings, views, and interpretations published in this report are those of the authors and should not be attributed to any of the agencies
providing financial support to the SMERU Research Institute.

A significant part of the research in this publication uses interviews and focus group discussions. All relevant information is recorded and
stored at the SMERU office.

© World Food Programme, 2020

The SMERU Research Institute Cataloging-in-Publication Data

Sirojuddin Arif
Strategic Review of Food Security and Nutrition in Indonesia: 2019–2020 Update/ Sirojuddin Arif, et al.
  --Jakarta: Smeru Research Institute, 2020
  --xi; 70 p; 29 cm.
    ISBN 978-623-7492-41-2
    ISBN 978-623-7492-42-9 [PDF]

1. Food Security 2. Nutrition 3. Indonesia
I. Title

                                                                                                                            363.8 –ddc 23
RESEARCH TEAM

  SMERU Researchers

       Sirojuddin Arif

     Widjajanti Isdijoso

  Akhmad Ramadhan Fatah

    Ana Rosidha Tamyis

 Regional Researchers

 Yakomina Welmince Nguru

    Ari Ratna Kurniastuti
ACKNOWLEDGEMENTS

This report is the outcome of a review commissioned by the United Nations World Food Programme
(WFP) and conceptualized and conducted by a team from the SMERU Research Institute.

The team is grateful to experts and practitioners in key government agencies and non-governmental
organizations that have provided invaluable information and data for this study. In particular, we
would like to express our sincere appreciation and gratitude to the participants of the focus group
discussions that were conducted in various stages of the study in 2019. At the national level, the team
is immensely indebted to the Coordinating Ministry for Economic Affairs; Coordinating Ministry for
Human Development and Cultural Affairs; the Meteorological, Climatological and Geophysical Agency
(BMKG); Ministry of Agriculture; Ministry of Education; Ministry of Finance; Ministry of Health;
Ministry of Social Affairs; National Disaster Management Agency (BNPB); Ministry of National
Development Planning/National Development Planning Agency (BAPPENAS); Sustainable
Development Goals (SDG) Secretariat; Secretariat of the Vice President of the Republic of Indonesia;
the National Team for the Acceleration of Poverty Reduction (TNP2K) and the National Team for the
Acceleration of Stunting Prevention (TP2AK) in the Vice President’s office for their inputs to the initial
design of the study. Our thanks also go to the Faculty of Medicine of the University of Indonesia,
Humanitarian Forum Indonesia, and Indonesia International Institute for Life-Sciences (i3L) for their
useful information about the current condition of food security and nutrition in the country.

We also would like to express our gratitude to Bustanul Arifin, Professor of Agricultural Economics of
Lampung University; Prasinta Dewi, Deputy for Logistics and Equipment of the National Agency for
Disaster Management; Doddy Izwardy, Head of the National Institute of Health Research and
Development of the Ministry of Health; Rachmat Koesnadi, Director of Social Protection for Natural
Disaster Victims of the Ministry of Social Affairs; and Vivi Yulaswati, Expert Staff for Social Affairs and
Poverty Reduction of the Ministry of National Development Planning/National Development Planning
Agency (BAPPENAS); Dodo Gunawan, Head of Climate Change Information Center of the Meteorological,
BMKG; Iing Mursalin, Arip Muttaqin and Lucy Widasari of the National Team for the Acceleration of
Stunting Prevention (TP2AK) at the Vice President’s Office; Dhian Probhoyekti, Director of Public Health
Nutrition of the Ministry of Health; and Rachmi Widiarini, Head of Availability of Food of the Food
Security Agency of the Ministry of Agriculture for their help during different stages of the study.

The team is also thankful for the contributions received from experts and practitioners in key
government agencies and institutions in East Java and East Nusa Tenggara Provinces during focus
group discussions and interviews conducted in those two provinces. In East Java, we are thankful to
the Agricultural Office, Animal Husbandry Office, Education Office, Health Office and Regional
Development Planning Office (BAPPEDA) of East Java Province. We are also grateful to the BPS Office
of East Java, BMKG Office of East Java, Faculty of Public Health of the University of Airlangga, and
Regional Agency for Disaster Management (BPBD) of East Java Province.

In East Nusa Tenggara, the team is indebted to the Agricultural Office, Education and Cultural Office,
Economic and Development Assistance Office, Health Office, Office of Fishery and Maritime Affairs,
Planning, Development, Research and Regional Development (Bappelitbangda), and Social Office of
East Nusa Tenggara Province. We are also grateful to the BMKG East Nusa Tenggara, BPS East Nusa
Tenggara, Faculty of Public Health of Nusa Cendana University, and the WFP East Nusa Tenggara Office
in Kupang. Our thanks also go to the Agricultural Office and Health Office of Kupang District for their
participation in the focus group discussion in the province.

                         The SMERU Research Institute                                                    i
We would also like to express our gratitude to WFP for their constructive comments on earlier drafts
of the document, and to Elan Satriawan, Chief of Policy Team of TNP2K and Associate Professor of
Economics, the Department of Economics of Universitas Gadjah Mada for his peer review.
Finally, we are also grateful to Sudarno Sumarto, Ridho Al Izzati, and Nina Toyamah of the SMERU
Research Institute for the help and support provided throughout the study.
The SMERU Research Institute
iiTABLE OF CONTENTS
ACKNOWLEDGEMENTS i
TABLE OF CONTENTS iii
LIST OF TABLES iv
LIST OF FIGURES iv
LIST OF BOXES iv
LIST OF APPENDICES v
LIST OF ABBREVIATIONS vi
EXECUTIVE SUMMARY viii
I. INTRODUCTION 1
1.1 Background 1
1.2 Objectives 2
1.3 Methodology 2
1.4 Structure of the Report 4
II. ANALYSIS OF THE FOOD SECURITY AND NUTRITION SITUATION 5
2.1 Progress on Food Security 5
2.2 Progress on Nutrition 11
2.3 New Challenges for Food Security 15
2.4 New Challenges for Nutrition 18
III. RESPONSE AND GAP ANALYSIS 20
3.1 Food Availability Policies and Programmes 21
3.2 Food Access Policies and Programmes 24
3.3 Food Utilization and Nutrition Improvement Policies and Programmes 28
3.4 Institutional Arrangements for Food Security and Nutrition 33
IV. THE IMPACT OF COVID-19 ON FOOD SECURITY AND NUTRITION 38
4.1 The Outbreak of COVID-19 and Its Impact on Food Security and Nutrition 38
4.2 Government Responses to the Outbreak of the COVID-19 Pandemic 41
4.3 Addressing the Impacts of COVID-19: What Needs to Be Done 46
V. CONCLUSIONS AND RECOMMENDATIONS 49
5.1 Conclusions 49
5.2 Recommendations 50
LIST OF REFERENCES 54
APPENDICES 64
The SMERU Research Institute iiiLIST OF TABLES
Table 1. Indonesia’s Progress in the Provision of Health Care for Women and Children 10
Table 2. Prevalence of Stunting and Wasting among Children, by Gender 12
Table 3. Classification of Undernutrition Levels among Children under 5 12
Table 4. Number of Districts/Cities by Severity Level of Stunting (2018) 13
Table 5. Production Targets of Food Sovereignty, 2014–2019 21
Table 6. Nutrition-Specific and Nutrition-Sensitive Interventions 32
Table 7. National Action Plan for Food and Nutrition (RAN-PG) 2015–2019: Multisectoral Approach35
Table 8. National Strategy to Accelerate Stunting Prevention (2018–2024): Pillars, Objectives,
Strategies and Coordinators 36
Table 9. Expansion of Social Protection Programmes during the COVID-19 Outbreak 44
LIST OF FIGURES
Figure 1. Scope of the Strategic Review of Food Security and Nutrition 2
Figure 2. Analytical Framework of the Strategic Review of Food Security and Nutrition 4
Figure 3. Changes in Rural and Urban Household Food Expenditures, 2013–2019 9
Figure 4. Nutrition Status of Children Under 5, 2007–2018 12
Figure 5. Changes in the Prevalence of Stunting in Indonesia, 2013–2018 13
Figure 6. Overnutrition among Children, Teenagers, and Adults, 2013–2018 14
Figure 7. Incidence of Food Insecurity by Consumption Decile and Geographical Area 17
Figure 8. Changes in Harvested Area of the Vegetables and Staples, 2014–2019 23
LIST OF BOXES
Box 1. Food Production in East Nusa Tenggara (NTT) 22
Box 2. Gender Inequality in the Agricultural Sector in Indonesia 24
Box 3. The Evolution of Food Assistance for the Poor 26
Box 4. Family Hope Programme (Program Keluarga Harapan, PKH) 27
Box 5. National Action Plan for Food and Nutrition 2017–2019 (RAN-PG) Nutrition Improvement
Programmes 31
The SMERU Research Institute
ivLIST OF APPENDICES
Appendix 1. Indonesia’s Food Balance, 2013–2019 (in million tons) 65
Appendix 2. Food Insecurity in Indonesia 66
The SMERU Research Institute vLIST OF ABBREVIATIONS
ADB Bank Pembangunan Asia Asian Development Bank
ALC Konversi Lahan Pertanian Agricultural Land Conversion
BAPPEDA Badan Perencanaan Pembangunan Regional Development Planning Agency
Daerah
BAPPENAS Badan Perencanaan Pembangunan Ministry of National Development
Nasional Planning/National Development Planning
Agency
BKP Badan Ketahanan Pangan Food Security Agency
BMKG Badan Meteorologi, Klimatologi, dan Meteorological, Climatological, and
Geofisika Geophysical Agency
BNPB Badan Nasional Penanggulangan National Disaster Management Agency
Bencana
BPBD Badan Penanggulangan Bencana Regional Disaster Management Agency
Daerah
BPOM Badan Pengawas Obat dan Makanan National Agency for Drug and Food
Control
BPNT Bantuan Pangan Non Tunai Non-Cash Food Social Assistance
BPS Badan Pusat Statistik Central Bureau of Statistics
CCA Adaptasi Perubahan Iklim Climate Change Adaptation
COVID-19 Penyakit yang disebabkan virus Coronavirus Disease
Corona
DKP Dewan Ketahanan Pangan Food Security Council
DRR Pengurangan Risiko Bencana Disaster Risk Reduction
DTKS Data Terpadu Kesejahteraan Sosial Integrated Database for Social Welfare
FDS Pertemuan Peningkatan Kapasitas Family Development Session
Keluarga
FGD Kelompok Diskusi Terpumpun Focus Group Discussion
GDP Produk Domestic Bruto Gross Domestic Product
GNI Pendapatan Nasional Bruto Gross National Income
ha Hektar Hectare
IFPRI Lembaga Penelitian Kebijakan Pangan International Food Policy Research
Internasional Institute
Kemenko PMK Kementerian Koordinator Bidang Coordinating Ministry for Human
Pembangunan Manusia dan Development and Cultural Affairs
Kebudayaan
KSPG Kebijakan Strategis Pangan dan Gizi Strategic Policy for Food Security and
Nutrition
The SMERU Research Institute
viMDGs Tujuan Pembangunan Milenium Millennium Development Goals
MoA Kementerian Pertanian Ministry of Agriculture
MoH Kementerian Kesehatan Ministry of Health
MoSA Kementerian Sosial Ministry of Social Affairs
NTT Nusa Tenggara Timur East Nusa Tenggara
PHEOC Pusat Pengendalian Keadaan Darurat Public Health Emergency Operation
Kesehatan Masyarakat Centre
PKH Program Keluarga Harapan Family Hope Programme
Posyandu Pos Pelayanan Terpadu Integrated Health Post
Posyandu cadre Kader Posyandu Volunteers, mainly women, providing
outreach services from the Posyandu
PPH Pola Pangan Harapan Desirable Dietary Patterns
Rastra Beras Sejahtera Prosperous Rice
Raskin Beras untuk Rumah Tangga Miskin Rice Subsidy Programme for Poor
Households
RAN-PG Rancangan Aksi Nasional Pangan dan National Action Plan for Food and
Gizi Nutrition
Riskesdas Riset Kesehatan Dasar Basic Health Survey
RPJMN Rencana Pembangunan Jangka National Medium-Term Development
Menengah Nasional Plan
SDGs Tujuan Pembangunan Berkelanjutan Sustainable Development Goals
SEMBAKO Nama program bantuan sosial dalam Name of food aid programme
bentuk pangan
Stranas Stunting Strategi Nasional Percepatan National Strategy to Accelerate Stunting
Pencegahan Anak Kerdi Prevention
TNP2K Tim Nasional Percepatan National Team for the Acceleration of
Penanggulangan Kemiskinan Poverty Reduction
TP2AK Tim Percepatan Pencegahan Anak National Team for the Acceleration of
Kerdil Stunting Prevention
UKP-PPP Unit Kerja Presiden Bidang Presidential Working Unit for
Pengawasan dan Pengendalian Development Monitoring and Control
Pembangunan
WFP World Food Programme World Food Programme
The SMERU Research Institute viiEXECUTIVE SUMMARY
As Indonesia has been experiencing impressive economic advancement and emerging as an upper-
middle income country, it has also recorded important progress in enhancing food security and
nutrition. Access to food increased and undernutrition continued to decrease over the last few years.
However, the nutritional status of Indonesians is still low by international standards, and the variation
across regions remains huge. While struggling to address long-standing food security and nutrition
challenges, Indonesia is currently facing an unprecedented crisis triggered by the COVID-19 pandemic.
Thus, new and enhanced strategies are needed for the country to achieve the 2030 Agenda, especially
Sustainable Development Goal 2 (SDG 2), which states that by 2030 the country will end hunger, achieve
food security and improved nutrition and promote sustainable agriculture.
This report is an update of the 2014–2015 Strategic Review. It was initiated in August 2019 and was
extended until July 2020 to cover the initial impact of the COVID-19 pandemic on food security and
nutrition. It is based on the latest secondary data available, updates on relevant policies and
programmes related to food security and nutrition, the latest discourses, and emerging issues,
including the impact of the COVID-19 pandemic. This report presents: (1) an update on the food
security and nutrition situation since the 2014–2015 Strategic Review, mostly referring to data from
2013 to the most recent available and covering the three dimensions of food security (availability,
access and utilization), the trend in nutritional status, the effects of disasters and climate change on
food security and nutrition, and new challenges in nutrition; (2) an analysis of the latest development
in policies and programmes that are aiming at improving the food security and nutritional status, both
at national and sub-national levels; (3) the potential impact of the COVID-19 pandemic on food
security and nutrition (through July 2020); and (4) conclusions and recommendations on measures to
improve food security and nutrition in the country.
The situation analysis shows that Indonesia has made important progress in further improving food
security and nutrition. Nevertheless, some challenges remain. First, the increases in the production of
most food commodities, especially rice, have not caught up with the increase in consumption. The
persistent dependency on rice imports could threaten food security during the COVID-19-induced
crisis. Second, although insufficient food consumption is declining, in 2018, around 21 million people
in Indonesia still had calorie intake below the minimum dietary requirement. Poverty and high food
prices in relation to income remain major challenges in the effort to increase access to food. Third,
the food consumption pattern of most Indonesians is still less than ideal, with carbohydrates
continuing to dominate the food intake; insufficient consumption of sources of protein, fruits and
vegetables; and the increasing trend in processed food consumption in both urban and rural areas.
Fourth, even though the prevalence of stunting (low height for age), underweight and wasting (low
weight for height) among children under 5 declined since 2013, the level of undernutrition is still high
by international standards. In addition, the prevalence of overweight and obesity has steadily
increased among children 6 to 12 years old, adolescents and adults. Evidence also suggests that
micronutrient deficiencies prevail although representative data has not been collected for years.
Indonesia is thus facing a triple burden of malnutrition in which undernutrition co-exists with
overnutrition and micronutrient deficiencies. The current crisis caused by the COVID-19 pandemic and
social distancing measures could erode the progress that has been achieved.
The policy analysis highlights significant progress as well as some policy gaps. Indonesia is still facing
big challenges in increasing and diversifying food production that can support nutritional
improvement toward more balanced diets. The focus on increasing rice production has not been able
to meet the government ambition to significantly reduce import dependency, and it comes at the
expense of less than sufficient effort to increase the production of fruit and vegetables, as well as
The SMERU Research Institute
viiisources of plant and animal protein, with the exception of fish. Thus, the Indonesian Government
need not only increase productivity of food commodities, but also give more support to the production
of a more diversified range of food commodities. In addition, there is also a need to further
acknowledge women’s role in agriculture, and to provide support to women farmers to have full
access to opportunities in this sector.
Regarding access to food, there has been significant progress in the development of social protection
schemes as a vehicle to ensuring sufficient access to food for poor and vulnerable people. This is
important as the price of various food commodities, particularly rice, in Indonesia is still relatively high.
Furthermore, there have been commendable initiatives undertaken by the Government to make social
protection schemes—particularly SEMBAKO and Program Keluarga Harapan (PKH)—more nutrition-
sensitive. There are some implementation constraints that still need attention, particularly in
improving the quality of the social welfare beneficiary database for better targeting, and further
enhancement of the nutritional sensitivity of both regular social protection and social assistance
provided during disaster or crises situations.
Indonesia is still facing challenges in various aspects of food utilization. Regarding food safety, there
is a need to update the existing regulations, increase the capacity of the oversight organization and
better educate the public. For the promotion of a balanced diet, the formulation of desirable dietary
scores needs to be adjusted in order to target a lower proportion of carbohydrate intake, and higher
proportion of fruit and vegetables in line with the latest Ministry of Health guidance on a balanced
diet. With regard to further nutritional improvements, despite significant efforts to improve both
nutrition-sensitive and nutrition-specific interventions, the effectiveness of these efforts needs to be
enhanced by increasing awareness and knowledge of all stakeholders at all levels of the Government,
and making the effort more holistic and integrated. In addition, it is also important to increase more
attention to data availability on micronutrient deficiencies to have a basis for tackling all aspects of
the triple burden of malnutrition, for example through food fortification.
Regarding institutional arrangements, the latest approach of assigning the leadership on improving
nutrition under the Vice President is intended to strengthen coordination efforts, particularly related
to stunting. However, the effort to link the production, access and utilization sides of food security
with nutrition improvement efforts requires further attention. The fact that various related authorities
in food security and nutrition-sensitive services are in the hands of district governments requires
concerted efforts to translate central-level policies into effective local-level action. In this regard, the
latest government approach to implement regional targeting and focus on an integrated approach to
targeted districts and villages could potentially produce more effective results.
In 2020, the challenge of addressing food insecurity and malnutrition further increased due to the
outbreak of COVID-19. The Central Bureau of Statistics revealed that as the Indonesian economy
contracted by 2.4 percent (q-to-q) in the first quarter of 2020, around 1.6 million more people have
fallen into poverty between September 2019 and March 2020 (BPS, 2020d, 2020e). The Government
has responded swiftly with a scaling up of social protection programmes, but challenges with the social
protection database remain, including the risk of missing many of the most vulnerable, including
women-headed households and people with disabilities. As COVID-19 has also affected the
implementation of government policies and programmes on health and nutrition, urgent measures
are needed to ensure that these services continue.
Based on this analysis, some recommendations are made to decision-makers to deal with the impacts
of COVID-19 on food security and nutrition. Addressing the effects of COVID-19 requires the
Government to take a rather short-term perspective to prevent the pandemic from eliminating the
The SMERU Research Institute ixprogress made so far and ensuring that the country can continue its path to achieving SDG 2 by 2030.
The recommendations are as follows.
1. Food availability: The Government needs to closely monitor the rice stocks and pursue a flexible
trade policy making timely import adjustments when necessary. They also should maintain
farmers’ incentives to uphold food production by ensuring input supplies, concessions for loan
repayment and links to the market. Improvements in the transportation and overall supply
chain system are also required to ensure that food commodities remain available and prices do
not rise.
2. Food access: The Government needs to continue to ensure that all poor and vulnerable
households receive social protection to cushion the impacts of COVID-19. Efforts to expand
social assistance may need to involve sub-national governments and non-profit or community-
based organizations.
3. Food utilization: The Government needs to ensure that children and pregnant and lactating
mothers can have access to basic health services again, especially in those village health posts
(Posyandus) and community health centres (Puskesmas) that were closed in the last few months
due to COVID-19—without compromising the safety of health workers or patients.
4. Nutrition: To prevent an increase in wasting and stunting during the COVID-19 crisis, the
Government needs to expand the provision of supplementary foods (e.g. fortified biscuits) to
help children and pregnant and lactating mothers from vulnerable groups to meet their
nutrition requirements.
Actions are required on many dimensions of food security and nutrition to address long-standing
shortcomings in these policy domains as well as new challenges, especially the rise of the triple burden
of malnutrition. It is very important for the Government to stay on track and ensure that SDG 2 can
be achieved by 2030 with no one being left behind. Therefore, this review makes the following
recommendations:
1. Broaden the policy focus beyond stunting to address the triple burden of malnutrition. The
Government should broaden its policy focus not only on stunting but also on other dimensions
of malnutrition, especially wasting, obesity, overweight and micronutrient deficiencies. With
regard to micronutrient deficiencies, a representative survey is required on the results of which
respective supplementation and fortification plans can be based.
2. Promote a balanced diet through social and behavioural change communication with the
population. To promote a balanced diet, not only does the Government need to improve its
mass communication strategies but they also need to further support the population to put the
messages of such a campaign into practice. For example, a diversified diet needs to be
affordable by all sectors of society, either directly or through social protection measures.
3. Improve access to diversified food through the development of diversified, resilient and
nutrition-sensitive food systems. It is also important for the Government to ensure the
availability and accessibility of diversified food by developing a diversified agricultural system
that is nutrition-sensitive and resilient to climatic shocks. Access to diversified food can also be
improved by enhancing food affordability.
4. Ensure social protection programmes are targeting those most in need, so that no one is left
behind. Overall funding for social protection programmes is limited, so the Government needs
to ensure that inclusion and exclusion errors are prevented as much as possible; they also need
to be made more gender- and disability-responsive, nutrition-sensitive and adaptive to shocks.
5. Ensure proper utilization of food. Only healthy bodies can appropriately utilize a diversified
diet, so it remains fundamental that access to clean water and decent sanitation (including toilet
facilities) be expanded, especially for poor and vulnerable groups. The coverage of health
services, especially for children and pregnant and lactating mothers, is also to be ensured.
The SMERU Research Institute
x6. Address gender inequality to improve food security and nutrition. The Government needs to
address the various problems that contribute to maintaining or exacerbating gender inequality
and support women’s access to information on nutrition and diversified diets, means of
agricultural production and marketing, health services, social protection and access to
education and economic opportunities in general.
7. Strengthen the monitoring and evaluation system to enhance policies and programmes on
food security and nutrition. Rigorous government monitoring and evaluation should be
conducted, and a proper mechanism be put in place to ensure that the results of the monitoring
and evaluation will loop back to policy or programme enhancement.
8. Strengthen the governance of food security and nutrition or rather food systems as a whole
through the development of an effective coordinating agency. The governance of food
systems could be enhanced by strengthening policy coordination under the Vice President’s
Office as an expansion of the efforts to accelerate the reduction of stunting (Stranas Stunting).
Indeed, it remains highly relevant that the Government develop an effective institution to
govern and coordinate the work of different stakeholders in the areas of food security and
nutrition as parts of one food system.
The SMERU Research Institute xiI. INTRODUCTION
1.1 Background
Indonesia is an emerging upper-middle-income country with a per capita gross national income (GNI) of
$4,050 in 2019 (World Bank, 2020a).1 During the last decade, it recorded an average annual growth of
around 5 percent per year. As one of the results, the country has succeeded in steadily reducing poverty
from 14.1 percent in 2009 to 9.2 percent in 2019 (BPS, 2010, 2020e), and slightly reduced economic
inequality from its peak of 4.1 (Gini ratio) in 2014 to 3.8 in 2019 (BPS, 2020b). The economic growth also
contributed to an expanding middle class. According to the World Bank’s estimate, one in every five
Indonesians (around 52 million people) belonged to this group by 2017 (World Bank, 2017). The country
also recorded important progress in human development. Indonesia’s Human Development Index
improved quite significantly from 0.67 in 2010 to 0.71 in 2018 (UNDP, 2019, p. 301).
In line with the economic progress highlighted above, Indonesia has made important progress in
enhancing food security and nutrition. Access to food increased and undernutrition decreased
during the last few years. However, the nutritional status of Indonesians is still low by international
standards, and the variation across regions remains huge. Many people still face the risk of hunger
and malnutrition. According to the 2018 Global Nutrition Report, Indonesia is one of the three
countries with the largest number of wasted children (Development Initiatives, 2018, p. 35).2 As per
the 2018 Basic Health Survey (Riset Kesehatan Dasar, Riskesdas), 10.2 percent of children under 5
in Indonesia were wasted and 30.8 percent were stunted (Kementerian Kesehatan, 2019). The
lowest rate of stunting was observed in Gianyar of Bali Province (12 percent) while the highest rate
was found in Nias of West Sumatra Province (61 percent) (BPS, 2019e). Simultaneously, the country
is witnessing increasing rates of overweight and obesity as well as assumed micronutrient
deficiencies. Indonesia is thus facing a triple burden of malnutrition in which undernutrition co-
exists with overnutrition and micronutrient deficiencies.
While still struggling to address the long-standing food security and nutrition challenges, Indonesia
is currently facing an unprecedented crisis triggered by the COVID-19 pandemic. The worldwide
economic consequences of the pandemic harm Indonesia’s economy through the drop in trade of
goods and services, loss of jobs and income and decreased domestic products. Even worse, as the
virus spreads, the economy is curtailed by measures to prevent it from spreading. Due to the
current unavailability of a vaccine, this virus has the potential to severely affect the health and
socioeconomic status and thus food security and nutrition conditions of significant portions of the
population and diminish the progress made so far. New strategies are needed to ensure that the
2030 Agenda, especially concerning SDG 2, will be achieved.
This report provides an update of the 2014–2015 Strategic Review that was written at a time when
the Government of Indonesia made strong commitments towards formulating and achieving its
Sustainable Development Goals (SDGs) targets, including developing the corresponding road map.
This update takes into account the National Medium-Term Development Plan 2020–2024 (Rencana
Pembangunan Jangka Menengah Nasional, RPJMN) and the health and socioeconomic impact of
the COVID-19 pandemic that Indonesia is currently facing. Based on the latest data and analysis
1Indonesia’s per capita GNI increased from USD 2,150 in 2009 to USD 4,050 in 2019 (World Bank, 2020a).
2According to the 2018 Global Nutrition Report, the three countries with the highest number of wasting are India (25.5
million), Nigeria (3.4 million) and Indonesia (3.3 million). It should be noted, however, that the figure was projected based
on the results of the 2013 Riskesdas (FAO, IFAD, UNICEF, WFP & WHO, 2017, p. 126).
The SMERU Research Institute 1available, as well as the most recent developments in policies and programmes related to food
security and nutrition, this updated review identifies the progress and emerging challenges and
provides an analysis of the responses to them, including to the new challenges posed by the impact
of the COVID-19 outbreak. It aims to provide inputs to the Government of Indonesia’s policy focus.
1.2 Objectives
This update of the 2014–2015 Strategic Review of Food Security and Nutrition aims to provide a
comprehensive and detailed overview and analysis of the national food security and nutrition
situation since 2015 in the context of the 2030 Agenda, specifically concerning SDG 2 and the rapidly
evolving impacts of the recent COVID-19 crisis.
This review has the following four objectives:
1. Determine the current state and progress of national and local-level plans, programmes and
initiatives to achieve sustainable food security and nutrition.
2. Identify the gaps in policy, strategy, data availability and analysis and programmes, and
recommend interventions to improve food security and nutrition.
3. Provide an overview of measures required to accelerate progress towards achieving SDG 2
by 2030, under the premise of “leaving no one behind.”
4. Assess the impacts of the outbreak of COVID-19 on food security and nutrition, identify the
gaps in the Government’s responses to the pandemic and recommend interventions to
mitigate the impacts of COVID-19 on food security and nutrition.
1.3 Methodology
The analysis of the national food security and nutrition situation in Indonesia covers four main aspects:
situational analysis, response analysis, gap analysis, and suggested measures to fill the gaps (Figure 1).
Analytical
process/
Situation Response Suggested
Gap analysis
lenses
analysis analysis measures
Macroeconomic environment
Interventions:
Food security and nutrition policies and programmes
Analytical themes & indicators
Social policies and programmes
Disaster/risk management policies and programmes
Households and individuals
Food security Availability (production, distribution)
Access (income, prices)
Utilization (water and sanitation, care)
Nutrition
External shocks:
Disasters
Climate change
Epidemics
Pandemics (e.g. COVID-19)
Conflict
Economic crises
Figure 1. Scope of the Strategic Review of Food Security and Nutrition
The SMERU Research Institute
2This update of the 2014–2015 strategic review of food security and nutrition (SMERU, UKP4, & WFP,
2014) provides analysis based on the following sources.
1. The latest secondary data available, including Riskesdas 2018, consumption patterns from
Statistics Indonesia (Badan Pusat Statistik, BPS) and the Food Security Agency (Badan
Ketahanan Pangan, BKP) of the Ministry of Agriculture (MoA), and other relevant data. In
addition to the national data, this study also explores data at the sub-national level,
particularly from the East Nusa Tenggara Province (Nusa Tenggara Timur, NTT) and East Java
Province. The former province was selected for assessment because it has the highest rate
of stunting while the latter represents a moderate rate. Besides, the two provinces could
inform variations in the challenges in improving food security and nutrition both within and
outside of Java.
2. Updates on relevant policies and programmes that had been included in the 2014–2015
Review as well as those emerging after 2015, which include those formulated by the national
Government and sub-national governments of NTT and East Java. Issues related to disaster
preparedness and management, which were not sufficiently explored in the 2014–2015
Review, are also captured.
3. Latest discourses and emerging issues related to food security and nutrition, from the
perspective of various levels of government (national, provincial and district) and non-
governmental institutions, as well as academic actors and institutions.
The information was collected from literature and document reviews, secondary data analysis, in-
depth interviews and focus group discussions (FGDs) with key policy makers and experts on food
security and nutrition at the national level as well as the regional level (in East Java and NTT). The
preparation of this review began in late September 2019 and most of the interviews and discussions
were conducted until the end of December 2019. Additional data were collected during the COVID-
19 outbreak from March until mid-July 2020.
The framework of analysis generally follows the International Food Policy Research Institute’s
(IFPRI) and the World Food Programme’s (WFP) analytical framework on food security and nutrition
(Ecker & Breisinger, 2012; WFP, 2009). As can be seen in the diagram below (Figure 2), the
framework sees food security and nutrition status of individuals or households from a broader
perspective of food security and nutrition system that consists not only of individuals’ or
households’ food intake and access to food but also macro-economic conditions and various
policies and programmes as well as shocks that may affect individuals’ or households’ food intake
or access to food. Thus, while being necessary, food intake or access to food at the individual or
household level is not sufficient to maintain food security and nutritional status of the population
as other factors are also at play. Nevertheless, the analysis presented in this report focuses on
selected issues that are closely related to food security and nutrition at the household and
individual levels. Other than the availability of food, the analysis covers the situation of access to
food and food intake at household and individual levels, the current nutrition situation and the
governance and institutions at the macro-national level that deal with food security and nutrition.
Regarding policies and programmes, the analysis looks at social security and food security as well
as health and nutrition. In terms of shocks, the study focuses on disasters and climate change as
well as COVID-19.
p
a
The SMERU Research Institute
b3
d
eMacroeconomic Economic growth Public spending Governance &
stability & distribution & investment institutions
Figure 2. Analytical Framework of the Strategic Review of Food Security and
Nutrition
Source: Ecker & Breisinger, 2012, “The Food Security System”; and WFP, 2009, Comprehensive Food Security and
Vulnerability Analysis Guidelines.
1.4 Structure of the Report
This report is presented in five chapters. Chapter 1 presents the background of the study, the
objectives and the methodology. Chapter 2 provides an update on the food security and nutrition
situation since the 2014–2015 Review, mostly referring to data from 2013 to the most recent
available. It covers the three dimensions of food security, the trend in nutrition status, the effects
of disasters and climate change on food security and nutrition and new challenges in nutrition.
Chapter 3 presents an analysis of the latest developments in policies and programmes that aim to
improve food security and nutritional status at national and sub-national levels. Chapter 4 describes
the potential impact of the COVID-19 pandemic on food security and nutrition based on the
situation up to July 2020. Finally, Chapter 5 concludes and provides recommendations on measures
to improve food security and nutrition across the country.
The SMERU Research Institute
4II. ANALYSIS OF THE FOOD SECURITY AND
NUTRITION SITUATION
This chapter gives an overview of Indonesia’s current food security and nutrition situation. It starts
by discussing the country’s progress in improving food security. In line with the widely accepted
World Food Summit (1996) definition of food security, this chapter focuses on the three dimensions
of food security, namely food availability, access and utilization (FAO, 2006). It highlights the
progress Indonesia has made in increasing domestic food production and the extent to which access
to food has increased since 2013. The chapter also discusses some conditions that may affect food
utilization and to what extent they have been improved. Regarding nutrition, the chapter looks into
the progress made in reducing undernutrition as well as the challenges faced in addressing
overnutrition and micronutrient deficiencies. Finally, the chapter discusses some new challenges in
improving food security and nutrition.
2.1 Progress on Food Security
2.1.1 Food Production
Indonesia has successfully increased production of some food commodities. From 2013 to 2019,
maize production nearly doubled from 18.5 million tons to 33 million tons per year; sugar
production declined while soybean and beef production stagnated (Appendix 1). As for rice, it is
quite difficult to assess the production trend between 2013 and 2019 as BPS changed the
estimation method used in 2018.3 However, it is possible to assess the trend of rice production in
two different periods, namely 2013–2017 and 2018–2019. Rice production increased from 41.43
million tons of milled rice in 2013 to 47.17 million tons in 2017, but it decreased from 33.94 million
tons of milled rice in 2018 to 31.31 million in 2019. In line with this trend, the productivity of
(unmilled) rice increased from 5 tons/hectare (ha) in 2010 to 5.34 tons/ha in 2015 but then declined
to 5.2 tons/ha in 2018 and 5.1 tons/ha in 2019 (BPS, 2020c).
The MoA argued that a country may be categorized as self-sufficient if the import dependency ratio
does not exceed 10 percent of the domestic consumption. Based on this criterion, Indonesia can be
considered self-sufficient in rice. Except for 2018, when the country’s import dependency ratio in
rice reached a rather high figure of 6.2 percent, on average only 2.3 percent of domestic
consumption during the 2013–2019 period that came from imports. Due to Indonesia’s high
population and high dependency on rice as the main staple, it had to import 0.9 million tons of
(milled) rice on average every year between 2013 and 2019 from a relatively limited international
rice market, where it had to compete with many other importing countries.
The dependency on rice imports to meet domestic demand has become a major concern during the
current COVID-19 crisis. BPS showed that in the first quarter of 2020, on a year-on-year basis, food
production in Indonesia contracted by 10 percent. This decline was likely to be the result of a
prolonged dry season during the previous year, which moved the rice harvest period into the
second quarter of 2020. Some parts of the country may face a hotter-than-usual dry season this
year, potentially affecting rice production in the second planting season. According to agricultural
3To estimate rice production, the MoA used two sources of information: rice productivity and rice field area data. This
method has been subject to criticism, especially as data on rice field areas were often based on estimates using eyesight.
To address the criticism, BPS introduced in 2018 a new method that uses satellite imagery to estimate the rice field areas.
The SMERU Research Institute 5experts, the country might need to import around 2 million tons of (milled) rice this year (Hartomo,
2020). So far (July 2020), international rice prices have remained stable.
In the case of beef, sugar and soybean, Indonesia’s dependency on import remains (BKP, 2018, p.
25). Indonesia’s import dependency ratio for beef rose from 9.1 percent of total domestic
consumption in 2013 to 34.7 percent in 2019, while the dependency on sugar import increased
from 57.4 percent of total domestic consumption to 65 percent during the same period. Similarly,
there has been no significant improvement in soybean production. The country’s dependency on
soybean import increased from 69.7 percent of domestic consumption in 2013 to 88.1 percent in
2019 (Appendix 1).
Several reports also suggest that domestic production failed to meet the rising demand for fruits
and vegetables. The per capita demand for fruits increased by 2.9 percent annually between 2000
and 2015, whereas the per capita demand for vegetables grew by 2.4 percent per year during the
same period (ADB, 2019, p. 35). However, domestic fruit production grew on average by only 2
percent annually, increasing from 18.3 million tons in 2013 to 19.6 million tons in 2018. As a result,
fruit import increased from 0.5 million tons in 2013 to almost 0.7 million tons in 2018. Vegetable
production also experienced a similar trend. While domestic production increased from 11.6 million
tons in 2013 to 12.5 million tons in 2018, imports rose from 0.8 million tons to 0.9 million tons
during the same period (BPS, 2019b, 2019c; Ministry of Agriculture, 2018).
The availability of protein from domestic sources other than beef has experienced an increasing
trend. The availability of fish from Indonesia has increased by around 15 percent during the period
2014–2018, or on average by 3.6 percent per year. Egg production increased by around 2.6 percent
per year between 2015 and 2019, rising from 1.9 million tons to 2.4 million tons. Meanwhile,
between 2013 and 2019, the production of chicken rose on average by 16 percent per year, making
the chicken production increase from 1.5 million tons to 3.5 million tons. Despite this growth in the
availability of fish and the production of eggs and chicken, however, some challenges remain for
the Government to ensure the availability of diversified food. A diversified agricultural production
system is needed to achieve this goal.
2.1.2 Access to Food
Access to food has improved during the past few years. On average, the daily calorie consumption
increased from 2,004 kilocalories (kcal) per capita in 2015 to 2,165 kcal per capita in 2018 (BKP,
2019, p. 25). The Food Security and Vulnerability Atlas 2018 shows that the number of districts
considered “food secure” increased between 2015 and 2018 (BKP, 2018, p. xvi). Nevertheless, more
than 20 million people still face the risk of hunger. According to BPS, the prevalence of insufficient
food consumption, which is defined as “calorie intake below the minimum dietary energy
requirement,” fell from 16.5 percent in 2011 to 7.9 percent in 2018 (BPS, 2018b). The number of
undernourished people dropped from 39.8 million in 2011 to 21 million in 2018. According to the
Global Hunger Index—which captures the multidimensional nature of hunger by combining
undernourishment, child stunting, wasting and mortality—the proportion of people at risk of
hunger in Indonesia declined from 9.1 percent in 2011/2013 to 8.3 percent in 2016/2018,
decreasing from 22.3 million to 21.7 million people (von Grebmer et al., 2019, p. 52; 2014, p. 41).
Poverty and high food prices in relation to income remain the major challenges in the effort to
increase access to food. Despite improvements during the last several years, around 9.8 percent of
The SMERU Research Institute
6the population or 26.4 million people lived under the national poverty line in 20204 (BPS, 2020e).
Poverty is highly correlated with food insecurity. Valesova et al. (2017) observed that it is
smallholder farmers, farmworkers and fishers who constitute the bulk of those who suffer most
from hunger (Valesova et al., 2017, p. 922).
The price of rice in Indonesia is considered high by international standards, despite high amounts
of fertilizer subsidies allocated to rice producers. Since the early 2010s, the domestic price of rice
in Indonesia has been higher than the price in the international market. In 2017, for example, the
average price of medium-quality rice in the international market was around Rp6000 per kilogram
(kg), but the average domestic price was more than Rp10,000 per kg (ADB, 2019, p. 22). The rice
price has a significant impact on poverty and food insecurity because food spending constitutes a
substantial part of the expenditures of poor households, and rice constitutes a substantial part of
overall food expenditures in these households (Patunru & Ilman, 2019, p. 8). While 56 percent of
household expenditures in Indonesia goes toward food, food-insecure households spend as much
as 69 percent of expenditures on food5 (Appendix 2). Lower rice prices would help improve access
to food for the poorest.
Some evidence shows that the outbreak of COVID-19 has already increased the number of poor
people in the country. BPS revealed that as the economy contracted by 1.3 percent during the first
quarter of 2020, the poverty rate increased from 9.2 percent to 9.8 percent between September
2019 and March 2020. Accordingly, the number of poor people increased by 1.6 million people,
rising from 24.8 million to 26.4 million people during the same period (BPS, 2020e). More people
may fall into poverty and would be at risk of becoming food insecure if the pandemic lasts longer
and affects the economy more severely. According to Suryahadi, Izzati and Suryadarma, COVID-19
might increase the number of poor people by around 1.3 million to 19.7 million people depending
on the severity of economic contraction caused by the pandemic (Suryahadi, Izzati & Suryadarma,
2020). Thus, efforts to increase people’s access to food, especially during the pandemic and in its
aftermath, should consider not only the affordability of food prices but also the purchasing power
of the poor and vulnerable groups.
2.1.3 Food Intake
Although the consumption of low-cost carbohydrates is expected to decrease as income increases,
carbohydrates continued to dominate the calorie intakes of most Indonesians despite the continued
increase of per capita GNI during the past decade. Rice consumption remains high in the country. A
decline in rice consumption was observed only in the highest income category but not in others
(Arifin, Achsani, Martianto, Sari, & Firdaus, 2018). The annual average per capita rice consumption
even slightly increased from 96.3 kg in 2013 to 97.1 kg in 2018 (BKP, 2019, p. 5). During the same
period, annual average per capita wheat flour consumption also rose from 10.1 kg to 18.1 kg (BKP,
2019, p. 5). As a result, the intake of rice and other cereals accounted for approximately 65.7 percent
of the total calorie intake of Indonesians in 2018. This is much higher than the reference figure of 50
percent recommended by Indonesia’s desirable dietary pattern (Pola Pangan Harapan, PPH) (BKP,
2019, p. 1), which is already higher than international standards.
Fish and meat consumption also increased during the period 2013–2018. The consumption of fish,
which has been the most important source of protein, increased slightly from 19.5 kg per capita per
4BPS defined poverty line as the amount of money required to obtain a minimum of 2,100 calories (kcal) per capita per
day and other necessary non-food items. Per March 2020, Indonesia’s poverty line was recorded at Rp454,652 per capita
per month (BPS, 2020e).
5A food insecure household is defined as having calorie intakes of less than 80 percent of the national standard (2,150
kcal/capita/day) and spending more than 60 percent of household expenditures on food (Maxwell et al., 2000).
The SMERU Research Institute 7year in 2013 to 20.7 kg per capita in 2018. The increase in meat consumption was higher than in
fish consumption. During 2013–2018, the annual per capita poultry consumption rose from 5.0 kg
to 7.2 kg, and beef consumption from 1.3 kg to 4.5 kg (BKP, 2019, p. 8). Nevertheless, inequality
persists between different income groups. In 2017, protein consumption among the highest income
groups (fifth quintile) reached 84.1 grams per capita per day. Yet among the lowest quintile group,
it was only 45.7 grams per capita per day (Arifin et al., 2018). Meat consumption in Indonesia also
remains lower than in other Southeast Asian countries. The proportion of energy intake from meat
(1.5 percent) is even lower than in countries that have lower GNI per capita like Cambodia (3.2
percent) (Mathijs, 2015, p. 115).
Fruit and vegetable consumption, which is required to maintain healthy and balanced diets, is also
low in Indonesia. According to the World Health Organization (WHO), people are considered to have
enough fruit and vegetable intake if they eat more than five portions of fruits and vegetables per day
(WHO, 2020b). However, the 2018 Riskesdas showed that only 4.6 percent of the population aged 5
years or older consumed enough fruits and vegetables. Most of the respondents (66.5 percent) stated
that they consumed only one to two portions of fruits and vegetables per day (Kementerian
Kesehatan, 2019, p. 311). In 2013, around 93.5 percent of the population aged 5 years or older did
not meet their daily fruit and vegetable consumption standards (Kementerian Kesehatan, 2013, p.
12). This proportion rose even higher to 95.4 percent in 2018 (Kementerian Kesehatan, 2019, p. 313).
There have, however, been major changes in people’s food expenditure patterns. The portion of
expenditure for ready (or prepared) meals increased quite significantly during the past few years
(Sukmana, 2019). BPS (2013, 2019a) shows that the share of expenditure on prepared food rose
from 25.9 percent of total food expenditures in 2013 to 35.9 percent in 2019. This went hand-in-
hand with the declining share of spending on rice and other cereals (from 16.3 to 11 percent),
vegetables (from 8.7 to 7.3 percent), eggs and milk (from 6 to 5.7 percent), fruits (from 4.6 to 4.5
percent), oil and fat (from 3.2 to 2.3 percent), beverage stuffs (from 3.8 to 2.9 percent), legumes
(from 2.6 to 1.9 percent) and tobacco and betel (from 12.3 to 11.7 percent). Only the share of
expenditure on meat and tubers increased during this period. Consistent with the increasing
consumption of beef and poultry, the share of expenditure on meat increased from 3.7 percent in
2013 to 4.7 percent in 2019. Meanwhile, the share of expenditure on tubers slightly increased from
0.9 to 1.1 percent during the same period.
Figure 3 shows that the change in the food expenditure pattern is happening among both urban
and rural households. A study on energy intake of junior high school students in Semarang, Central
Java showed that consumption of fast food, such as fried chicken, was observed not only among
students living in urban areas but also those in rural areas (Dwiningsih, 2013, p. 237). Even though
the proportion of household expenditures spent on prepared foods was higher among urban
households in 2019, the growth of the share of prepared foods consumed was higher among rural
households. During the past six years, the share of expenditures on prepared foods among rural
households rose by 10.88 percentage points, which is higher than the 8.9 percentage point increase
among urban households. The diminishing role of rice in people’s food expenditures, however, does
not necessarily indicate improvement in the dietary diversity of the population, as the consumption
of prepared food increased quite significantly since 2013. Unfortunately, the available statistics do
not reveal the nutritional composition of the prepared food. Yet, from the broader perspective of
food security and nutrition, what this review suggests is that policies or programmes to improve
dietary patterns of the population should reach both urban and rural areas. The Government should
also pay greater attention to food diversity while enhancing people’s access to food.
The SMERU Research Institute
8Figure 3. Changes in Rural and Urban Household Food Expenditures, 2013–2019
Source: BPS (2013, 2019a).
2.1.4 Food Utilization
Proper utilization of food also requires non-food components. To make the best use of a diet,
people will need to have access to clean water and sanitation as well as health care so that they
can achieve “nutritional well-being,” which is defined as a state in which all energy and nutritional
requirements are met (FAO, 2006). While clean water and sanitation are needed to ensure the
safety of the food eaten, access to health care is needed to prevent or address a variety of diseases
that may diminish the nutritional value of the food consumed or affect how that food gets
metabolized. Indonesia’s achievements in this policy domain have been rather mixed.
As shown in Table 1, progress has been made in improving health care services for women of
childbearing age, pregnant and lactating mothers and children. However, despite the
improvements, some challenges remain. The proportion of women who received Vitamin A
supplements in the two months after giving birth was low (52 percent) in 2017. The proportion
might actually be even lower if we consider only those women who actually consumed the vitamin,
rather than all those that received it. The improved figure on the proportion of pregnant women
who received iron tablet supplementation (88 percent according to the 2018 Riskesdas) did not
fully reflect the situation on the ground because compliance with consuming the iron supplement
remained an issue (Utomo, Nurdiati & Padmawati, 2015). According to the MoH’s regulation No.
97/2014, pregnant women should take at least 90 iron tablets during the pregnancy (Kementerian
Kesehatan, 2014). However, the 2018 Riskesdas revealed that 62 percent of pregnant women
consumed fewer than 90 tablets, and only 38 percent of pregnant women consumed 90 tablets or
more during pregnancy (Kementerian Kesehatan, 2019, p. 511). Under certain circumstances, the
consumption of iron tablets among pregnant women can be even lower. A study by Aditianti,
Permanasari and Julianti (2015) in three villages in West Java revealed that 90 percent of
respondents had low compliance with the consumption of iron tablets.
The SMERU Research Institute 9Table 1. Indonesia’s Progress in the Provision of Health Care for
Women and Children
Progress:
Indicator
Percentage (year)
1. Proportion of infants with symptoms of acute respiratory 75% (2012) 90% (2017)
infection (ARI) who were taken to a health facility
2. Proportion of children under 5 who were reported to have 65% (2012) 80% (2017)
diarrhea and were taken to a health facility
3. Proportion of children aged 6–23 months who were given 83% (2007) 86% (2017)
foods rich in vitamin A
4. Proportion of women who received iron tablet/syrup 76% (2012) 86% (2017)
supplementation for their most recent birth
5. Proportion of women who received antenatal care (ANC) from 96% (2012) 98% (2017)
a skilled provider
6. Proportion of women with at least four ANCs from a skilled 74% (2012) 77% (2017)
provider
7. Proportion of women who received vitamin A in the two months 48% (2012) 52% (2017)
after childbirth
Source: BKKBN, BPS, Health, & ICF, 2018.
The improvements of the distribution of food supplements like iron tablets, however, does not
necessarily indicate real improvements in people’s health. More granular data on the consumption
of food supplements or, even better, on micronutrient deficiencies are needed to better assess the
adequacy of micronutrient consumption among pregnant women.
According to the MoH, in 2015, 28 percent of Indonesian children were infected by helminth (a
parasitic worm infection that hampers proper food utilization) which affects children’s nutritional
status and impairs cognitive processes. In 2002–2015 the helminthiasis control programme was
integrated with the filariasis (a parasitic disease transmitted by mosquitoes) control in more than
200 districts and cities. Beginning in 2017, the Government accelerated its efforts by integrating
the distribution of deworming tablets with the biannual distribution of vitamin A to children aged
12 months to 12 years at integrated health posts (Posyandus), kindergartens and primary schools.
Several studies have shown that distributing deworming tablets with vitamin A can have an impact
on improving the health status of preschoolers because worm-free children can have higher
absorption rates of vitamin A and iron.
Basic vaccination for children also needs attention. Although the proportion of children aged 12–
23 months that received (any) vaccinations increased slightly, from 93 percent in 2012 to 94 percent
in 2017, those who received all basic vaccinations decreased slightly from 66 percent to 65 percent
(BKKBN et al., 2018). In summary, there was no deterioration but also no improvement. This
suggests a lack of discipline in carrying out complete immunization. The coverage of basic
vaccinations was unequal across different income categories as well. Among the 20 percent
highest-income group, around 64 percent of children aged 12–23 months received all basic
vaccinations. In contrast, only around 49 percent of children of the same age group from the 20
percent lowest-income group received all basic vaccinations.
There is some evidence that since the start of the COVID-19 outbreak the provision of vaccination
as well as of maternal and child health services has declined, especially in areas where the number
of COVID-19 cases is high (see Chapter 4). According to the MoH, the coverage of basic
The SMERU Research Institute
10You can also read


