Student voters: Did they make a difference? - Nick Hillman - HEPI Report 133 - Higher ...
←
→
Page content transcription
If your browser does not render page correctly, please read the page content below

Student voters:
Did they make a difference?
        Nick Hillman

             HEPI Report 133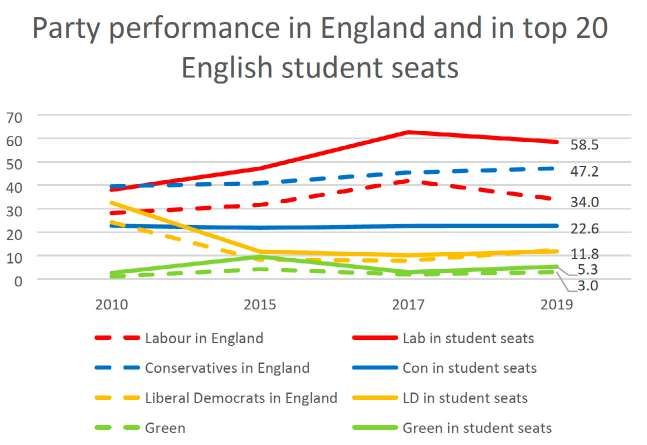
About the author
Nick Hillman has been the Director of HEPI since January
2014. Given the topic of this paper, he declares an interest as
the Conservative candidate in Cambridge at the 2010 general
election.
Executive Summary
• The run up to the 2019 general election saw huge debate
  on the likely importance of the student vote to the result.
  This paper takes the 25 parliamentary constituencies in
  the UK with the highest proportion of students – where
  students make up more than 17.5% of the population – to
  try and assess what role students played in 2019 and the
  previous three general elections in 2010, 2015 and 2017.
• It is easy to exaggerate the importance of the student
  vote because of the conditions that must be in place
  for students to alter the outcome in any constituency.
  However, students have proved decisive in some places –
  for example, students helped Labour win both Canterbury
  and Leeds North West in 2017 and hold them in 2019, and
  students are also likely to have helped Labour hold the
  marginal seat of Coventry South in 2019.
• In England, Labour do much better in constituencies with
  lots of students than they do overall and the Conservatives
  do considerably worse. In both instances, the gap has been
  growing at every recent election. In 2019, Labour’s share
  of the vote was 25 percentage points higher in English
  student seats than in England as a whole (compared to 11
  percentage points in 2010) while the Conservatives’ vote
  share was 25 percentage points lower in student seats than
  in England as a whole (compared to 17% in 2010).
• In Wales, Labour also do better in student seats while the
  Conservatives do worse: Labour’s additional vote share in
  the two Welsh student seats included in the study was 16
  percentage points in 2019, while the Conservatives won 12
  percentage points less in Welsh student seats than in Wales
  as a whole.

www.hepi.ac.uk                                             3
• In Scotland, Labour did worse overall than the
  Conservatives in 2017 and 2019 but they continued
  to beat the Conservatives by a considerable margin in
  student seats. However, the Scottish National Party’s
  overall dominance in Scotland means the SNP are the main
  beneficiaries of recent electoral trends and they have won
  decisive victories in student seats at the last three elections.
• The Liberal Democrats were relatively successful in winning
  the votes of students in 2010. In student seats, they
  outperformed their results in England as a whole, winning
  five of the 20 student seats in England and one of the two
  in Wales (but none of the three in Scotland). However, the
  Liberal Democrat vote share fell heavily afterwards. In 2019,
  they performed slightly worse in English student seats than
  in England as a whole.
• In many seats with the most students, Labour’s majority is
  very large – for example, it is over 70%, or over 37,000 votes,
  in Liverpool Riverside. So students may often increase
  the winning candidate’s majority rather than change the
  result. Depending on individual circumstances, they may
  sometimes have had more impact had they opted to vote
  in their home constituencies rather than their term-time
  one.
• Of the 100 election results in the 25 student seats across the
  whole UK between 2010 and 2019, Labour’s tally is 78 wins,
  compared to nine for the Liberal Democrats and just four
  for the Conservatives. In addition, the SNP won nine times
  (out of a possible maximum of 12 in the four Scottish seats
  covered in the study).
• Minor parties have tended to perform poorly in student
  seats at recent elections, with no smaller party winning
  any student seats in the last four general elections. The
4                                    Student voters: Did they make a difference?
perception that the Green Party does particularly well
   among students is not supported by recent general
   election results, although this may – in part – reflect tactical
   voting under the first-past-the-post electoral system. On
   the other hand, the perception that UKIP and the Brexit
   Party have earned little support from students is supported
   by the data, and Plaid Cymru have tended to do worse in
   Welsh student seats than other Welsh seats.
• There may not be another general election until 2024 and
  all the main parties could change their attitudes towards
  student issues between now and then. Yet students do not
  only care about student issues; they also care about areas
  affecting the whole of society, like climate change, the NHS
  and the UK’s relations with the rest of the world, including
  Brexit.
• While the electoral importance of student issues is
  sometimes exaggerated, the student vote still cannot be
  taken for granted and will continue to make a difference
  in some key seats. Indeed, if higher education continues
  on its long-term trajectory of welcoming more full-time
  students, the concept of an identifiable student vote could
  conceivably grow.
• There are well-publicised claims that the process of
  attending university can alter students’ political viewpoints,
  in particular by pushing them to the left of the political
  spectrum. Yet while most UK students (and higher
  education staff ) do seem to gravitate towards left-of-centre
  parties, there is also evidence to suggest attending higher
  education may determine people’s political outlook less
  than is often supposed.

www.hepi.ac.uk                                                   5
6 Student voters: Did they make a difference?
Contents
Introduction                      9

Methodology                      13

Analysis by country              15

Analysis by party                21

Conclusions                      31

Endnotes                         37

www.hepi.ac.uk                    7
8 Student voters: Did they make a difference?
Introduction
Prior to the 2019 general election, gallons of ink were
consumed on articles about whether students would vote,
where they would vote, how they would vote and whether
they could make a difference to the result. Similarly, in
the aftermath of the 2017 general election, there was a
lively debate over whether or not the unexpectedly close
result between the Conservatives and Labour was due to a
‘youthquake’.1
HEPI’s previous research on student voters concluded that
they are a material factor in election results but also that,
for students to make a difference to the result in any single
constituency, many conditions need to be fulfilled.2
At a minimum, students must:
i. register to vote in the constituency they will be in on
   election day (yet Individual Electoral Registration has
   arguably made this more difficult for some students);
ii. actually vote when election day comes around (yet, in
    general, student seats tend to have below average turnout);
iii. vote as a meaningful bloc (or else risk cancelling each other
     out);
iv. vote in a different pattern to how the constituency in
    question would vote if students were not present (or else
    they will not change the different proportions won by each
    candidate);
v. be present in sufficient numbers within a single
   constituency to make a difference to the result (or else they
   will make the seat more marginal but not actually affect
   who wins).

www.hepi.ac.uk                                                  9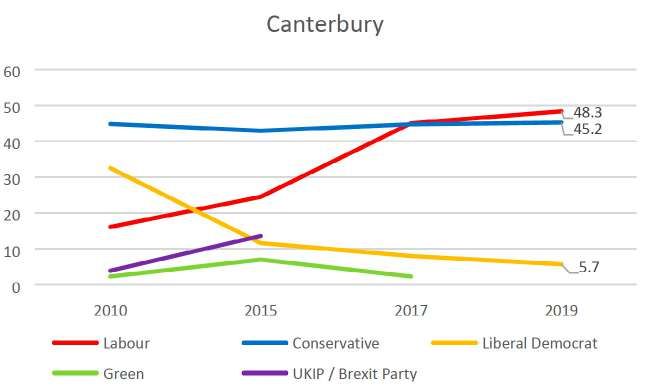
So there is a relatively high bar for students to make a
difference in a single constituency let alone in the country as
a whole.
The fact that students typically have a choice of two
constituencies in which to vote – their term-time address
and their home address – complicates any assessment of
their importance as a group of voters. Providing them with
such a choice over where to vote theoretically enables them
to amplify their voice, as they can opt to vote in the more
marginal of the two seats. However, a student who lives in a
marginal seat in the holidays but who votes in a safer seat at
a term-time election will have less, rather than more, impact.3
There are 1.4 million full-time UK-domiciled students (plus 0.5
million part-time ones) spread across all UK constituencies
but, for the reasons above, the number of constituencies in
which student voters typically make a noticeable difference is
limited. As a result, students are more likely to be decisive at
a national level if the overall result is close than if one party
wins a clear majority. This might suggest students were more
influential in the 2010 and 2017 elections, when no one party
secured an overall majority in the House of Commons, than in
2015 or 2019.
Another important factor is that, because students typically
enrol in three-year courses at undergraduate level and one-
year courses at postgraduate level, student voters are generally
different people from one election to another. It is incorrect
to think of student voters as a block that sometimes changes
direction. For example, while student voters may have drifted
away from the Liberal Democrats between 2010 and 2015,
the students voting at these two elections were generally
different people rather than the same individuals with shifting
allegiances. Even in the ‘early’ election of December 2019,
most students were not part of the student electorate at the
10                                   Student voters: Did they make a difference?
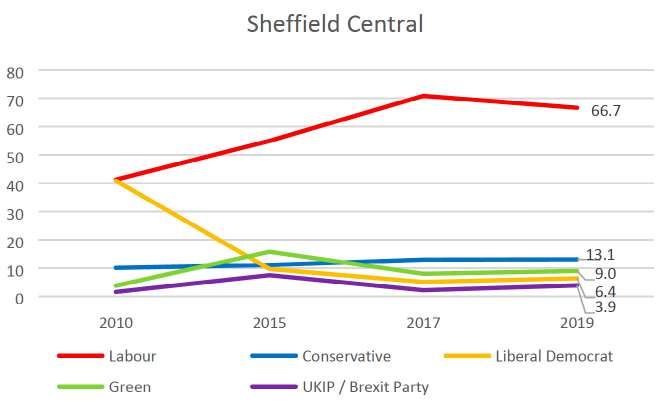
previous election held in June 2017 (and many would have
been too young to vote at all).
This short report looks more deeply into the question of
whether student voters make a difference to election results
by:
• taking the 25 constituencies with the highest proportion of
  full-time students – those where they are thought to make
  up more than 17.5% of the electorate;
• considering the results in these seats for the last four
  general elections, in 2010, 2015, 2017 and 2019; and
• comparing the results in these seats to the bigger picture.
The 25 parliamentary constituencies with the highest
proportion of full-time students make up nearly 4% of all 650
constituencies in the UK. They are split between England (20
of the 533 seats or 4%), Scotland (three out of the 59 seats or
5%) and Wales (two out of the 40 seats or 5%). As shown in
the Appendix, the constituency in England with the highest
proportion of students is Sheffield Central, where 34.8% of
the population are full-time students; in Wales, it is Cardiff
Central, where 30.1% of people are full-time students; and in
Scotland, it is Glasgow Central, where 22.5% people are full-
time students.
While we caution against reading too much into our
conclusions, given the limited nature of the research, there are
enough points of interest to make such a study worthwhile.
Moreover, although the 25 constituencies in this study make
up only around one-in-20 of all the seats in the UK, Theresa
May needed to win just eight more seats than she did at the
2017 election to gain an overall majority and David Cameron
needed just another 20 to win an overall majority at the 2010
election. So what happens in these 25 seats matters and can
www.hepi.ac.uk                                               11
materially affect both the make up of the House of Commons
and a party’s grip on power.
A number of caveats to our conclusions are discussed in the
Methodology section. One especially important caveat is
that trends in these seats cannot be entirely ascribed to the
presence of students. Student seats, as we will see, tend to vote
Labour in much greater proportions than average, but this
may be down to other factors (demographic and geographic)
as well as the presence of large numbers of students.
The significance or otherwise of the student vote is obviously
key to understanding election results and, because of this, it
is also important in understanding policy. For example, it is
widely thought that the Conservatives in 2001 and 2005, the
Liberal Democrats in 1997, 2001, 2005 and 2010 and Labour
in 2017 and 2019 opposed tuition fees in part because of the
perceived – though possibly exaggerated – electoral benefits.
Sir Keir Starmer, the Labour leader since 2020, may be
particularly aware of the electoral relevance of students
because his constituency of Holborn and St Pancras has a
higher proportion of students than 625 of the rest of the seats
in the UK, and therefore just slips into our list of seats under
review. Boris Johnson may also have a greater understanding
of the student vote than other recent Conservative Prime
Ministers because, unlike David Cameron and Theresa May, his
constituency (Uxbridge) hosts a university (Brunel), where the
Vice-Chancellor is also the serving President of Universities UK,
and he is also a former Shadow Minister for Higher Education
as well as a former Mayor of London, where participation in
higher education is particularly high.
12                                   Student voters: Did they make a difference?
Methodology
We use the 2011 Census to discern the number of students
‘usually resident’ in each parliamentary constituency.4 This is
the best and standard source for work on student voters at a
constituency level.5 But it is very far from perfect. In particular,
the information:
• is a snapshot from the Census Day almost a decade ago (27
  March 2011);
• relates to full-time students only;
• includes both UK voters and international students;
• includes students undertaking qualifications at any level of
  education; and
• is limited to those aged between 18 and 74.6
Other points about the research to note include:
• no seats in Northern Ireland fit our criteria of students
  making up over 17.5% of the population, but Northern
  Ireland results are included in any quoted UK figures;
• the election results were taken from Wikipedia in early
  September 2020 – a spreadsheet with all the results in one
  place is available at www.hepi.ac.uk;
• term dates differ at higher education institutions, meaning
  a different proportion of students may be in residence on
  the same election day;
• while the assessment focuses on party totals, general
  elections are about electing individuals as MPs and some
  candidates may have particularly strong (or weak) personal
  votes;
www.hepi.ac.uk                                                   13
• the research ignores the by-election that was held in one of
  the 25 seats (Manchester Central in 2012);
• there have been no boundary changes since the current
  boundaries were first used in 2010 so the 25 constituencies
  are, in terms of their geographical boundaries, directly
  comparable between elections;
• UKIP and the Brexit Party are treated together, even though
  they are separate entities – however, in only one contest
  in this study (Holborn and St Pancras in 2019) did the two
  parties stand against each other;
• some seats in the study witnessed electoral pacts between
  different parties – the Liberal Democrats did not contest
  Bristol West in 2019 (despite holding it with a big majority
  back in 2010), the Green Party did not contest Bath or
  Cardiff Central in 2019 and Plaid Cymru also stood aside in
  Cardiff Central;
• independent and fringe candidates are ignored, even when
  they were relatively high profile (such as the former MPs
  Mike Hancock, who stood as an Independent in Portsmouth
  South in 2015, and George Galloway, who stood as an
  Independent in Manchester Central in 2017); and
• candidates who stood on a joint Labour Party and
  Co-operative Party ticket are treated the same as other
  Labour MPs.
Election outcomes reflect numerous factors and the results
in the 25 constituencies in this study may reflect the voting
behaviour of other voters, including higher education staff
and recent graduates, as well as students. However, polling
by YouthSight before the 2019 election suggests full-time
students were over three times more likely to vote Labour
(53%) than Liberal Democrat (16%) or Conservative (15%).
14                                 Student voters: Did they make a difference?
Analysis by country
England
The chart below compares the performance of the three main
political parties in England overall with their performance in
the 20 English constituencies with the highest proportion of
students. Overall, it shows that – in 2019 – Labour secured
around 25 percentage points more of the vote share in
student seats in England than they did in England as a whole
(58.5% versus 34.0%), while the Conservatives secured around
25 percentage points less in student seats than they did in
England as a whole (22.6% versus 47.2%).

The chart also shows that Labour has consistently performed
much better in student seats than in England as a whole and
the gap between their performance overall and in student
seats has grown at every recent election, rising from 9.9
www.hepi.ac.uk                                             15
percentage points in 2010, to 15.5 percentage points in 2015,
20.7 percentage points in 2017 and 24.5 percentage points in
2019.
Meanwhile, the Conservatives have performed consistently
worse in student seats than they have in England as a whole.
While their vote share in England has risen since by 7.7
percentage points 2010 (from 39.5% to 47.2%), their vote
share in the most student-heavy seats has flatlined during
the whole period (hovering between 21.8% and 22.7%). The
gap between Conservative performance in student seats and
England overall has grown from 16.8 percentage points in
2010, to 19.1 percentage points in 2015, to 22.8 percentage
points in 2017 and 24.6 percentage points in 2019.
In these seats, the main action often seems to have swirled
around the Conservative Party rather than directly involved
them. For example, between 2010 and 2019, Leeds North
West went from being a seemingly safe Liberal Democrat seat
to a seemingly safe Labour seat; the Conservatives started
in second place in 2010 with 26.6% of the vote and ended in
second place in 2019 with 26.8% of the vote. They managed to
capture Portsmouth South and Bath in 2015 thanks primarily
to a big drop in Liberal Democrat support but lost these seats
to the Labour Party and the Liberal Democrats respectively
just two years later.
Although the Liberal Democrats in England did noticeably
better in student seats than in England as a whole in 2010,
the gap shrunk afterwards – they only performed marginally
better in student seats than in England overall in 2015 and
2017 and actually did slightly worse in these seats (with a vote
share of 11.8%) than in the whole of England (12.4%) in 2019.

16                                  Student voters: Did they make a difference?
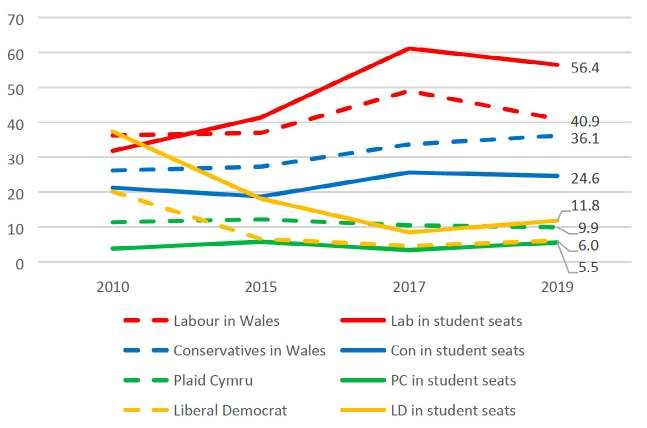
Wales
Although the Labour Party has won more votes than the
Conservative Party in Wales at all recent general elections
(unlike in England), the electoral pattern in Wales still has
some things in common with the pattern in England (based
on our small sample of just two seats). For example, Labour
has tended to do considerably better in student areas than it
has done in Wales as a whole, whereas the opposite has been
true for the Conservatives.

Meanwhile, the Liberal Democrats have tended to do better in
student areas than in Wales as a whole and Plaid Cymru have
done worse. Together, this suggests that the recent reforms
to student finance implemented by the Welsh Government,
www.hepi.ac.uk                                            17
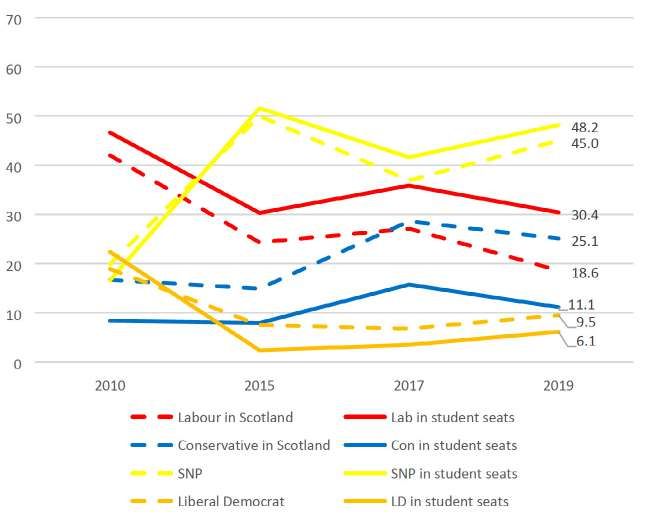
which is a Labour administration with a Liberal Democrat
Minister for Education, may not have adversely affected
their electoral performance in the way that the 2010 to 2012
reforms affected Liberal Democrat support in England.
Scotland
Labour held all three Scottish student seats in 2010 but have
lost considerable support since. They did worse overall in
Scotland than the Conservatives in 2017 and 2019, although
they continued to beat the Conservatives easily in student
seats. In Scotland as a whole, they were 6.5 percentage points
behind the Conservatives (18.6% versus 25.1%); in student
seats, they were 19.3 percentage points ahead (30.4% versus
11.1%). So the pattern in England and Wales of Labour
doing better in student areas and the Conservatives worse is
repeated in Scotland, although the gap between the UK’s two
biggest parties’ performances in Scottish student seats has
actually been reducing (from 38.2 percentage points in 2010,
to 22.4 percentage points in 2015, 20.2 percentage points in
2017 and 19.3 percentage points in 2019).
Yet it is the SNP that has been the most popular party in the
three Scottish student seats in this study at each of the last
three general elections. In general terms, the SNP vote share
in student seats has broadly tracked their overall popularity,
although in 2015, 2017 and 2019 they did a little better in the
three student seats than overall.
However, in terms of the share of the vote, the top-performing
party, the SNP, does not do as well in Scottish student seats as
the top-performing party, Labour, does in English and Welsh
student seats. In the three Scottish student seats in 2019,
the SNP’s vote share was 48.2% but in student seats across
England and Wales, on average Labour had a majority of votes
(58.5% and 56.4% respectively).
18                                  Student voters: Did they make a difference?
www.hepi.ac.uk 19
20 Student voters: Did they make a difference?
Analysis by party
Labour
All but one of the 20 seats in England with the highest
proportion of students were won by Labour at the 2019
election, with the Liberal Democrats winning Bath, which is
also the only student seat anywhere in the UK where Labour
were not in the top two parties in 2017 and 2019.7 Labour
were also victorious in the two student seats in Wales with the
highest proportion of full-time students, while the three seats
in Scotland were all won by the SNP, with Labour in second
place.
Of the potential maximum 100 election victories in the 25
student seats across the UK between 2010 and 2019, Labour
have won 78 times.

The Labour share of the vote grew by 5.9 percentage points,
from 28.1% to 34.0% between 2010 and 2019 in England as a
whole but, within our 20 student seats in England, it grew over
three times as fast, by 20.5 percentage points, from 38.0% to
58.5%. Labour’s improved performance after 2010 was not a
www.hepi.ac.uk                                              21
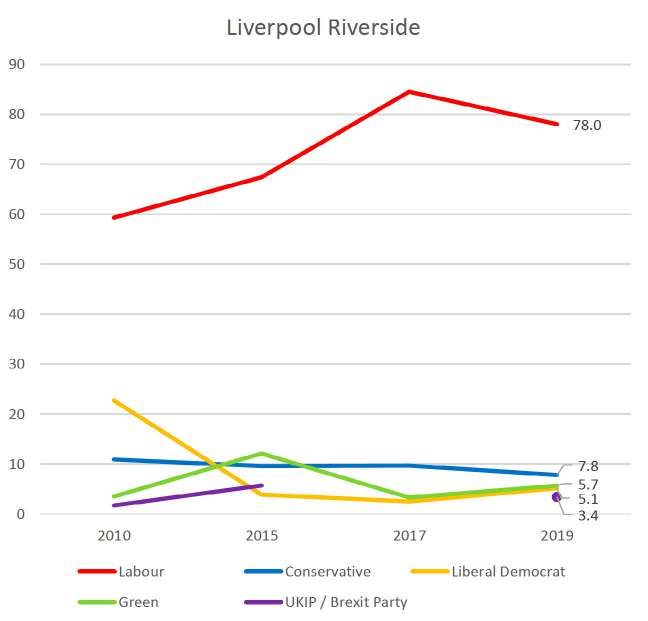
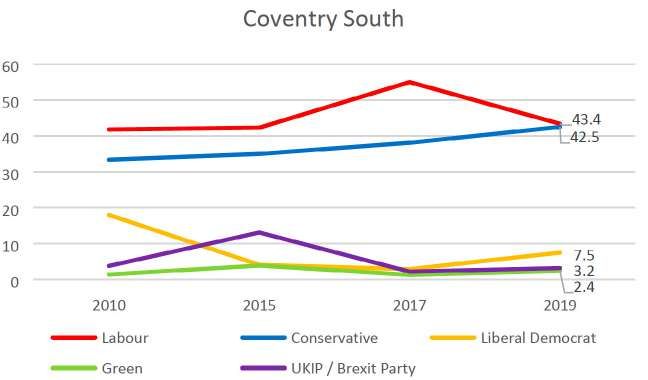
single gradual trend. In English student seats, the Labour share
of the vote grew particularly fast between 2015 and 2017, from
47.1% to 62.6% (possibly as a result of a higher turnout among
full-time students), before falling back somewhat afterwards.
These trends are evident in the results in Sheffield Central,
which has a higher proportion of students than any other UK
constituency.

In other words, in student-heavy seats, Jeremy Corbyn did
better in his first general election as leader in 2017 than in
his second in 2019, but even in 2019 he did better than Ed
Miliband in 2015, who in turn did better than Gordon Brown
in 2010. Even in 2019, however, Labour enjoyed an average
majority of 36.9% in the 21 out of the 25 UK student seats they
won in 2019 (ranging from 0.9% in Coventry South to 70.2%
and 37,043 votes in Liverpool Riverside, as shown below).

22                                  Student voters: Did they make a difference?
This pattern of Labour votes in student seats – rising in 2015
and 2017 but falling back somewhat in 2019 – replicates the
pattern in Labour Party’s overall share of the vote in England.
However, HEPI’s analysis just after the 2019 general election
confirmed constituencies with a higher proportion of students
had a lower Labour-to-Conservative swing than the UK-wide
4.6% pro-Conservative swing.8
Research by the House of Commons Library comparing 77
seats with a high number of students to the picture for Great
Britain as a whole similarly confirms the Labour vote share fell
less in student seats than overall.9
www.hepi.ac.uk                                               23
Conservatives
The Conservatives came second in 18 of the 20 English
seats in 2019 but were third in Cambridge and Bristol West.
Back in 2010, they were the runner up in seven of these
seats (including Cambridge), although they also held one
(Canterbury).

In the two student seats in Wales, the Conservatives came
second in 2019, whereas they had been third in both back in
2010, as shown in the Cardiff Central results below, but they
remained some distance behind the Labour Party.
In Scotland, the Conservatives came fourth in all three of the
student seats in 2010 but were third in all three student seats
in 2015, 2017 and 2019.
So, relative to the other major political parties, Conservatives
might be said to have done somewhat better in student seats
after 2010.

24                                  Student voters: Did they make a difference?
Yet, although the Conservatives could be said to have
performed somewhat better relative to other parties over time
in student seats, in overall terms there have not been dramatic
changes in the Conservatives’ share of the vote in student
seats since 2010.
There have been changes in individual seats, however. In half
the student seats in England, the Conservative share of the
vote declined between 2010 and 2019 (by as much as 10.1
percentage points in Cambridge) and in the other half it went
up.
Only in two seats did the Conservative share of the vote
grow by more than the average over England as a whole (9.1
percentage points in Coventry South and 8.4 percentage
points in Newcastle upon Tyne East). Even though the
Conservatives failed to win Canterbury back in 2019, their vote
share in the constituency (45.2%) was actually higher than it
had been when they won the seat in 2010 (44.8%) and 2015
(42.9%).

www.hepi.ac.uk                                              25
Overall, of the potential maximum 100 election victories in the
25 student seats across the UK between 2010 and 2019, the
Conservatives have won just four times – twice in Canterbury,
once in Portsmouth South (which is the only one of the 25
seats in the study to have been represented by three different
parties between 2010 and 2019) and once in Bath. Since losing
these three seats in 2017, the Conservatives have not won a
single one of the 25 student seats in the UK.
Liberal Democrats
In some ways, the most dramatic trend in the data for the 20
English seats with the greatest proportion of students is the
decline of the Liberal Democrats, albeit with a slight recovery
in 2019. In 2010, their average vote share in these seats was
32.5%; in 2015, it was 11.7%; in 2017, it fell to 10.1%; and in
2019, it grew slightly to 11.8% (but fell below their overall vote
share in England).
In 2010, the Liberal Democrats had won five out of the 20
English student seats; in each of the three elections since, they
have won just one.
26                                   Student voters: Did they make a difference?
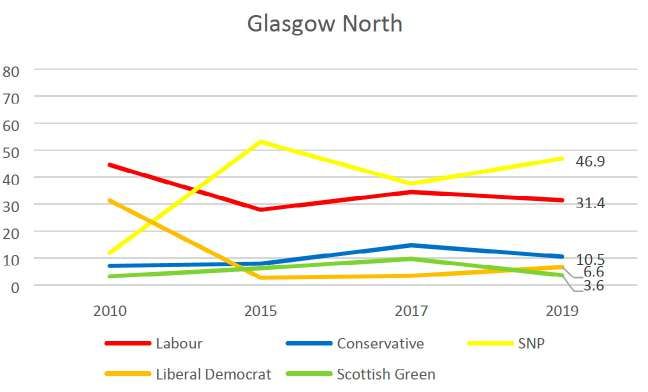
A squeeze of the Liberal Democrat vote is also evident in the
two Welsh seats and three Scottish seats. In Cardiff Central,
they went from winning the seat in 2010 to third place by
2017 and in Swansea West, they went from a close second
place in 2010 to fourth place by 2017, although in both seats
their vote recovered slightly in 2019. In Glasgow Central, the
Liberal Democrat vote share in 2015 (1.6%) was just 10% of
the figure in 2010 (16.4%) and it was still only 4.9% in 2019; in
Glasgow North, they were a good second in 2010 but a poor
fifth in 2015 and 2017, as shown below.

Of the potential maximum 100 election victories in the 25
student seats across the UK between 2010 and 2019, the
Liberal Democrats have won nine times but two-thirds of
these victories were in the single election of 2010.
Given polling in late 2019 suggested an overwhelming
majority of students wanted the UK to remain in the European
Union and that Brexit could affect how a majority of students
would vote in a general election, the Liberal Democrats might
www.hepi.ac.uk                                                27
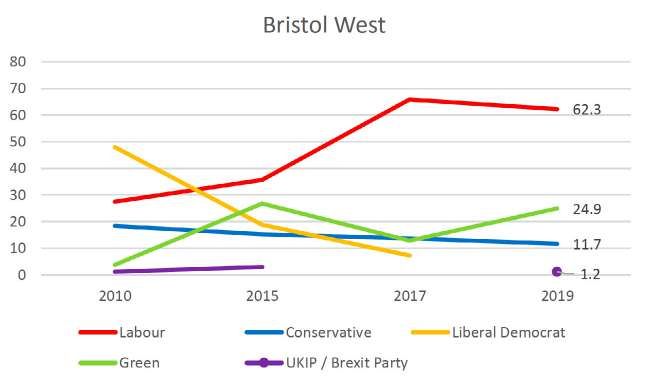
reasonably have expected to fare better than they did in
student seats.10 However, their membership of the Coalition
Government of 2010 and 2015, including their role in raising
tuition fees, was a factor in the campaign.11
Minor parties
It is often claimed the Green Party enjoy considerable support
among students and higher education staff. They have tended
to do somewhat better in student seats than other seats. But
in the 20 English seats with the most students, they have
generally come nowhere near winning and have typically
come fourth or fifth – although they did notably better in
English student seats in 2015 (with 9.5% of the vote) than in
the other three elections. Their performance in the two Welsh
seats and the three Scottish seats was similarly poor.

One obvious exception to the general poor performance of
the Green Party is Bristol West constituency, where they came
second in 2015, a close third in 2017 and second again in 2019
– although on the final occasion the Liberal Democrats agreed
28                                 Student voters: Did they make a difference?
not to contest the seat as part of an electoral pact. The Greens
also came second in Sheffield Central and Manchester Gorton
in 2015, but were nowhere near winning with just 15.8% and
9.8% of the vote respectively, and they may have been decisive
in the Liberal Democrats losing Bath between 2015 and 2017.

Overall, the Green Party’s candidates in these 20 English seats
have not done noticeably better than those of UKIP / the Brexit
Party, who struggled to win support among students. The
Green Party has also fared poorly in student seats in Wales and
Scotland, not once appearing in the top three in any of the five
seats included in this study between 2010 and 2019 (and they
came seventh in Swansea West in 2010).12
If it is true that the Green Party enjoys considerable support
among students, then it is possible that their vote share has
been squeezed at general elections as a result of the first-
past-the-post electoral system encouraging students to vote
tactically when helping to choose a future government.

www.hepi.ac.uk                                               29
30 Student voters: Did they make a difference?
Conclusions
Recent cohorts of students have shown a strong preference
for Labour.13 At recent elections, Labour have stacked up votes
in many of the seats in which students are most concentrated.
After the 2017 election, it was claimed that Labour had lost
the election for want of just another couple of thousand votes
in the most marginal seats.14 Yet in many student-heavy seats,
Labour have recently stacked up majorities of well over 20,000.
When Boris Johnson fixed the last election to take place on
12 December 2019, it was widely claimed that university
term dates would mean many students would not vote at
their place of study and that this would unfairly benefit the
Conservatives. The New Statesman described ‘a particularly
ineradicable meme that the reason why the election date
matters is because it will change whether the election falls in
term time’.15
In fact, many universities had not finished by the day of the
election and, in some respects, it might have favoured the
Labour Opposition more if they had. In the most student-heavy
seats, student votes seem merely to have increased Labour’s
majorities. Three of the top 10 safest seats in the UK are also in
our list of 25 seats with the highest proportion of students: in
Liverpool Riverside in 2019, Labour scored 70.1% of the vote,
in Manchester Gorton, they scored 68.1% and in Birmingham
Ladywood, they scored 67.9%. (However, it is important to
remember that some students have just one place of residence
– 5,000 full-time undergraduates at the University of Glasgow,
for example, live in the parental home during term.)
There are other seats, however, where students may well
have been decisive in taking and then holding the seat for
Labour in 2017 and 2019 – for example, Canterbury, which
had previously had Conservative representation for almost
www.hepi.ac.uk                                                 31
two centuries, and Leeds North West, which had been Liberal
Democrat since 2005. In Coventry South, which Labour has
represented since 1964 but where Labour’s margin of victory
over the Conservatives was squeezed to just 401 votes in 2019
(making it the 12th most marginal seat in the UK), students are
likely to have helped ensure the seat did not in fact change
hands.
After the 2019 election, the defeated Conservative candidate
in Canterbury ascribed her loss to students’ voting behaviour
and called for the rules to be overturned so that students
would only be able to vote ‘at their permanent home and
not at their university address.’16 However, Dr Dean Machin
of Portsmouth University criticised this idea for its ‘appalling
cynicism’.17
Despite the huge majorities that Labour has accrued in seats
with a high concentration of students, the support of students
cannot be taken for granted. There were periods in the 2000s
when Labour polled third among students and, within living
memory, all three major UK-wide parties have led polling
among students.18 Students themselves change, as people
graduate and new students enrol, and the preferences of the
student body change over time. This will be a consideration
as all three major political parties continue to reassess their
policies on higher education and young people.
There may not be another general election until 2024 and all
three main parties could change their attitudes towards so-
called ‘student issues’ between now and then. We are waiting
for a response to the Augar report, produced originally for
Theresa May’s Government, and both Labour and the Liberal
Democrats have recently elected new leaders who are likely
to review many of their policies. Meanwhile, given the funding
problems faced by universities, there may conceivably be
greater pressures on the no-fees policy in Scotland.19
32                                  Student voters: Did they make a difference?
As this policy review process continues, democratic politicians
chasing votes will recall that, while students obviously care
deeply about issues like student finance, they also care about
bigger issues that affect the whole of society, like climate
change, the NHS and the state of the labour market, as well
as the UK’s relationships with the rest of the world, including
the European Union.20 Moreover, the salience of student issues
to the electorate as a whole has probably been exaggerated:
at five of the last six general elections (2001, 2005, 2015, 2017
and 2019), the party promising to abolish or reduce tuition
fees has lost (Conservatives in 2001 and 2005 and Labour in
2015, 2017 and 2019) and the party more committed to fees
has won.21
It seems likely that, while the electoral importance of student
issues is sometimes exaggerated, the student vote still cannot
be taken for granted and will continue to make a difference
in some key seats. Indeed, if higher education continues
on its long-term trajectory of welcoming more full-time
students, undergraduate and postgraduate, the concept of an
identifiable student vote could conceivably grow further.
Finally, there are well-publicised concerns that the process of
attending university can alter students’ political viewpoints,
in particular by pushing them to the left of the political
spectrum.22 This claim is sometimes regarded as one cause of
scepticism about continued growth of higher education on
the right of the political spectrum. Yet while most UK students
and higher education staff do seem to gravitate towards
left-of-centre parties when deciding how to vote, academic
evidence suggests attending higher education may determine
your future political outlook less than is often supposed.23

www.hepi.ac.uk                                                33
Annex: Election results in student seats
England
     Constituency                        2010       2015          2017           2019

                         Students (%)
                                        winning    winning       winning        winning
                                        vote (%)   vote (%)      vote (%)       vote (%)

Sheffield Central        34.8               41.3         55.0           70.9           66.7
Nottingham South         29.9               37.3         47.6           62.4           55.2
Newcastle upon Tyne      27.6               45.0         49.4           67.6           60.1
East
Liverpool, Riverside     27.6               59.3         67.4           84.5           78.0
Manchester Central       26.0               52.7         61.3           77.4           70.4
Leeds North West         24.2               47.5         36.8           44.1           48.6
Oxford East              24.0               42.5         50.0           65.2           57.0
Cambridge                23.6               39.1         36.0           51.9           48.0
Manchester, Gorton       22.5               50.1         67.1           76.3           77.6
Leeds Central            21.6               49.3         55.0           70.2           61.7
Bristol West             21.6               48.0         35.7           65.9           62.3
Portsmouth South         20.5               45.9         34.8           41.0           48.6
Leicester South          20.4               45.6         59.8           73.6           67.0
Coventry South           19.8               41.8         42.3           55.0           43.4
Birmingham,              19.4               55.7         73.6           82.7           79.2
Ladywood
Canterbury               19.0               44.8         42.9           45.0           48.3
Bath                     18.0               56.6         37.8           47.3           54.5
Nottingham East          17.9               45.4         54.6           71.5           64.3
Birmingham, Selly Oak    17.8               38.5         47.7           62.9           56.0
Holborn and St Pancras   17.6               46.1         52.9           70.1           64.5

34                                                 Student voters: Did they make a difference?
Wales
Constituency 2010 2015 2017 2019
Students (%)
Winning winning winning winning
vote (%) vote (%) vote (%) vote (%)
Cardiff Central 30.1 41.4 40.0 62.4 61.2
Swansea West 20.1 34.7 42.6 59.8 51.6
Scotland
Constituency 2010 2015 2017 2019
Students (%)
winning winning winning winning
vote (%) vote (%) vote (%) vote (%)
Glasgow Central 22.5 52.0 52.5 44.7 49.2
Glasgow North 22.0 44.5 53.1 37.6 46.9
Edinburgh East 19.9 43.4 49.2 42.5 48.4
www.hepi.ac.uk 3536 Student voters: Did they make a difference?
Endnotes
1 See, for example, ‘The Youthquake Debate’ in James Sloam and Matt
Henn, Youthquake 2017: The Rise of Young Cosmopolitans in Britain (2019),
pp.108-110

2 https://www.hepi.ac.uk/wp-content/uploads/2014/12/Do-
students-swing-elections.pdf; https://www.hepi.ac.uk/wp-content/
uploads/2015/10/Students-and-the-2015-general-election.pdf

3 For example, given students are more likely to vote Labour and that
constituencies with the most students tend to be represented by Labour,
there will have been instances where students have increased a Labour
MP’s majority by voting at their term-time address while missing out on
the chance to have their voice heard more clearly by voting in a marginal
seat at their vacation address.

4 https://www.nomisweb.co.uk/census/2011/ks501uk

5 It is the source, for example, of lists like that provided in Iain Dale, Greg
Callis, Daniel Hamilton and Robert Waller (eds), The Politicos Guide to the
2015 General Election (2014), p.234

6 https://www.hepi.ac.uk/wp-content/uploads/2018/01/Economic-
benefits-of-international-students-by-constituency-Final-11-01-2018.pdf

7 The Green Party did not stand in Bath in 2019 as part of an electoral
pact, though given their modest support in the constituency in 2017 and
the hefty size of the Liberal Democrat majority, this is unlikely to have
made much difference to the outcome.

8 https://www.hepi.ac.uk/2019/12/18/so-did-students-have-any-impact-
on-the-election/

9 https://commonslibrary.parliament.uk/parliament-and-elections/
elections-elections/general-election-2019-voting-patterns-in-student-
seats/

10 https://www.hepi.ac.uk/2019/11/07/will-students-vote-tactically-over-
brexit-what-does-the-latest-polling-tell-us/
www.hepi.ac.uk                                                                37
11 See, for example, https://www.independent.co.uk/voices/
general-election-liberal-democrats-betrayed-students-tuition-fees-
labour-a9238786.html

12 The Green Party did not stand a candidate in Edinburgh East in 2017. In
Cardiff Central in 2019, they were part of an electoral pact that also meant
they did not put up a candidate.

13 https://www.youthsight.com/blog/pre-election-student-vote

14 https://www.businessinsider.com/how-jeremy-corbyn-might-become-
prime-minister-2017-11?r=US&IR=T; https://www.independent.co.uk/
news/uk/politics/corbyn-election-results-votes-away-prime-minister-
theresa-may-hung-parliament-a7782581.html

15 https://www.newstatesman.com/politics/education/2019/10/no-
election-date-wont-mean-students-cant-vote

16 https://www.conservativehome.com/platform/2020/01/anna-firth-we-
won-the-election-but-lost-the-university-seats-we-must-not-lose-these-
voters-for-a-generation.html

17 https://www.hepi.ac.uk/2020/02/05/disenfranchising-the-student-
vote-and-other-absurd-ideas/

18 https://www.youthsight.com/blog/the-student-vote-october-2019

19 https://www.thescottishsun.co.uk/news/5735399/scotland-university-
students-pay-tuition-fees-benny-higgins/

20 https://www.hepi.ac.uk/wp-content/uploads/2019/11/2019-
ELECTION-BRIEFING.pdf

21 On the other occasion, in 2010, neither major party had a clear policy
as they were waiting for the Browne report. https://www.tandfonline.com/
doi/abs/10.1080/13619462.2013.783418

22 https://www.bbc.co.uk/news/education-50221335

23 https://theconversation.com/does-college-turn-people-into-
liberals-90905
38                                         Student voters: Did they make a difference?
Trustees
 Professor Sir Ivor Crewe (Chair)
           Sir David Bell
    Mary Curnock Cook OBE
     Professor Sir Peter Scott
 Professor Dame Helen Wallace
        Advisory Board
        Alison Allden OBE
Professor Dame Julia Goodfellow
       Professor Carl Lygo
    Professor David Maguire
    Professor Sally Mapstone
            President
       Bahram Bekhradnia
             Partners
           Advance HE
          BPP University
              Elsevier
  iQ Student Accommodation
             JobTeaser
               Kaplan
           Lloyds Bank
        Mills & Reeve LLP
               Oracle
              Pearson
        Research England
    Times Higher Education
                Tribal
         Unite Students
       UPP Group Limited
This short report looks more deeply into the question of whether
student voters make a difference to UK election results by:
• taking the 25 constituencies with the highest proportion of
full-time students – those where they are thought to make up
more than 17.5 per cent of the electorate;
• considering the results in these seats for the last four
general elections, in 2010, 2015, 2017 and 2019; and
• comparing the results in these seats to the bigger picture.
HEPI was established in 2002 to influence the higher education debate with evidence.
We are UK-wide, independent and non-partisan.
September 2020 ISBN: 978-1-908240-71-2
Higher Education Policy Institute
99 Banbury Road, Oxford OX2 6JX
Tel: 01865 284450 www.hepi.ac.uk
Printed in the UK by Oxuniprint, Oxford
Typesetting: Steve Billington, www.jarmanassociates.co.ukYou can also read