Sustainable Immunization Financing in Asia Pacific
←
→
Page content transcription
If your browser does not render page correctly, please read the page content below
INDONESIA COUNTRY BRIEF

Sustainable Immunization Financing in Asia Pacific
August 2017

  ThinkWell
  @thinkwellglobal
www.thinkwell.global
Acknowledgements:
ThinkWell would like to express our sincere gratitude to all individuals and organizations who
contributed to the ideas presented in this report.
Authors:
This report was prepared by Martha Coe, Jessica Gergen, Caroline Phily, and Annette Ozaltin.
Recommended Citation:
Coe, Martha, Gergen, Jessica, Phily, Caroline, and Annette Ozaltin. August 2017. “Indonesia Country
Brief”. Sustainable Immunization Financing in Asia Pacific. Washington, DC: ThinkWell.

This report was produced by ThinkWell, with funding and input from Merck Sharp & Dohme Corp., a
subsidiary of Merck & Co., Inc., Kenilworth, New Jersey USA
TABLE OF CONTENTS

Acronyms ..................................................................................................................... 4
Key Messages............................................................................................................... 5
Introduction ................................................................................................................. 6
Context ........................................................................................................................ 6
Structural and Political Trends for Health .................................................................... 10
Demand and Access to Health Services ....................................................................... 12
New and Underutilized Vaccines ................................................................................. 17
Health Financing and Immunization ............................................................................ 18
New and Underutilized Vaccines Scale Up in Country .................................................. 25
Immunization in Transition, Key Trends, and Takeaways ............................................. 27
References ................................................................................................................. 29

                                                                                                                                     |3
ACRONYMS MoF Ministry of Finance
BCG Bacille Calmette-Guerin MoH Ministry of Health
BIAS Bulan Imunisasi Anak Sekolah MR Measles-Rubella
(school-based immunization
program) MSS Minimum Service Standards
BPJS Badan Penyelenggara Jaminan NADFC National Agency of Drug and Food
Sosial (Social Security Health Control
Administrator) NCD Non-Communicable Disease
DTP Diphtheria-Tetanus-Pertussis NIP National Immunization Program
cMYP Comprehensive Multi-Year Plan NUVI New and Underutilized Vaccine
DAK Dana Alokasi Khusus (earmarked Introduction
central transfer) OOP Out of Pocket Payment
DDC Department of Disease Control PCV Pneumococcal Conjugate Vaccine
DHO District Health Office SAGE Strategic Advisory Group of Experts on
GDP Gross Domestic Product Immunization
Hep B Hepatitis B SHI Social Health Insurance
HTA Health Technology Assessment Td Tetanus-Diphtheria
HPV Human Papilloma Virus THE Total Health Expenditure
IPV Inactivated Polio Virus TT Tetanus Toxoid
ITAGI Indonesia Technical Advisory UHC Universal Health Coverage
Group UNICEF UNICEF Supply Division
on Immunization SD
JE Japanese Encephalitis VAT Value Added Tax
JKN Jaminan Kesehatan Nasional WHO World Health Organization
(National Health Insurance
mechanism)
MCV Measles Conjugate Vaccine
|4KEY MESSAGES
Context ‒ Indonesia expects to benefit from moderate economic growth, stable
cohorts of new children to immunize, and slow but steady improvements
in child health outcomes and immunization coverage.
‒ The burden of disease is shifting, with NCDs increasing and
communicable diseases (including vaccine-preventable diseases)
decreasing. There will be new demands on the health system, requiring
the immunization program to compete for resources.
‒ Indonesia is one of the top 10 countries with the most unvaccinated
children.
Immunization ‒ Despite Indonesia's strong economic performance in the last two
Financing decades, its growth has not translated efficiently to government social
spending, with low public expenditure on health (6% of GDP in 2014) and
large levels of support for the immunization program still coming from
donors.
‒ The government will need to direct significant additional resources to
immunization to bring the current vaccine schedule in line with
international recommendations and other middle-income countries in
the region, and to finance plans for new vaccine introductions.
‒ The multiple sources of financing for the program produces complexity in
understanding roles and responsibilities, threatening its performance.
Key Findings ‒ Indonesia is highly decentralized, with local priorities continuing to rule
health spending. However, most local governments miss their health
allocation targets and fail to execute their entire budget.
‒ The central government has limited ability to influence how resources
are allocated at the district level where delivery is done, thus high
variability in outputs and outcomes in immunization persists.
‒ The implementation of a national health insurance mechanism, JKN, is
facing worrisome fiscal deficits and will not likely reach its 2019 universal
coverage target. There is potential for JKN to take on more financing for
the immunization program, but it is unclear if the deficit will prevent
expansion of the benefits package or support further coverage of
prevention services.
‒ With the country’s impending transition to fully self-financing its
immunization program in 2019, Indonesia needs to find new sources of
new resources to replace the 10-15% externally financed share of the
immunization program budget.
‒ While earmarked taxes have not yet been politically viable, there are
plenty of efficiency gains to be had to increase fiscal space.
‒ Prioritization of new and underutilized vaccine introductions is closely
linked to the production capacity of domestic manufacturer BioFarma.
The country holds an exclusive procurement agreement with the state-
owned company.
‒ The ITAGI is relatively nascent and relies heavily on WHO
recommendations and secondary findings from neighboring countries.
|5INTRODUCTION
Indonesia, a country consisting of over 6,000 inhabited islands, is in the middle of a long-
term transformation of its political and health systems. Decentralization and
democratization, initiated in 1999, partnered with a new national health insurance
mechanism, have affected how healthcare is financed and prioritized, with funding and
outputs varying widely among the 514 districts. The pending exit of Gavi, the Vaccine
Alliance (Gavi) funding – 9% of the current immunization program budget – and continuous
reduction of donor assistance will place pressure on the public budget for the immunization
program, supporting movements for improved decentralized management and involvement
of the new national health insurance scheme in directing funds towards immunization.1
Understanding the political economy of the country, the financing flows, and how these
factors that support or deter the prioritization of funding for immunization programming will
be essential to improve coverage rates and an expanded the schedule for immunization,
financed in a sustainable manner.
This brief is one of six in a series that analyzes how countries in Asia Pacific, undergoing
financial and/or political transitions, prioritize and fund their immunization programs. The
brief contains valuable information for all stakeholders interested in promoting sustainable
and robust immunization programs and illustrates a variety of ways to engage in realizing
this outcome.
CONTEXT
ECONOMIC TRENDS
Indonesia’s strong economic growth, and expected continued growth in the years ahead,
provides the revenue necessary to make continuous investments in social programs,
including healthcare.2 Indonesia’s economy is considered one of the best performing
emerging market economies and grew at an average annual rate of 4.1% between 1995 and
2015 (Figure 1).3 Indonesia’s favorable economic outlook is attributed to its young
population, low public debt, large domestic markets, wealth of natural resources, and stable
political system.4 Growth has slowed in recent years due to decreases in foreign direct
investment, oil revenues, and slumping commodities prices.5 Nevertheless, moderate
growth at 5-6% per year is expected through 2020, during which time Indonesia will likely
transition from lower-middle income to upper-middle income status.6
1 World Bank (2016).
2 Dieng, I (March 16, 2017).
3 World Bank (2017b)
4
Dieng, I (March 16, 2017).
4 Ibid.
6 International Monetary Fund (April, 2017).
|6Figure 1. Year-on-Year Economic Growth (1995-2022)
10
GDP Growth (% change)
5
0
1995 2000 2005 2010 2015 2020 2022
-5
-10
-15
Economic Growth (% Change) Forecast
Source: World Bank (2017b).; International Monetary Fund (April, 2017).
Strong economic growth is producing a burgeoning middle class that will demand
increased healthcare quality and options. Given the economic stability, the middle class is
estimated to grow by over 90 million consumers by 2030, reaching 135 million people (>40%
of the projected population).7 This growing segment of the population has expendable
resources and a historic proclivity for mobilizing around political issues.8 This includes issues
of healthcare quality and preferences on sources of healthcare.9 As income rises for the
middle class, utilization of pharmaceuticals and private facilities is expected to increase.
With greater purchasing power comes increased value of brands. Studies from similar
emerging economies demonstrate that a growing middle class is more willing to pay out-of-
pocket for branded drugs, fewer side-effects, and greater effectiveness.10 Demand for
vaccines not included in the National Immunization Program (NIP), and only accessible in the
private sector, will likely increase due to the growing middle class as well as greater
awareness of health.
DEMOGRAPHIC TRENDS
Indonesia is undergoing a demographic transition with declining fertility and population
growth rates. Fueled in part by economic growth and improvements in public health, life
expectancy at birth increased dramatically from 1960 to 1990 and has been steadily rising
since.11 In addition, the government’s long-term focus on family planning contributed to a
significant decline in fertility rates over the same period.12 The fertility rate has remained
steady at 2.5 births per woman since 2000, with the rate expected to decrease further but
remain over replacement levels through 2030. Indonesia’s steady birth cohorts allow for
predictable planning and budgeting of the routine immunization package.
7 Oberman et al. (2012).
8 Arnold, D (September 6, 2016).
9 Figgis, P (2015-2017).
10
McKinsey & Company (2012).
11 World Bank (2017b).
12 Mize L and B Robey (2006).
|7Figure 2. Health Expenditure Over Time in Relation to Population Growth
Public Health Expenditure 300000000 8E+10
7E+10
250000000
6E+10
200000000
Population
5E+10
150000000 4E+10
3E+10
100000000
2E+10
50000000
1E+10
0 0
1995 2000 2005 2010 2014
Population
Health Expenditure per capita, public (2011 PPP)
Health Expenditure, public (2011 PPP)
Source: World Bank (2017b)
A rapid increase in the population aged 65 and over is expected, placing greater
importance on immunization throughout the lifespan. Life expectancy at birth increased
dramatically from 1960 to 1990 and has been steadily rising since.13 With stable birth
cohorts and increasing life expectancy, the population aged 65 and older is projected to
nearly double by 2030.14 This population segment presents a new market for lifecycle
vaccines. As this population grows, the cost-effective value of preventative health
interventions across the lifespan will increase. The government and providers (both public
and private) will be pressured to expand the current immunization schedule to
accommodate the aging population.
HEALTH OUTCOMES
Indonesia has made great strides in improving maternal and child health, edging closer
towards its Sustainable Development Goals. Investments in improved sanitation,
immunization coverage, and other child health programs supported Indonesia’s impressive
decline in its under-five and infant mortality rates (Figure 3).15 Indonesia is not far from
attaining the sustainable development goal target for under-5 mortality ofin 2015.18 However, the burden of vaccine-preventable diseases remains too high. The
burden is highest for vaccines not yet included in Indonesia’s routine schedule.
Figure 3. Maternal and child health indicators
90 500
450
Mortality Rate, per 100,000 live births
80
Mortality Rate, per 1,000 live births
70 400
350
60
300
50
250
40
200
30
150
20 100
10 50
0 0
1990 2000 2005 2010 2015
Under-5 Mortality Rate (per 1,000 live births)
Infant Mortality Rate (per 1,000 live births)
SDG Target (Under-5 Mortality, per 1,000 live briths)
Maternal Mortality Rate (per 100,000 live births)
SDG Target (Maternal Mortality, per 100,000 live births)
Source: World Bank (2017b).
Shifts in the burden of disease are pulling focus towards non-communicable diseases,
which may affect the commitment to and focus on immunization in the coming years. The
success of vaccines in decreasing cases of communicable diseases, in combination with an
aging population and lifestyle changes, will continue to shift the burden of disease towards
non-communicable diseases (NCDs). Between 1990 and 2015, NCDs increased from 37% to
66% of the total burden of disease, while communicable diseases, including vaccine-
preventable diseases, fell from 56% to 27% of the burden.19 The burden of NCDs is expected
to rapidly increase as Indonesia finishes its epidemiological transition.20 There will be new
demands on the health system, requiring preventative health programs, including
immunization, to compete for scarce resources. Currently, of the three national health
priorities of maternal and child health, preventative and promotive care, and disease
control, immunization falls as a priority program within disease control and NCDs fall within
the preventative and promotive priority. Both programs have thus been protected and
prioritized within the current 5-year plan. However, planning for the 2020-2025 plan has
begun and this landscape could change. Indonesia has already set up a NCD unit within the
18 Inclusive of polio, diphtheria, pertussis, neonatal tetanus, measles, rubella, congenital rubella syndrome, and Japanese
encephalitis. (WHO Regional Office for South-East Asia. August 31, 2016.)
19 Institute of Health Metrics and Evaluation (2016).
20 World Bank (2016).
|9Ministry of Health (MoH) and has a multi-sector NCD strategy with multiple action plans
based around preventative primary care.
STRUCTURAL AND POLITICAL TRENDS FOR HEALTH
Indonesia underwent a profound change over the past two decades, transitioning from a
centralized authoritarian regime to a decentralized democratic state. In 1998, following the
Asian financial crisis, poverty levels doubled and a disaffected populace forced President
Suharto and his “New Order” to resign after a 31-year rule.21 In the years that followed,
rapid socio-economic development was underpinned by a legacy of command and control
decision-making, restricted and thus inexperienced civil society, and weak local polities.
Following the emergence of several secessionist movements, financial and political
decentralization was organized around empowering district governments to prevent
provinces from serving as a rallying point for such movements. Decentralization was
employed in 2001 to establish broader buy-in to the new system and facilitate bottom-up
development.
Local priorities will continue to rule health spending and local leaders will be pertinent to
financing for immunization in decentralized Indonesia. High levels of decentralization and
low levels of accountability present difficulties in setting central health directives and
delivering on them. While there is central control of supplies procurement and planning of
immunization programming, operations and immunization delivery are the responsibility of
subnational governments. Centrally assigned budgets are then spent on locally defined
priorities. There are limited oversight mechanisms and feedback loops between central and
district governments, and annual central-local budget transfers are not based upon
performance. Provincial health offices – accountable to the provincial governor and not the
MoH – manage provincial hospitals and coordinate health care at the district level. District
health offices (DHOs) – accountable to the MoH and the district government, but not the
provincial health offices – manage all other public facilities and procure and distribute
medical supplies.22 Moreover, MoH transfers go to district governments which report to the
Ministry of Home Affairs, not the MoH. Budget monitoring is weak and there is wide
variation between plans/allocations and expenditures. The central government, therefore,
has neither mechanism to incentivize outputs or outcomes from its investments, nor
influence over how resources are allocated and spent at the district level where delivery is
done. While multiple factors impact the effectiveness of local governance in policy
implementation and spending, the capacity and motivation of local leaders is one of the
most important.
The Ministry of Health is exploring a new program as a method to improve governance
and accountability within the health system as a means to advance immunization services
and financing. Indonesia’s government currently operates with Minimum Service Standards
(MSS), outlined by the central government and implemented by local governments. These
standards are key performance indicators, meant to ensure quality public services for the
population of Indonesia. The MoH and NIP managers have included child immunization
coverage as a key indicator. However, there are currently no mechanisms to penalize or
reward districts with regards to compliance. Efforts to increase oversight of MSS outputs
could have positive effects on local immunization investment. The MoH is developing a
performance-based financing scheme for district block grants with districts judged and
21 Sumarto, S. and S. Bazzi (2011).
22 Hort K. and W. Patcharanarumol (Eds.) (2017).
| 10monetarily incentivized based on MSS achievements. They hope to roll-out this program in
the next couple of years, but the proposed decree has not been ratified by the Ministry of
Home Affairs and stakeholders are dubitative of its implementation in the short term. The
World Bank has taken interest in the initiative and could potentially leverage a loan for its
ratification.
Health is a priority issue for Indonesian citizens and the government, allowing for civil
society to increase pressure on politicians to continue making change. President Joko
Widodo, a strong advocate of universal health coverage (UHC), moved his political career
forward with help, in part, from a public health agenda. While Governor of Jakarta, he
piloted the Jakarta Health Card, a precursor to Indonesia’s UHC scheme.23 His successful
presidential campaign included UHC in its platform. Widodo’s continued focus on health has
created a favorable political platform for health reforms and attracted investment into the
sector. Indonesia has leveraged this political momentum to overhaul the health insurance
system in favor of achieving UHC, and improving basic health services like immunization.
Several civil society organizations, including Save the Children, World Vision Indonesia,
White Ribbon Alliance Indonesia (Aliansi Pita Putih Indonesia/APPI), PKBI/Indonesian
Planned Parenthood Association (Member Association of IPPF), Muhammadiyah, and Plan
Indonesia, are focused on maternal and child health and work with the MoH on
immunization program needs.
Box 1. Jaminan Kesehatan Nasional (JKN) Summary
JKN is the mechanism under which Indonesia consolidated its various national health insurance
schemes with the aim of providing coverage for all Indonesians by 2019. JKN covers medical and
non-medical benefits without caps, but excludes aesthetics, orthodontics, infertility treatments,
drug rehabilitation programs and claims related to extreme hobbies, services performed overseas,
etc. Primary facilities are paid a capitated fee depending on the number of JKN beneficiaries
enrolled with each facility as their designated primary care provider. Hospitals are reimbursed for
case-based care where a fixed fee is paid to cover all services associated with an episode of care.
JKN utilizes a high-level performance-based financing system that can decrease payments if
facilities perform poorly on three indicators: 1) total utilization rate, 2) no non-specialized
referrals, 3) Preventive activities for chronic diseases offered.
The scheme is mandatory for all civil servants, military, police, and salaried workers, with their
employers contributing, and all citizens classified as “poor” or “near poor” receiving subsidized
coverage from the government. Informal workers are also expected to participate, though JKN has
experienced difficulties in reaching them as they must elect to register and pay premiums. The gap
in the pool of beneficiaries has created financial troubles for JKN. After two years of operation,
BPJS, the purchasing institution for JKN, was running a US$1.48 billion deficit. Estimates released in
2015 predicted an accumulated deficit of US$12.9 billion by 2019. Though coverage of the poor is
succeeding and coverage of higher-income, salaried workers is strong, the missing middle of
informal workers who have funds to input into the scheme is an unsustainable problem. As of early
2017, 67% of the population is covered by JKN.
With goals of achieving universal health coverage, Indonesia consolidated a number of
public health insurance mechanisms under the umbrella of JKN in 2014. The basis for UHC
emerged in 2004 with the National Social Security System Law. Up until that point, only civil
service, military, and police were covered by national insurance, and each with their own
program. Some private companies also contributed to health insurance for their workers.
23 Economist Intelligence Unit (January, 2015).
| 11Indonesia opted for a staged roll-out of the national scheme rather than a big-big reform.
Over the next 10 years, Indonesia initiated programs focused on the poor and near-poor,
and later on pregnant women, in an effort to reduce child and maternal mortality rates. At
the same time, a variety of localized health insurance schemes collectively known as
Jamkesda were operating. Finally, in 2014, after years of support from numerous politicians
and multiple parties, all the existing schemes were consolidated under JKN with the goal of
extending coverage to all Indonesians by 2019. JKN coverage in early 2017 was around 67%
of the population.24 Since JKN’s commencement, delivery of the NIP has not been explicitly
included in the benefits package. However, the primary care capitation payment to facilities
may tangentially cover some of the operations costs that benefit the immunization program.
DEMAND AND ACCESS TO HEALTH SERVICES
Utilization of health services is increasing but remains low, and high variation in utilization
exists by geographic area and population economic status. Both outpatient and inpatient
utilization has been increasing, but utilization rates vary greatly by province. For example,
less than 10% of the population in Maluku province used outpatient care in the last 30 days,
compared to more than 20% of the population in the provinces of Bali, Yogyakarta, and East
Nusa Tenggara.25 This mirrors the trend in immunization access and coverage where Maluku
province has much lower coverage rates than the provinces of Bali, Yogyakarta, and East
Nusa Tenggara, among others.26 Utilization is also increasing among the poorest 40% of the
population.27 Although, immunization has not mirrored healthcare utilization rates for the
bottom 40% for all vaccinations, with BCG and DTP3 rates for the bottom 40%, dropping
between 2007 and 2013 (12.05 and 1.2 percentage points respectively).28
Private sector facilities play a large and expanding role in Indonesian healthcare. While
public facilities dominate rural service, private facilities have a large presence in urban areas
and are growing in number throughout the country.29 Dual practice is legal and it is common
for healthcare professionals to work in both public and private facilities.30 Over half of
hospitals in Indonesia are privately owned and operated and half of outpatient visits are
estimated to occur at private facilities.31 Utilization rates in the private sector dropped
slightly from 10.4% to 8.7% between 2014-2015 as JKN was implemented, but are expected
to rebound.32 As coverage under the mechanism grows, and utilization of public facilities
increases, the private sector is expected to build out its services to meet the demands of
middle and upper class consumers looking for faster, higher quality services.33
IMMUNIZATION ACCESS AND COVERAGE
All Indonesians are entitled to ‘routine’ immunization services in both public and private
health facilities, in addition to school-based campaigns, free of charge. Immunization
services are provided by both public and private health facilities as they are entitled to
receive free vaccines from the government.34 For private facilities, this is regardless of
24
BPJS Kesehatan (2017). Note: Using a growth rate of 1.01%, estimated population at end of 2016 as 260,830,154.
25 World Bank (2016).
26 RISKESDAS (2013).
27 World Bank (2016).
28 RISKESDAS (2007); RISKESDAS (2013).
29 World Bank (2016).
30 Ibid.
31 Ibid.
32
Ibid.
33 Oxford Business Group (August 15, 2013).
34 World Bank (2016).
| 12whether they are empaneled with JKN. Private sector facilities may also choose to purchase
vaccines – those included in the NIP and others – on their own. Immunization services for
school children are also provided via the School-based Immunization Month (BIAS) program,
where health center staff deliver adolescent vaccines in local schools through a centrally
funded campaign.
Due to lower out of pocket payments and distance to access points, the majority of the
population accesses vaccination services at posyandus (community health posts). Around
90% of children were vaccinated in public facilities according to the 2007 coverage survey –
75% in health posts (posyandu), 10% in health centers (puskesmas), and 5% in village birth
facilities (polindes) and other places. The remaining 10% of children were vaccinated in
private clinics and hospitals.35 The percentage at posyandus is now estimated at 80% by
informants according to a recent survey. At public health facilities, both JKN and non-JKN
members can receive immunization services for free, while at private facilities eligible for
JKN reimbursements, only JKN members receive immunization services for free.
Besides free services and an extensive network of facilities across the country, vaccine
availability may be a key reason for public sector preference. A survey in 2011 found that
over 80% of puskesmas had government mandated vaccines available, compared with 25%
of private facilities.36 The growth of JKN will only increase the number of Indonesians
utilizing their general access to healthcare through financial access and increased
communications on benefits. Utilization of outpatient services is already increasing among
the poorest 40% of the population.37 This will have positive benefits on immunization service
access in public facilities over time.
Indonesia includes all WHO recommended traditional vaccines in its immunization
schedule, with the exception of rubella.38 The national immunization schedule includes
vaccines against hepatitis B (Hep B), polio, diphteria, pertusis, haemophilus influenzae type
b, tetanus (Td), and measles (Table 1). Five immunizations are given to children under one
year, under the government’s slogan of “Complete Five Immunization, or L-I-L” (Lima
Imunisasi Lengkap).39 The routine immunization program also targets children beyond age
one and in schools, serving as a platform to boost immunity to measles, DT, and tetanus
toxoid (TT) in children in grades 1-3. Finally, pregnant women are given TT during their
prenatal visits.40
Table 1. Indonesia National Immunization Schedule
Antigens (Vaccines) Schedule
1 HepB 0-7 days
2 BCG 1 month
3 OPV 1, 2, 3, 4 months
4 IPV 2, 3, 4 months (in selected regions)
35 RISKESDAS (2007).
36 World Bank (2016).
37 Ibid.
38
Ibid.
39 Directorate General for Disease Control (2015).
40 Ibid.
| 135 DTP-Hib-HepB 2, 3, 4, 18 months
6 Measles 9, 24 months
7 DT 6-7 years
8 Td 7-8, 8-9 years
9 TT 15-39 years
10 Vitamin A 6-59 months
Source: WHO (2017b).
Indonesia is one of 10 countries with the most under-vaccinated children.41 Though
estimates vary widely by source, WHO and UNICEF data show that Indonesia’s DTP3
coverage rate (81%) did not change from 2010-2015.42 An estimated 59-68% of children are
fully immunized, and resulting from its large population and weak vaccination performance,
over two-thirds of lower-middle income countries have coverage rates better than
Indonesia.43 Performance on the DTP3 indicator highlights the challenges faced by
Indonesia’s primary health care system in reaching and serving children repeated times
during the initial year of life.44 On measles, Indonesia was declared off track by the Strategic
Advisory Group of Experts on Immunization (SAGE) due to its large number of unvaccinated
infants for measles first dose.45 Its national coverage rate of 69% for MCV1 lags far behind
the 95% coverage target (Table 2). 46
Table 2. Indonesia’s Standings on International Vaccination Targets
Goals of the Decade of Vaccines Indonesia’s Standing
Zero new cases of polio Achieved
Eliminate Maternal and Neonatal Tetanus Achieved in 2016*
90% Coverage of DTP3 with no district less At 81% coverage, Indonesia is still
than 80% coverage short of this target
Eliminate Measles Indonesia still experiences
thousands of cases annually
Eliminate Rubella Rubella cases are still regularly
reported though the MR vaccine is
set to be introduced this year
Introduce 1+ new or underutilized vaccine Indonesia’s introduction of IPV in
(NUVI) since 2010 2016 fulfills this goal
Achieved Moderate Achievement Low Achievement
Source: Strategic Advisory Group of Experts on Immunization (2015).
*UNICEF (May, 19 2016).
41
Statistics Indonesia, et. al (2013).; Strategic Advisory Group of Experts on Immunization (2015).
42 WHO (2017c).
43 Primary Health Care Performance Initiative (2015).
44 Ibid.
45 Strategic Advisory Group of Experts on Immunization (2015).
46 WHO (2016).; Strategic Advisory Group of Experts on Immunization (2015).
| 14National immunization rates had been steadily increasing, but now appear to be declining.
Informants note that fewer districts have DTP3 coverage rates over 90% than in previous
years and more have coverage rates less than 50%.. While these figures point to a major
problem in the immunization program, questions have been raised on the reliability of the
data. Districts are responsible for self-reporting their coverage and the diminishing numbers
may be due to limited available data. A housing survey has not been conducted since 2013
and current statistics could include a number of estimates and guesswork.
National immunization coverage rates mask high variability between location, local
priorities, and economic status. The urban-rural divide is a key determinant of vaccination.47
Although half of the country’s population is rural, 63% of all unvaccinated children live in
rural areas.48 Indonesia’s latest coverage survey found stark differences in coverage, with
urban rates higher than rural rates by 14% for a number of vaccines.49 Geographic challenges
and local government capabilities and priorities are a key reason for the subnational
variability. District governments are responsible for service delivery, including the
operational costs of facilities, health worker incentives, cold chain, and other activities
needed to carry out vaccination. In many districts, a lack of commitment, weak planning,
and limited budgetary capacity and budget execution capacity, result in low or varied
contributions by local government to support NIP activities.50 The extreme differences in
coverage by province can be seen in the variability of Penta coverage by geographical area in
Figure 4, 5. Variability in coverage is also evident by economic status of the population
(Figure 5).51 Even in urban areas where everyone has a near equal chance of initiating
contact with the immunization system, the wealthy are more likely to complete their
vaccinations. Coverage for each vaccine is highest amongst the wealthiest quintile, with the
gap greatest at completion of the vaccine series when compared with the poorest quintile.52
Figure 4. Pentavalent Coverage by Geography, 2015
Source: WHO Regional Office for South-East Asia (2015).
47 World Bank (2016).
48 Ibid.
49 RISKESDAS (2013).
50
Directorate General for Disease Control (2010).
51 RISKESDAS (2013).
52 Statistics Indonesia et.al (2013).
| 15Figure 5. Percentage of Children Immunized by Wealth Quintile and Vaccine Type, 2013
100
90
Vaccination Coverage (%)
80
70
60
50
40
30
HepB-0 BCG DPT-HepB-3 Polio-4 Measles
Poorest Quintile Wealthiest Quintile
Source: RISKESDAS (2013).
The private sector’s large and expanding role in Indonesian healthcare offers access for
those with available finances to access vaccines outside of the National Immunization
Program, particularly in urban areas. While public facilities dominate rural and national
immunization service, private facilities have a large presence in urban areas and are growing
in number throughout the country.53 Half of outpatient visits are estimated to occur at
private facilities.54 Private practices are folded into the national system and provincial and
district governments have oversight responsibilities for local private hospitals and clinics.55
Figure 6. Children 12-23 Months Receiving Basic Immunization in 2013, % by Province
100
90
80
Vaccination Coverage (%)
70
60
50 HB-0
40 BCG
30 DPT-HB-3
20 Polio-4
10
Measles
0
Province
Note: HB-0, HepB first dose; HB-3, HepB third dose. Source: RISKESDAS (2013).
53 World Bank (2016).
54 Ibid.
55 Ibid.
| 16DEMAND FOR IMMUNIZATION SERVICES
Persistent questions around vaccine safety and halal vaccines have affected demand in the
Muslim majority country. Though regulations are in place to ensure that safe vaccines are
administered, enforcement and monitoring mechanisms are weak, evidenced by recent fake
vaccines discovered in over 37 private hospitals and clinics in nine cities.56 Though the fake
vaccines were forged as imported and did not go through the public system, the
government’s Food and Drug Monitoring Agency was responsible for oversight. In 2013,
26.3% of Indonesian infants were unvaccinated because their parents refused service.57
Indonesians refuse vaccination for their children for several reasons, but one stated line of
reasoning relates to religious principles. The use of a gelatin derived from pork products in
some vaccines leads many observant Muslims, who abstain from ingesting pork products, to
refuse immunization services.58
The government has responded to low demand for routine immunization through
supplemental campaigns. A campaign to deliver the measles vaccine to children between 9
months and 5 years was carried out in three poor performing provinces in 2009, reaching 2
million children.59 Polio immunizations for unvaccinated children up to 5 years old were also
administered the same year.60 National Immunization Week was introduced in 1995 and
mainly serves as a polio campaign, but has only been conducted on an ad-hoc basis.61 Their
efforts have been greatly supported by civil society groups like PKK (community family
welfare) whose volunteers help to manage and operate posyandus (local health posts).
Financing for immunization programming in Indonesia requires budgeting for supplemental
campaigns to combat lower than full demand and utilization rates.
A number of external factors are increasing demand for new and underutilized vaccines.
Though Indonesia is graduating out of Gavi funding in the coming year, they are currently
eligible for catalytic funding for new vaccine introductions. By applying to introduce new
vaccines prior to 2017, Indonesia was able to receive co-financing for introduction. Though
the government has an agreement to only purchase vaccines for its national program
through state-owned PT BioFarma, the company does not have production capacity for the
new and underutilized vaccines on Indonesia’s list. By procuring imported vaccines from
UNICEF SD, in partnership with Gavi, the country can also ensure lower prices for the newly
introduced vaccines for five or more years after being fully self-financed. This can offer
substantial savings in the long, run and Indonesia has proposed adding several vaccines for
this reason.
NEW AND UNDERUTILIZED VACCINES
Indonesia is updating its schedule to fill immunization gaps and considering several new
and underutilized vaccines. Indonesia plans to introduce vaccines against measles-rubella,
HPV, and pneumococcal nation-wide by 2025.62 Japanese Encephalitis (JE) and rotavirus
vaccines are also of interest to the MoH. The 2018 budget has recently been finalized and
includes funds to begin the roll-out of Measeles-Rubella (MR), HPV, pneumococcal, and JE
vaccines in select provinces. Many of these vaccines have been introduced in co-financed
56 Karmini, N. and M. Mason (July 22, 2016).
57 RISKESDAS (2013).
58 Prathivi, N. (2015).
59 UNICEF (October 8, 2009).
60 Ibid.
61 WHO Regional Office of South-East Asia (2017).
62 Ministry of Health, Republic of Indonesia (January 3, 2017).
| 17demonstrations/pilots or targeted campaigns in specific geographic areas through varying
levels of help from outside donors, with planned introduction in the national schedule to
follow (described in Box 2).63 With the largest burden of dengue in Southeast Asia, Indonesia
may also consider a new dengue vaccine in the future.64
HEALTH FINANCING AND IMMUNIZATION
IMMUNIZATION COSTS
Vaccine cost and personnel represent almost 70% of immunization program expenditures.
Excluding shared costs and campaigns, the lion’s share of immunization program
expenditures in 2013 were for routine vaccine commodities (41%) and personnel (24%)
(Figure 7).65 While these costs are to rise at a relatively predictable rate over the years with
the stable birth cohort, costs for new vaccine investment will rise rapidly. Additionally,
Indonesia predicts that catch-up campaigns to implement these new and underutilized
vaccines introductions (NUVIs) will take on a larger portion of the program costs as they are
rolled out into 2019 (Figure 8).
Figure 7. Immunization Program Cost Profile (USD), 2013
Transportation Vehicles
Injection supplies 1% 1% Other capital
4% equipment
0%
Cold chain equipment
9% Traditional Vaccines
New Vaccines Personnel
3% Other routine recurrent costs
New Vaccines
Other routine
Traditional Vaccines
recurrent costs Cold chain equipment
44%
13%
Injection supplies
Transportation
Vehicles
Personnel
25% Other capital equipment
Source: Directorate General of Disease Control (2015).
Note: Traditional vaccines are those that have been part of immunization programs for years. The production
technology is widespread with a broad market of manufacturers. Thus, they are much cheaper than NUVIs.
63
Gavi (February, 2016).
64 Chng et. al (2016).
65 Directorate General of Disease Control (2015).
| 18Figure 8. Baseline Financing Profile (shared cost and campaign excluded)
100,000,000
90,000,000
80,000,000
Costs in US$
70,000,000
60,000,000
50,000,000
40,000,000
30,000,000
20,000,000
10,000,000
0
2013 (baseline) 2016 2017 2018 2019
Traditional vaccines New vaccines Injection supplies
Personnel Transportation Other routine recurrent costs
Cold chain equipment Other Campaigns
Source: Directorate General of Disease Control (2015).
GENERATION
Revenue for the health system comes from five main sources with out-of-pocket
expenditures and government resources providing the majority of funding. Out-of-pocket
(OOP) expenses, government budget (tax revenues, loans, and grants), mandatory health
insurance (JKN), and donor funds make up the mix of public and private sources that fuel the
health sector, with small contributions coming from private insurance. Despite having a
national health insurance program, out-of-pocket expenditures make up the biggest single
source of health funding, at 47%, while government inputs make up 38% of total health
expenditure (THE).66 Social health insurance (SHI) inputs 13%, private health insurance adds
2%, and external resources are responsible for 1% of resources for health (Figure 9). In stark
contrast, immunization is covered completely by the government, though 15% of the
program is financed through external resources.
66 World Bank (2016).
| 19Figure 9. Health System Funding Sources, 2014
2% 1%
Out of Pocket
13%
Government
47%
SHI
38% Private
Insurance
Source: World Bank (2016); World Bank (2017b).
Limited capacity to collect needed revenue through taxes has restricted what Indonesia
can invest into public programs. State revenue is collected through taxes (10% customs and
excise and 67% other), non-tax revenues (23%), and grants (The immunization program in Indonesia has received generous support from donors, but
the country is now transitioning to fully self-finance its program in 2018. Although less
than 1% of THE, external financing has accounted for a significant share (roughly 15%) of the
immunization program.73 This share has been declining however, and, in 2014, the
government was responsible for 91% of the expenditures for the immunization program
($140.0 million of $154.7 million).74 Gavi financed most of the remaining 9% ($14.3 million).
The gap left by Gavi will create opportunities to discuss new potential revenue generation
strategies. As of yet, Indonesia has not done much experimentation with this prospect. A
limited tobacco tax has revenues earmarked to tobacco control, but no earmarks are
currently directed towards immunization. Indonesia has rather expressed strong interest in
resource tracking and efficiency gains rather than a push for revenue generation.
ALLOCATION OF RESOURCES
The MoH builds the immunization budget to fit within pre-determined ceilings with
limited space to negotiate increases for specific health outcomes. The process begins with
the preparation of national and regional five-year plans based on current macro-economic
framework, fiscal policy, and presidential priorities. The current 5-year plan, in which
immunization is one of 14 priority health programs, ends in 2019 and planning for 2020-
2015 is starting. The MoH then formulates a draft health work-plan based on proposals
submitted from the level below to request funding from the Ministry of Finance (MoF) for
specific activities and outputs. After reviewing the various sector workplans, the Ministry of
Finance and the Ministry of National Development Planning (Bappenas) issue a budget
ceiling for each sector. The MoH has limited room to negotiate the ceiling, though the
process is in place to allow this practice. Ministries use the ceiling to build a budget that
highlights the results to be achieved which is then finalized by MoF and Bappenas, in
consultation with the respective ministries. The budget is submitted to the House of
Representatives and, following ratification, is executed by presidential decree. The budget
for 2018 was just finalized and includes a 50% increase in the budget for vaccine
procurement – fitting with designs of introducing multiple vaccines.
The NIP budget is not determined by tools or forecasting needs, but by the political
process of negotiating with Bappenas to fit the needs of the health system into the MoF’s
assigned ceiling. For immunization budgeting, the MoH integrates program targets and
activities into its five-year and annual plans, submitting financing needs for desired
outcomes to the MoF. The Indonesian Technical Advisory Group on Immunization (ITAGI),
comprised of government representatives, multilateral donors, professional associations,
and civil society organizations, feeds into the budgeting process through its
recommendations for vaccine introductions. While the establishment of the ITAGI is a good
step forward and a trend that is progressing across the globe, their relatively new inception
and placement under the MoH means that the ITAGI has little influence on budgetary
decisions. The Immunization and Quarantine Directorate (IQD) of the Division of
Communicable Disease Control and Environmental Health at the MoH oversees the NIP and
performs forecasting and planning for vaccine procurement using the Comprehensive Multi-
Year Plan on Immunization (cMYP). This planning informs the MoH’s negotiation with
Bappenas. The cMYP, though required for Gavi beneficiaries, and a useful forecasting and
budgeting tool, has little weight in allocations of funding to the immunization program.
73 Gavi (February 2016).
74 WHO (2016).
| 21Figure 10. Who Pays for Immunization?
ACTORS.
ALLOCATION.
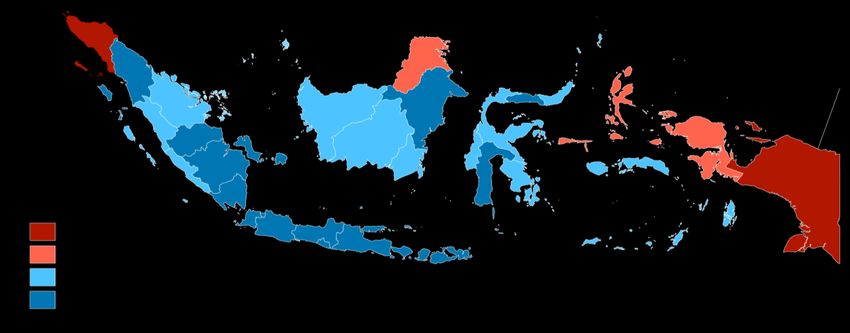
Purchasing for public immunization services is carried out by three main actors: the
Ministry of Health, district governments, and JKN (Figure 10). A recent 2017 immunization
regulation has altered financing flows, placing more responsibilities on local governments.
Previously, the MoH was responsible for the majority of expenditure, covering the costs of
procuring vaccines for the NIP, the majority of NIP personnel costs through civil servant
salaries, co-financing for new vaccines, and cold chain and logistics costs. It was estimated
| 22that about 60% of routine immunization expenditures are sourced from the central
government, and 40% from local governments.75 Under the new regulation, the MoH will be
aim to solely be responsible for vaccine procurement – local procurement is not allowed.76
The MoH can still transfer central funds to districts for specific activities, like supplementary
campaigns or cold chain updates, through earmarked DAK (Dana Alokasi Khusus) transfers.
JKN funds for immunization services are under a capitation payment for primary care.
Payments are based, in part, on the achievement of a set of quality indicators (funds can be
withheld if they are not met), but the current indicators are very high level and could
potentially be altered to focus on specific program achievements like coverage rates. These
funds are transferred to facilities through district governments and can then be used at the
facility level – 60% for staff incentives and 40% for other operational needs. Promotion of
immunization and other preventative services by the JKN mechanism’s purchaser – BPJS –
would not only be beneficial to the population, but could cut down on the cost curative care
that they cover.
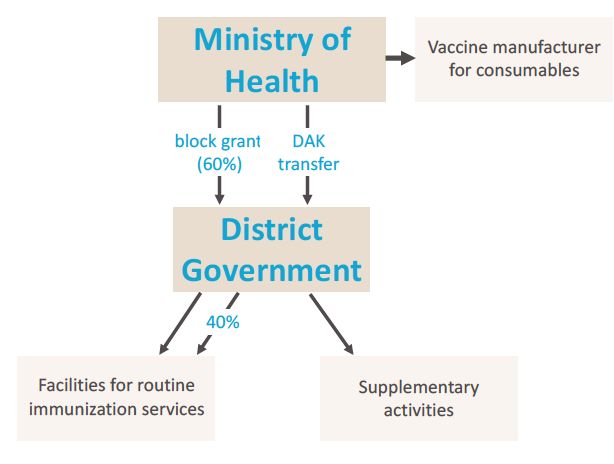
Figure 11. Local Budget Source Revenue
Central
Government
Earmarked
Local
Transfer (DAK)
Revenue
6%
11%
Other Sources
16%
Provincial Central
Government Government
Transfer Block Transfer
13% 54%
Source: World Bank (2016).
JKN’s high deficits offer an unclear future for how pooled resources will cover
immunization services. After two years of operation, BPJS, was running a US$1.48 billion
deficit.77 Estimates released in 2015 predicted an accumulated deficit of US$12.9 billion by
2019.78 BPJS’s financial woes have incited discussion of premium hikes. Thus, there is
concern that the government’s strategy of trying to raise additional revenues from
premiums could replicate an approach that has met with limited success in many other
countries, where efforts to enroll and garner premiums from informal workers have proven
problematic.79 There is relatively high coverage of low- and high-income groups in JKN –
those covered for free as “poor” or “near-poor” and those automatically enrolled as salaried
workers in the private sector.80 However, the large informal economy makes it hard to target
non-poor informal sector workers since they are not salaried employees. Nearly 60% of the
75 World Bank (2016).
76 Ministry of Health, Republic of Indonesia (2017).
77 Effendy, R (November 24, 2016).
78
Jong, H.N (July 22, 2015).
79 Joint Learning Network for Universal Health Coverage (July, 2015).
80 BPJS Kesehatan (2017).
| 23employed population is classified as non-salaried.81 Few non-poor informal workers have
enrolled in JKN, which limits the pool of premium paying beneficiaries and threatens the
sustainability of the scheme.82
Local budgets could also be used to inject more financing into health, but most local
governments miss their health allocation target and fail to execute their entire budget.
Districts raise 11% of their own budgets and receive 54% from the central government, 13%
from the provincial government, and 16% from other sources, including grants and loans
(Figure 11).83 Studies have determined that almost half of the districts failed to meet their
health allocation target of 10%, with 61% not even reaching 5% allocation.84 Districts have
been noted to illegally include JKN capitation payments and salary payments towards their
mandated 10%. Despite this, many still fall short and in the process, displace funding for
immunization. To balance any shortcoming, the central government can use DAK transfers,
or earmarked budgets, for certain social programs, including health. In 2015, DAKs for health
amounted to about 6% of district budgets.85 While central MoH’s absorptive capacity is high
(96% in 2015), budget execution at the district level is low.86 Funds remain unspent at the
end of the year due to a variety of reasons, including weak coordination and delays in
translating the allocated budget into activities.87 Thus, efforts at the central level to improve
immunization coverage and coordinate delivery often fall flat at the sub-national level
resulting in varying financing levels, demand, and delivery for immunization.
Indonesia’s expenditure on health – both total spending and government spending – has
risen over the past few years, but remains low compared to the regional and global trends.
Health spending is far below that of other countries at the same income level and of
countries in the region. THE in 2014 comprised 2.8% of GDP, with public health expenditure
1.1% of GDP.88 Comparatively, lower-middle income countries on average spent 5.9% of GDP
on health, with 3.3% of GDP from public expenditure.89 Countries in the Southeast Asia
region spent 6.6% of GDP on health, with 5.0% of GDP from public expenditure.90 Nearly
70% of the central budget is allocated to public services (primarily water and irrigation
management) and the economy (inclusive of infrastructure development and land
management). While education received almost 12% of the budget in 2015, the health
sector received less than 2%.91 This is far below the 5% of the budget that the central
government is mandated to put towards health. It has been noted by Bappenas that this
percentage has since risen to meet the mandate. In 2015, 3% of the health budget was spent
on the immunization program.
Expenditures on immunization are projected to increase to respond to growing needs in
the system and growing demands from the people. Indonesia’s estimated resource needs
for the immunization program for 2015-2019 were US$1,374.5 million, with a gap of
US$227.4 million beyond secured funding of US$1,147.1 million (Figure 13).92 As mentioned
81 World Bank (2017b).
82
World Bank (2016).
83 Ibid.
84 World Bank (2017a); World Bank (2016).
85 Republic of Indonesia, Directorate of Budget Preparation (2014).
86 Republic of Indonesia, Directorate of Budget Preparation (2014).; World Bank (2016).
87 Gavi (February, 2016).
88 WHO (2017a).; World Bank (2017b).
89 World Bank (2017b).
90
Ibid.
91 Republic of Indonesia, Ministry of Finance (May, 2016).
92 Directorate General of Disease Control (2015).
| 24above, birth cohorts are expected to shrink through 2030. As such, the financing
requirement for the current immunization schedule will decline, but the new vaccines
introduced and efforts to increase coverage, will require additional resources. External
financing is supporting a number of immunization pilots and introductions – programs that
will need to be taken on by the government over time.
Figure 13. Total Funding Needed for 2015-2019 Immunization Program
17%
83%
Secured Funding Gap in Funding
Source: Directorate General of Disease Control (2015).
Additional resources for immunization are needed to cover the gap left by Gavi, widen the
scope, and increase coverage of the program, but many tools are benefitting advocacy for
this change. The availability of catalytic funding from Gavi to introduce new vaccines is
supporting the idea among Indonesian decision makers. The roll-out of JKN also offers
increased access to services that could have tangential benefits for immunization demand.
Some concerns do exist, including being overextended on financing commitments when Gavi
funds leave, safety issues following the fraudulent vaccine scandal, difficulty reaching rural
or remote communities with poor cold chains and shortages of health workers, the high cost
of NUVIs, and the limited data and accountability to incentivize progress. These concerns are
all very real, but will not stem the tide that continues to move vaccine introduction and
immunization expansion forward.
NEW AND UNDERUTILIZED VACCINES SCALE UP IN COUNTRY
The Indonesian Technical Advisory Group on Immunization, the Directorate General for
Disease Control and Prevention, and the National Agency of Drug and Food Control are the
main decision makers for introducing new vaccines. The ITAGI plays a significant role in this
process, both advising the government on new introductions and assisting in producing
evidence based decisions.93 WHO position papers, the burden of disease, and pilot programs
play a large part in recommendations, but the data used is often from other regional players,
not primary local research.94 There are individual working groups within the ITAGI that look
at new vaccines of interest. The ITAGI makes introduction recommendations to the
Directorate General for Disease Control and Prevention in the Center for Disease Control in
the MoH who then, given secured financing, makes the recommendation to the National
Agency of Drug and Food Control (NADFC), Indonesia’s national regulation authority. NADFC,
93
ITAGI members: recognized experts in the fields of pediatrics, infectious diseases, immunology, medical microbiology,
internal medicine, health economics, and epidemiology. (Hadinegoro et. al, 2011.)
94 Slamet, L. (2010).
| 25ensures the quality of products before they enter the public system and advises on new
technology’s introduction into the NIP.
Table 3. Decision-Makers in the Indonesian Immunization Program
Actor Role
ITAGI Gathers evidence for NUVI recommendations
ITAGI Recommends vaccines for introduction
MoH Decides on vaccine introduction to the NIP
Decides on vaccine introduction to private
Individual facility management
facilities
District & Provincial NIP managers, Immunization & Prepares the immunization budget and designs
Quarantine Directorate in DDC at the MoH program
Approves the immunization program and
Parliament
introduction budgets
BINFAR Procures vaccines
Local governments Funds immunization program management
NADFC Performs quality assurance
DHOs Implement immunization programs
Public and private facilities Delivers immunization services
Procurement and distribution are carried out
centrally through an exclusive contract with the Box 2. Example of introduction of Td
national pharmaceutical manufacturer PT vaccine process:
Biofarma. Vaccine procurement is done through by
the Directorate General of Pharmaceuticals and 1 CDC reported an outbreak of diphtheria
Medical Devices (BINFAR), after which MoH to the ITAGI
distributes vaccines to provinces. 95 National policy 2 ITAGI reviewed the data
requires that state-owned PT Biofarma supply all 3 ITAGI asked Biofarma what their
government-procured vaccines for the NIP, production capacity for Td vaccine
although exceptions to this rule are allowed if PT
4 Biofarma increased Td production
Biofarma does not have the production capacity capacity and registered with the NRA
for a new vaccine. They can also act as a filler,
5 The NRA approved Biofarma’s Td
receiving products from external companies, then
registration
packaging and branding the products locally for
sale to the MoH. Typically, at the province and 6 The ITAGI updated their
district level, there are two designated recommendations for the use of Td in
school children and for outbreak
management personnel, one is responsible for
response strategies to the CDC
program management, and the other is
responsible for cold chain, vaccine, and logistics Slamet, November 30, 2010.
management.
The financial planning process is done jointly by the MoH, provincial health offices, and
district health offices. The MoH, with guidance from the Department of Disease Control
(DDC) and the ITAGI, executes immunization program forecasting and planning for
procurement through its National Immunization Program (NIP). The budget is built from
internal work plans and a centrally developed cMYP. Every district and province, as well as
the MoH, have an immunization plan and budget within their larger health plan. The
95 Gavi (February, 2016).
| 26You can also read