Taxes Paid: Our Economic Contribution 2021 - Rio Tinto
←
→
Page content transcription
If your browser does not render page correctly, please read the page content below
Taxes Paid: Our Economic Contribution 2021

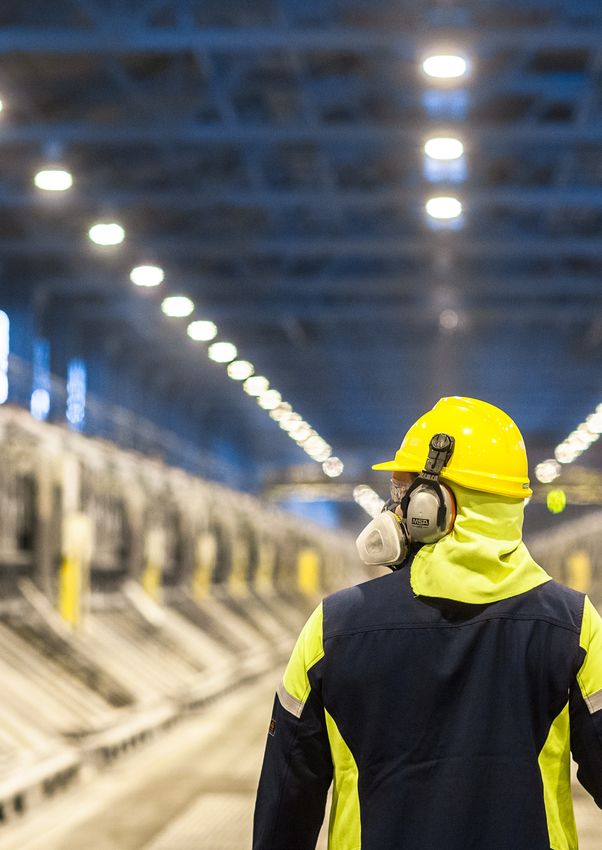
Contents

Global overview                                                        1
Foreword from our Chief Financial Officer                              2
Our direct economic contribution                                       4
Australia                                                              6
Canada                                                                 8
Mongolia                                                              10
United States                                                         12
South America                                                         14
Africa                                                                16
Europe                                                                18
Analysis by country and level of government                           21
Tax and other payments to governments                                 24
made on a project-by-project basis
Reconciliation of accounting profit, tax charge, corporate            25
income tax paid and royalties
Payments to governments and the mining life cycle                    26
Our commitment to transparency and responsible tax                    27
principles
Our approach to tax                                                  29
Independent auditor’s report                                          34
Appendix 1: Basis of preparation                                     36
Appendix 2: Glossary of terms                                        38

Cover | Employee mentoring students at Western Cape College. Weipa, Australia

The photography in this report may not reflect the COVID-19 regulations in place on site at the time of publication.

Taxes Paid: Our Economic Contribution 2021 | riotinto.com
Total global taxes and
                                 royalties paid in 2021

                                 $13.3bn
                                 (2020: $8.4bn)

                                 Australia

                                 $11.1bn
                                 (2020: $6.8bn)

                                 Canada                            Chile

                                 $855m $562m
                                 (2020: $651m)                     (2020: $246m)

                                 Mongolia                          United States

Gudai-Darri, iron ore project.
                                 $544m $81m
The Pilbara, Western Australia   (2020: $277m)                     (2020: $111m)

                                            Taxes Paid: Our Economic Contribution 2021 | riotinto.com   1
Foreword from our Chief Financial Officer

An important economic contribution
2021 was another challenging year as the COVID-19 pandemic continued to bring
human tragedy and cause economic disruption. It is a credit to our people and partners
that we have managed to keep our operations running safely despite these challenges.
We acknowledge the support of our host governments and                         We continue to believe in the importance of stable and effective
communities in helping us keep our sites operating at a time when              tax systems which support long-term capital investment and ensure
many other industries were heavily constrained. This enabled us to             companies make an appropriate contribution, where value is added.
protect jobs, support local businesses, and produce record financial           We are proud of the economic contribution we make in our host
results. It also resulted in us paying substantial taxes and royalties         countries through taxation and royalties, and we support the work
to the governments where we operate.                                           being undertaken by the Organisation for Economic Co-operation
                                                                               and Development (OECD) to protect the taxing rights of host
Our total direct economic contribution in 2021 was $66.6 billion.              governments in respect of extractive activities.
Our economic contribution to governments and communities plays
a critical role in the economic health and development of the regions          We believe it is essential to building trust to have a consistent
where we operate, from Mongolia to Madagascar. The funds                       standard against which companies can report their tax contributions.
governments and communities receive support the basic infrastructure           We support and are committed to reporting the full requirements of the
of society – bridges and roads, schools and hospitals – as well as other       Tax Standard (GRI 207) of the Global Sustainability Standards Board
local development priorities, including job creation and skills training.      of the Global Reporting Initiative (GRI), which includes full country-by-
                                                                               country reporting. This report, coupled with our Country-by-Country
In 2021 we paid $13.3 billion of taxes and royalties globally. In Australia,   Report, meets the comprehensive requirements of GRI 207.
we are one of the largest taxpayers and paid $11.1 billion (A$14.8 billion)
in taxes and royalties in 2021, up from $6.8 billion (A$9.8 billion) the       This report, alongside our Annual Report and Climate Change
previous year. Over the past ten years we have paid $73.9 billion in           Report, also enables our stakeholders to understand and evaluate
taxes and royalties globally, of which 78%, or $58.0 billion                   the lasting, positive impact our company strives to have.
(A$72.8 billion), was paid in Australia.
                                                                               We welcome your feedback.
We have supported increasing transparency for over a decade
because it encourages accountability – ours as well as others’ –
and we are committed to continuing to play a leadership role. Being            Peter Cunningham
open and transparent about our taxes and royalty payments, mineral             Chief Financial Officer
development contracts, beneficial ownership and our stance on
a range of other sustainability issues allows us to enter into open,           April 2022
fact-based conversations with our stakeholders. Being transparent
about where our payments go helps stakeholders better understand
how these funds are used.

2    Taxes Paid: Our Economic Contribution 2021 | riotinto.com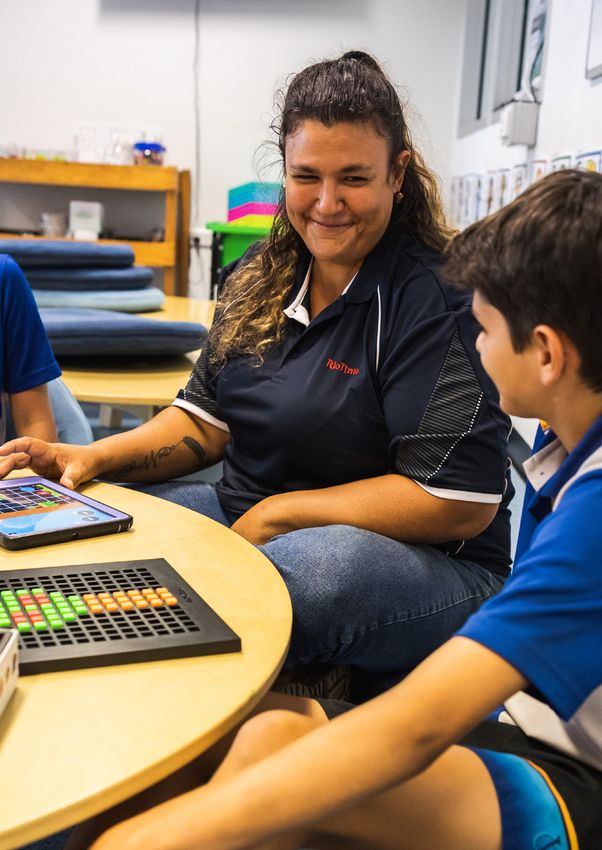
The funds governments
and communities receive
support the basic
infrastructure of society
– bridges and roads,
schools and hospitals –
as well as other local
development priorities,
including job creation
and skills training.

                   Peter Cunningham
                   Chief Financial Officer

               Taxes Paid: Our Economic Contribution 2021 | riotinto.com   3
Our direct economic contribution

     Working with
     shared purpose

     We must ensure all our stakeholders benefit from the success of Rio Tinto.
     To do this, it is essential that we care for our employees, respect and safeguard
     the environment when we explore, build and operate, and repurpose or
     rehabilitate the land when our operations come to an end.
     We work hard to leave a lasting, positive legacy everywhere we     landowners and community investments. Catalysing economic
     work. Our long-term economic contribution is one way we do this.   opportunities for our host communities and regions continues
     In 2021, our direct economic contribution was $66.6 billion,       to be a priority and engaging with local suppliers is an important
     including the total value of operating costs, employee wages       way in which we can have a positive impact in the communities
     and benefits, payments to providers of capital, payments           where we operate. We strive to employ local people, buy local
     to governments, development contributions, payments to             products and engage local services.

     $13.3bn                                                            $11.1bn
     Global taxes and royalties paid in 2021                            Australian taxes and royalties paid in 2021

     $73.9bn                                                            $58.0bn
     Global taxes and royalties paid in the last ten years              Australian taxes and royalties paid in the last ten years

     Group effective                         Group effective            Australian effective                Australian effective
     corporate income tax                    income tax and royalty     corporate income tax                income tax and royalty
     rate on underlying                      rate on underlying         rate on underlying                  rate on underlying
     earnings in 2021                        earnings in 2021           earnings in 2021                    earnings in 2021

     28.0%                                   34.6%                      30.1%                               37.4%

4   Taxes Paid: Our Economic Contribution 2021 | riotinto.com
Iron Ore Company of Canada operations, Canada

Group effective corporate income tax rate                                                          2021 direct economic contribution globally
on underlying earnings
2017
                                                                                      28.2%
2018
                                                                                      28.6%
2019
                                                                                      30.2%
2020
                                                                                      29.5%
2021
                                                                                      28.0%
Average (2017 — 2021)
                                                                                      28.9%

                                                                                                                                $66.6bn
Australian effective corporate income tax rate
on underlying earnings
2017
                                                                                      30.5%
2018
                                                                                      30.7%
2019
                                                                                       31.1%
2020
                                                                                       31.7%
2021
                                                                                       30.1%
Average (2017 — 2021)                                                                                                Payments to suppliers                         30%
                                                                                      30.8%
                                                                                                                     Reinvested                                    19%
                                                                                                                     Payables to governments2                      19%
Direct economic contribution                                                                                         Dividends and finance items                   23%
since 2017 – $251bn                                                                                                  Salaries                                        8%
2017                                                                                                                 Non-government royalties and other              1%
                                                                                    $44.2bn1
2018
                                                                                     $47.7bn1
2019
                                                                                    $45.1bn

                                                                                                                       $19.4bn
2020
                                                                                     $47.0bn
2021
                                                                                    $66.6bn

                                                                                                                       Paid to suppliers globally in 2021

1.   Includes contribution from net gains on disposal of interests in businesses.
2.   Payables to governments includes charges for corporate income tax, government royalties, employer payroll taxes and other tax charges.
3.   More information can be found on the RT Sustainability Fact Book on the Rio Tinto website.

                                                                                                                       Taxes Paid: Our Economic Contribution 2021 | riotinto.com   5
Australia
Australia is where almost half of our assets are based and
where more than 21,000 of our employees live. In 2021,
we were one of Australia’s largest taxpayers, contributing
$11.1 billion (A$14.8 billion) in taxes and royalties.

Australia is home to our largest operational footprint. From Bell Bay,        We know there is more we need to do to be better custodians,
Tasmania to Karratha, Western Australia and Weipa, Queensland, we             neighbours and partners in Australia and beyond. In 2021, we
have aluminium smelters, alumina refineries and iron ore, bauxite and         appointed Kellie Parker as our new Chief Executive, Australia, to help
salt operations across the country. Over the past ten years, we have          us rebuild trust and strengthen our relationships across Australia.
paid $73.9 billion in taxes and royalties globally, of which 78%, or          In September 2021, we published an interim report on our communities
$58.0 billion (A$72.8 billion), was paid in Australia.                        and social performance commitments, as we continue to implement
                                                                              the recommendations arising from the Juukan Gorge tragedy.
We are committed to decarbonise our business. For example,                    As part of the commitments, we have redesigned our planning and
in the Pilbara we aim to deploy one gigawatt of renewable electricity         operational practices to protect heritage sites, while modernising
to power our mining operations. This includes the construction of a           and strengthening our agreements with Traditional Owners. To ensure
34MW solar plant at the Gudai-Darri mine which is expected to come            Indigenous peoples have a stronger voice in the business, we are
online in 2022.                                                               investing $50 million over five years to attract, retain and grow
                                                                              Indigenous professionals and leaders. So far, we have increased the
In Queensland, we have signed a statement of co-operation with
                                                                              number of Australian Indigenous leaders in our business fivefold since
the Queensland Government, agreeing to work together to help the
                                                                              November 2020.
Central Queensland region decarbonise while driving employment
and economic outcomes for the State.                                          As one of Australia’s largest employers, we are committed to improving
                                                                              our workplaces and creating a safe and inclusive culture for all. In 2021,
In 2021, we announced partnerships with the Australian Renewable
                                                                              we commissioned expert and former Australian Sex Discrimination
Energy Agency to study whether hydrogen can replace natural
                                                                              Commissioner Elizabeth Broderick to conduct an independent
gas in alumina refineries to reduce emissions and with Sumitomo
                                                                              review of our workplace culture to better understand, prevent and
Corporation to study the construction of a hydrogen pilot plant
                                                                              respond to harmful behaviours across our global operations.
at one of our refineries as a step towards realising a carbon-free
                                                                              We published the findings at the beginning of 2022, including 26
aluminium supply chain.
                                                                              detailed recommendations to address the issues identified, all of
                                                                              which we will implement. This will, over time, contribute to a safer,
                                                                              more respectful and inclusive work environment.

$11.1bn                                                   $7.7bn                                          $3.1bn
Total taxes and royalties                                 Corporate income tax                            Royalties paid in Australia
paid in Australia in 2021                                 paid in Australia in 2021                       in 2021

30.1%                                                     37.4%                                           $58.0bn
Australian effective corporate                            Australian effective income                     Total taxes and royalties
income tax rate on underlying                             tax and royalty rate on underlying              paid in Australia in the
earnings in 2021                                          earnings in 2021                                last ten years

$24.5bn                                                   21,196                                          $769m
Australian pre-tax underlying                             Employees                                       Taxes collected on behalf
earnings in 2021                                                                                          of employees and remitted
                                                                                                          to Australian governments

6    Taxes Paid: Our Economic Contribution 2021 | riotinto.com
Creating mutual value
We strive to employ local people, buy local products
and engage local services. Engaging with local suppliers
is an important way in which we can have a positive
impact in the communities where we operate. In 2021,
we spent $19.4 billion with suppliers globally, including
A$9.7 billion with more than 4,000 local Australian
businesses. We also increased our spend with
Indigenous suppliers across Australia by almost
40% from 2020 to A$400 million in 2021.

In addition to the taxes and royalties we pay in Australia,
in 2021 we also invested more than $90 million in
everything from local community services to bigger
partnerships. One example is our new three-year
A$12 million partnership with Telethon aimed at improving
the health and wellbeing of children in WA. This will
include support for juvenile diabetes research, child and
adolescent mental health and funding for 65 different
community-based health and support organisations.

Tom Price, the Pilbara. Western Australia

                                                              Taxes Paid: Our Economic Contribution 2021 | riotinto.com   7
Canada
We are one of the largest mining and metals business
operating in Canada, with more than 12,000 of our employees
working at over 35 sites and operations. We undertake
exploration activities, and operate research and development
centres, port and rail facilities, and technical and sales service
centres, with hydroelectric facilities in British Columbia and
Quebec.
Our Canadian high-quality alumina refinery and smelters in                     Partnerships play an important role across our operations in Canada.
Saguenay‑Lac-Saint-Jean, Quebec and Kitimat, British Columbia                  Our ELYSIS partnership with Alcoa, supported by Apple and the
are powered entirely by clean, renewable hydropower. Our Diavik                Governments of Canada and Quebec, is scaling up a technology with
Diamond Mine in Canada produces stunning white gems, produced                  the potential to transform the aluminium industry through a significant
to the highest possible standards of safety and integrity. The site            reduction in its carbon footprint. In 2021, ELYSIS achieved a key
is home to an award-winning wind farm that has offset more than                milestone by successfully producing aluminium using carbon-free
28 million litres of diesel since its inception – prioritising environmental   smelting at the Industrial Research and Development Centre
sustainability in the way that we mine. Our titanium operations have           in Saguenay. Work is now focused on accelerating the scale-up of the
been processing ore from northern Quebec for more than 70 years.               zero carbon ELYSISTM technology towards the demonstration of even
Today, we are cracking the code on a secure supply of scandium,                larger commercial-size cells in 2023. Construction of the first
a rare earth element and important critical mineral from the waste             commercial-scale prototype cells using ELYSISTM inert anode
streams of titanium dioxide production without the need for any                technology has now begun at our Alma smelter in Saguenay–Lac-
additional mining. The Iron Ore Company of Canada (IOC) is a leading           Saint-Jean, Quebec, Canada.
producer of high-grade low-impurity iron ore concentrate and pellets,
enabling customers worldwide to operate more productively, reduce              We continue to invest in a low-carbon future, and in November 2021,
emissions and produce higher-quality steel for the modern world.               we announced an $87 million investment to increase our low-carbon
                                                                               aluminium production in Canada with 16 new smelting cells at our
In 2021, we spent a total of C$5.15 billion in Canada, including               AP60 smelter, in the Saguenay–Lac-Saint-Jean region. The project
C$1.39 billion with local suppliers. Of this, C$250 million                    is expected to be completed by the end of 2023. In July 2021,
was spent with 86 Indigenous suppliers.                                        we started operations at a new commercial scale demonstration
                                                                               plant to produce high-quality scandium oxide following a $6 million
                                                                               investment for the construction of a first module in the plant, with an
                                                                               initial capacity to produce three tonnes of scandium oxide per year,
                                                                               or approximately 20% of the current global market.

$855m                                                     $563m                                            $2.9bn
Total taxes and royalties                                 Corporate income tax                             Canadian pre-tax underlying
paid in Canada in 2021                                    paid in Canada in 2021                           earnings in 2021

$447m                                                     12,270
Taxes collected on behalf of                              Employees
employees and remitted to
Canadian governments in 2021

8    Taxes Paid: Our Economic Contribution 2021 | riotinto.com
Strengthening our partnership
with First Nations
In Canada, we continue to work with Indigenous peoples
on the implementation of agreements signed with
communities, and we are progressing discussions
on four new agreements with Indigenous communities
in Quebec, Saskatchewan and British Columbia.
We also support local communities to achieve their goals
and aspirations through social investment initiatives.
In 2021, we renewed our partnership with the Breakfast
Club of Canada with C$750,000 over three years to
provide nutritious meals to over 4,000 students in 18
Indigenous schools in British Columbia and Quebec.
We also established an institutional research structure
dedicated to the indigenisation of higher education
through a C$1.5 million partnership with Université du
Québec à Chicoutimi. The structure will be established
in collaboration with several Indigenous communities
and will focus, among other things, on training the next
generation of Indigenous scientists.
Arvida casting centre. The Saguenay, Canada
Taxes Paid: Our Economic Contribution 2021 | riotinto.com 9Mongolia
The Oyu Tolgoi copper and gold mine in the South Gobi
Desert of Mongolia is a project almost unrivalled in the
industry in its complexity and scale. When the underground
mine is fully operational, Oyu Tolgoi will be among the world’s
five largest copper mines. It is also one of the most modern,
safe, sustainable and water-efficient operations globally, with
a workforce who are more than 96% Mongolian.
Since 2010, Oyu Tolgoi has spent a total of $13.4 billion in-country, livestock health services, increase the productivity of livestock,
including $3.3 billion of taxes, fees and other payments to Mongolian encourage vegetable and dairy production, and foster new business
national and local governments. To date, it is the largest foreign development through capacity building, strengthening market linkages
investment made in Mongolia. 74% of the total spend has been with and nurturing entrepreneurial mindsets amongst local communities.
the purchase of goods and services from hundreds of Mongolian Our Oyu Tolgoi South Gobi Development Strategy will expand on
suppliers. Our South Gobi spend has grown from $0.5 million in 2010 this work over the next five years to boost local procurement
to a cumulative total of over $888 million in 2021. The value of the and employment above their current levels of 24.5% and 24.8%,
spend with national suppliers that are majority owned by Mongolian respectively. We are also focusing on building the capability of
citizens now accounts for 71% of overall operational spend, which geotechnical and mining professionals in Mongolia, and in 2021
brings the accumulative total spend with national suppliers to we committed $2.75 million to a partnership with the Mongolian
$4.1 billion since 2010. University of Science and Technology.
At Oyu Tolgoi, we are working on several initiatives to reduce energy Oyu Tolgoi LLC also makes an annual contribution of US$5 million to
consumption and introduce renewable solutions. Studies on the use the Gobi Oyu Development Support Fund (DSF), an independent fund
of solar power to provide energy to camp areas and other buildings that supports sustainable community development. Since its creation
will be initiated in 2022. In addition, the opportunity for wind-based in September 2015, the DSF has invested $33 million (including
renewable energy is being explored via a wind feasibility assessment. $5.7 million in 2021) in 250 sustainable development projects and
programmes, which have resulted in the creation of more than 484
We aim to have a positive impact on the communities surrounding permanent jobs, and scholarships for 234 students, among many
the mine, including partner communities. We support herders’ other achievements.
cooperatives and work with local subject matter experts to improve
$544m 1
$365m $179m
Total taxes and royalties Taxes and royalties paid to the Total taxes paid to the regional
paid in Mongolia in 2021 Mongolian national Government governments
including royalties of $125m
$13.4bn $3.3bn $507m
Invested in Mongolia between Total taxes and royalties paid in Mongolian pre-tax underlying
2010 and 2021 Mongolia since 2010 earnings in 2021
3,513 $24m
Employees Taxes collected on behalf of
employees and remitted to
Mongolian governments in 2021
1. Includes $236 million of the total $356 million paid to the Mongolian government in respect of disputed tax assessments, the remainder of which was levied as disputed interest and penalties.
Refer to page 33 for further details.
10 Taxes Paid: Our Economic Contribution 2021 | riotinto.comIncreasing the value that Oyu Tolgoi
delivers for Mongolia
In January 2022, Rio Tinto, Turquoise Hill Resources
(TRQ) and the Government of Mongolia reached
an agreement to move the Oyu Tolgoi project forward,
while resetting the relationship between the partners
and increasing the value the project delivers
for Mongolia.
As part of a comprehensive package, Turquoise Hill
Resources (TRQ) agreed to waive in full, funding
balances arising from a carry account loan with
Erdenes Oyu Tolgoi (EOT) of $2.4 billion, comprising
the amount of common share investments in
Oyu Tolgoi LLC funded by TRQ on behalf of EOT
to build the project to date, plus accrued interest.
The Oyu Tolgoi Board has since approved
commencement of underground operations,
unlocking the most valuable part of the mine,
with first sustainable production expected in
the first half of 2023.
Oyu Tolgoi copper and gold mine.
South Gobi Desert, Mongolia
Taxes Paid: Our Economic Contribution 2021 | riotinto.com 11United States
Kennecott, our operation based in Salt Lake City, Utah,
is one of only two copper smelters in the US and delivers
nearly 20% of US copper production. It is one of the world’s
largest open pit mines in operation. Our borates business
in California, U.S. Borax, supplies almost 30% of the global
demand for borates. It is used in everything from agriculture
to fibreglass insulation and in materials for renewable
energy – for both wind and solar projects.
In 2021, we paid $81 million in taxes and royalties in the US. In Arizona, the proposed Resolution Copper project continues
to progress through comprehensive and independent social and
The transition to a lower-carbon world offers us opportunities to grow environmental regulatory reviews. Resolution has the potential to
our business and in 2021, we continued to innovate and invest for supply up to 25% of US copper demand, and create several thousand
future growth in the US. direct and indirect jobs, with an economic value of approximately
$1 billion annually over the estimated mine life. We continue to build
To meet the growing demand for boron and zinc in fertilisation
relationships with impacted communities and Native American tribes,
programmes, U.S. Borax launched two new products – AnhyborTM
while we take into consideration their concerns.
and ZincuborTM – to help farmers and fertiliser manufacturers unlock
crop potential. We have been advancing our consultation and partnerships with
neighbouring communities and Native American tribes throughout
At Kennecott, we received approval for a 30MW solar power plant
2021. Of particular note is our partnership with Western Apache tribes
to be constructed in two phases: 5MW to be completed by 2023,
and the US Forest Service to implement the Emory Oak Collaborative
expanding to 30MW by 2025. We are also updating eight haul trucks
Tribal Restoration Initiative, centred on advancing Indigenous
with lower emission engines, as well as conducting a trial to understand
Traditional Ecological Knowledge.
the potential for using renewable diesel, for completion in 2022.
$81m $44m $512m
Total taxes and royalties paid Taxes paid to Salt Lake County, US pre-tax underlying earnings
in the US in 2021 Utah in 2021 in 2021
$(32)m 3,471 $96m
Corporate income tax refund Employees Taxes collected on behalf of
received in the US in 2021 (in employees and remitted to US
respect of prior years) state and federal agencies in 2021
12 Taxes Paid: Our Economic Contribution 2021 | riotinto.comInvesting in our communities
We continue to invest in host communities – not only
through the taxes and royalties we pay, but also through
the support we provide for communities. In 2021,
Resolution Copper invested nearly $2.3 million through
partnerships and donations to projects with Native
American tribes and other communities in the Copper
Corridor. Some of the initiatives included:
– Providing clean drinking water through a project
with Stantec and White Mountain Apache community
members. We provided 64 hydropanels on the
Fort Apache Reservation and supported hydropanel
installation programmes in other Native American
communities.
– Supporting the Indigenous Studies Programme with
the Northern Arizona University Foundation and
providing 14 scholarships to local students.
– Providing aid to communities and Native American
tribes affected by the Telegraph and Mescal wildfires.
Kennecott copper mine. Utah, US
Taxes Paid: Our Economic Contribution 2021 | riotinto.com 13South America
We have interests in three non-managed operations in South
America – in Chile and Brazil. These operations provide local
jobs, and our taxes to governments assist in funding critical
infrastructure such as hospitals, schools and roads.
In 2021, we paid $584 million in taxes and royalties in
South America.
We own a 30% share in Escondida, in northern Chile, the world’s The Mineração Rio do Norte (MRN) mine complex in Porto Trombetas,
largest copper mine. It produces approximately 1.1 million tonnes of northern Brazil opened in 1979. Today, it is Brazil’s largest bauxite mine,
copper a year. Chile has set a power policy target (Energia 2025) for and in 2021 it produced approximately 12.6 million tonnes of bauxite.
20% of all Chilean energy to come from renewable sources by 2025. MRN is a joint venture, with 12% owned by Rio Tinto.
By tapping into Chile’s rich solar and wind resources, Escondida is on
track to use 100% renewable electricity supply by the mid-2020s.
Alumar – the alumina refinery, in São Luís, Maranhão, north-east
Brazil – started operations in 1984 and has been an important
economic driver in the region ever since. The Alumar refinery is a joint
venture, with 10% owned by Rio Tinto and the remaining 90% owned
by Alcoa and South32, and is operated by Alcoa.
$584m $562m $9m
Total taxes and royalties paid Total taxes and royalties paid Total taxes and royalties paid
in South America in 2021 in Chile in 2021 in Brazil in 2021
$13m $1,594m 1,566
Total taxes and royalties paid South America pre-tax underlying Employees (including equity
in Peru in 2021 earnings in 2021 (including equity accounted units)
accounted units)
$25m
Taxes collected on behalf of
employees and remitted to South
American governments in 2021
14 Taxes Paid: Our Economic Contribution 2021 | riotinto.comSupporting our commitment to the
battery materials sector
In December 2021, we entered into a binding agreement
to acquire the Rincon lithium project in Argentina,
demonstrating our commitment to build our battery
materials business and strengthen our portfolio for the
global energy transition. Located in the heart of the
lithium triangle in the Salta Province, Rincon is a long-life,
scaleable resource capable of producing battery-grade
lithium carbonate. It also has the potential to have one
of the lowest carbon footprints in the industry that can
help deliver on our commitment to decarbonise our
portfolio. The transaction was completed in March 2022,
following approval from Australia’s Foreign Investment
Review Board.
Photo provided by Escondida copper mine, Chile
Taxes Paid: Our Economic Contribution 2021 | riotinto.com 15Africa
Our operations in Africa include mines, refineries and
processing plants and we also conduct exploration activities
across the continent. We have mineral sands operations
in South Africa and Madagascar, while in Guinea, we have
an iron ore project and a non-managed interest in a bauxite
mine. We also have a heavy mineral sands project in
Mozambique. In 2021, we paid tax in South Africa,
Guinea and Madagascar.
Our Richards Bay Minerals (RBM) operation is a world leader in heavy Our Simandou iron ore joint-venture project in Guinea is the largest
mineral sands extraction and refining and is South Africa’s largest known undeveloped high-grade iron ore deposit in the world.
mineral sands producer. We have 5,429 employees and contractors With an increasing focus on emissions and decarbonisation across
working at RBM and we have been operating here for more than the global steel industry, demand for high-grade ores is expected
40 years. In 2021, RBM contributed R340 million through corporate to continue to grow. We remain committed to the development of
income tax and royalties, and R27.7 million in community investment. Simandou, while delivering benefits to our partners, local
communities and the people of Guinea.
QIT Madagascar Minerals (QMM), in the Anosy region of Madagascar,
produces ilmenite, which is a major source of titanium dioxide, We engage with stakeholders and local communities in Guinea
predominantly used as a white pigment in products such as paints to deliver a range of economic development and community health
and paper. QMM has invested $1 billion in Madagascar since 2005, initiatives including COVID-19 and Ebola response programmes.
with $350 million invested in building shared infrastructure through We are also working with communities to help them prepare for
public-private partnerships. In 2021, 98% of the workforce was future operations, identify and manage our impacts, and design
Malagasy. We invest $2.5 million each year in the environment and deliver regional and local economic development programmes.
and the community, including education, health and small We are engaging with other mining projects in Guinea to discuss
business development. the potential for enhancing offset options, as well as supporting
the Centre Forestier N’Zérékoré and Pic de Fon Classified Forest
management committee.
$55m $46m $89m
Total taxes and royalties paid in Corporate income tax paid Africa pre-tax underlying earnings
Africa in 2021 in Africa in 2021 in 2021 (including equity
accounted units)
$25m 3,558 $31m
Total taxes and royalties paid in Employees (including equity The amount of taxes collected
South Africa in 2021 accounted units) on behalf of employees and
remitted to governments of
four countries in Africa in 2021
16 Taxes Paid: Our Economic Contribution 2021 | riotinto.comInvesting in clean energy infrastructure
We believe we have an important role to play in ensuring
that the green energy transition is progressed in a fair
and socially inclusive way.
In 2021, QIT Madagascar Minerals (QMM) and its
partners laid the foundation stone for a new solar
and wind energy plant. The plant will consist of over
18,000 solar panels and four wind turbines. In addition
to allowing Rio Tinto’s operations in Madagascar to
reach carbon neutrality by 2023, this clean energy will
replace the majority of the electricity currently supplied
to the town of Fort Dauphin and its 80,000 community
members. QMM and its partners are also working with
local authorities to develop manufacturing capacity to
produce equipment for the renewable industry locally.
Richards Bay Minerals (RBM), South Africa
Taxes Paid: Our Economic Contribution 2021 | riotinto.com 17Europe
Our history in Europe stretches back to our founding in 1873:
our first mines were along the banks of the Rio Tinto in
Andalusia, Spain. Today, we have operations and legacy sites
across Europe, and our global headquarters are in London.
We continue to invest in Europe, with a focus on commodities and At the Jadar lithium-borates project in Serbia, we committed
partnerships that enable the energy transition. $2.4 billion of funding in July 2021, subject to receiving all relevant
approvals, permits and licences. In January 2022, the Government
We are investing in battery manufacturer InoBat Auto to support the of Serbia cancelled the Spatial Plan for the Jadar project. We are
development of a battery ecosystem in Europe, one of the world’s continuing to review the legal basis of the decision and the
largest and most rapidly growing electric vehicle (EV) markets. InoBat is implications for our activities and people in Serbia.
a European-based battery technology and manufacturing company
with a battery research and development centre and pilot battery line In Iceland, we operate the ISAL aluminium smelter where we
under development in Voderady, Slovakia. Our investment follows a produce some of the highest-quality, lowest carbon footprint
memorandum of understanding (MoU) signed with InoBat in May 2021, aluminium in the world, employing more than 500 workers on site.
to help fund and complete this facility. In our MoU, we have agreed to In 2021, we launched a partnership with Carbfix to capture carbon
work together to progress the establishment of a “cradle-to-cradle” and permanently store it under land surrounding the ISAL smelter.
EV battery value chain in Europe – covering the full commodity The Coda Terminal is the world’s first carbon mineral storage hub.
lifecycle from mining through to recycling of lithium. Liquified CO2 will be captured from European industrial plants’
emissions and transported to Iceland by specifically designed
ships operating on sustainable fuel.
$61m $6m $41m
Total taxes and royalties paid in Corporate income tax paid in Employer payroll tax paid
Europe in 2021 Europe in 2021 in Europe in 2021
$(21)m 1,173 $75m
Europe pre-tax underlying Employees Taxes collected on behalf of
loss in 2021 employees and remitted to
European governments in 2021
We pay tax in 11 European countries:
– Belgium – Germany – Serbia
– Finland – Iceland – Spain
– France – Luxembourg – Switzerland
– Netherlands – UK
18 Taxes Paid: Our Economic Contribution 2021 | riotinto.comISAL aluminium smelter, Iceland
Taxes Paid: Our Economic Contribution 2021 | riotinto.com 19Analysis by country and level of government 21 Tax and other payments to governments made on a 24 project-by-project basis Reconciliation of accounting profit, tax charge, corporate 25 income tax paid and royalties Payments to governments and the mining life cycle 26 Our commitment to transparency and responsible tax 27 principles Our approach to tax 29 Independent auditor’s report 34 Appendix 1: Basis of preparation 36 Appendix 2: Glossary of terms 38 20 Taxes Paid: Our Economic Contribution 2021 | riotinto.com
Analysis by country and level of government
This table shows the total of all tax and other payments to governments for every country where the Rio Tinto Group paid at least $100,000 in 2021.
We do not earn any significant profit in countries not listed in this table.
Within each country, total tax payments (net of refunds) are reported by the national, regional, or local government to which they are paid.
The analysis by country and level of government is prepared in accordance with the basis of preparation in Appendix 1.
Fees, dividends
and other Total
Corporate Government extractive related Employer payroll Other taxes and tax payments Employee
Country and level of government ($US millions) income tax royalties payments taxes payments borne payroll taxes
Australia Total 7,716.0 3,069.3 11.7 218.4 77.3 11,092.7 768.8
Australian Taxation Office 7,716.0 3.3 – 50.7 9.4 7,779.4 768.8
State of Western Australia – 2,959.6 2.6 125.0 41.8 3,129.0 –
State of Queensland – 68.8 1.6 31.3 5.1 106.8 –
Northern Territory Revenue Office – 37.6 7.5 4.4 0.3 49.8 –
State of Tasmania – – – 3.0 0.1 3.1 –
State of New South Wales – – – 2.6 – 2.6 –
State of Victoria – – – 1.4 0.3 1.7 –
Shire of Ashburton (WA) – – – – 6.0 6.0 –
Gladstone Regional Council (QLD) – – – – 5.0 5.0 –
City of Karratha (WA) – – – – 4.4 4.4 –
West Arnhem Shire Council (NT) – – – – 1.4 1.4 –
Weipa Town Authority (QLD) – – – – 1.3 1.3 –
Shire of East Pilbara (WA) – – – – 1.1 1.1 –
Cook Shire Council (QLD) – – – – 0.5 0.5 –
George Town Council (TAS) – – – – 0.2 0.2 –
Town of Port Hedland (WA) – – – – 0.2 0.2 –
Other Australian Governments – – – – 0.2 0.2 –
Canada Total 562.7 64.9 14.4 104.8 107.7 854.5 446.7
Canada Revenue Agency 487.1 – – 19.8 1.2 508.1 264.8
Revenue Québec 12.7 – – 74.7 2.5 89.9 180.6
Government of Newfoundland and Labrador 58.4 – 0.5 6.1 6.1 71.1 –
Ministre des Finances du Québec – 54.1 – – 0.9 55.0 –
Ville de Saguenay (QC) – – 0.4 – 27.5 27.9 –
Ministry of Finance of British Columbia – 10.8 – 3.3 7.6 21.7 –
District of Kitimat (BC) – – – – 19.8 19.8 –
Government of Northwest Territories 4.6 – 4.3 0.9 4.8 14.6 1.3
Ville d'Alma (QC) – – – – 9.7 9.7 –
Town of Labrador City (NL) – – – – 7.3 7.3 –
Commission Scolaire du Fer (QC) – – – – 4.2 4.2 –
Les Innus de Uashat mak Mani-utenam and Les Innus
de Matimekush-Lac John¹ – – 3.5 – – 3.5 –
Ville de Sept-Îles (QC) – – – – 3.3 3.3 –
Innu Nation (Labrador)¹ – – 2.8 – 0.4 3.2 –
MRC Maria-Chapdelaine (QC) – – – – 2.3 2.3 –
Ville de St-Joseph-de-Sorel (QC) – – – – 2.0 2.0 –
MRC du Fjord-du-Saguenay (QC) – – – – 1.5 1.5 –
Ville de Sorel-Tracy (QC) – – – – 1.1 1.1 –
Conseil des Innus de Ekuanitshit¹ – – 1.0 – 0.1 1.1 –
Ville de Bécancour (QC) – – – – 1.0 1.0 –
Municipalité de Ste-Monique de Honfleur (QC) – – – – 1.0 1.0 –
Tlicho Government¹ – – 0.9 – – 0.9 –
Municipalité de Péribonka (QC) – – – – 0.6 0.6 –
Yellowknives Dene First Nation¹ – – 0.5 – – 0.5 –
Strathcona County (AB) – – 0.2 – 0.3 0.5 –
Municipalité de Havre-St-Pierre (QC) – – – – 0.4 0.4 –
Commission Scolaire de la Jonquiére (QC) – – – – 0.4 0.4 –
Commission Scolaire du Lac-Saint-Jean (QC) – – – – 0.4 0.4 –
Commission Scolaire des Rives-du-Saguenay (QC) – – – – 0.3 0.3 –
Lutsel K'e Dene First Nation¹ – – 0.2 – – 0.2 –
Government of Alberta (0.1) – – – 0.2 0.1 –
Other Canadian Governments – – 0.1 – 0.8 0.9 –
Taxes Paid: Our Economic Contribution 2021 | riotinto.com 21Analysis by country and level of government continued
Fees, dividends
and other
extractive Total
Corporate Government related Employer Other taxes and tax payments Employee
Country and level of government ($US millions) income tax royalties payments payroll taxes payments borne payroll taxes
Chile Total 554.5 – 1.9 – 5.7 562.1 22.2
Servicio de Impuestos Internos 554.5 – 1.9 – 5.7 562.1 22.2
Mongolia Total2 0.2 124.8 14.2 24.4 380.5 544.1 23.9
General Department of Taxation 0.1 124.8 – – 240.3 365.2 –
Ulaanbaatar City 0.1 – – 24.4 75.3 99.8 13.2
Umnugovi Province – – 4.7 – 28.2 32.9 10.7
General Department of Customs – – – – 36.7 36.7 –
Gobi Oyu Development Support Fund¹ – – 5.7 – – 5.7 –
Erdenes Oyu Tolgoi LLC1 – – 2.0 – – 2.0 –
Other Mongolian Government Agencies – – 1.8 – – 1.8 –
USA Total (31.9) 17.7 53.3 27.9 13.6 80.6 96.2
Internal Revenue Service (34.5) – – 27.3 0.2 (7.0) 77.1
Salt Lake County (UT) – – 44.0 – 0.2 44.2 –
Utah State Tax Commission – 17.7 – 0.3 2.1 20.1 11.7
Kern County (CA) – – 9.3 – – 9.3 –
California Franchise Tax Board 1.5 – – 0.3 2.9 4.7 5.5
Ohio Treasurer of State 0.3 – – – 3.4 3.7 –
Pinal County (AZ) – – – – 1.1 1.1 –
Texas Department of Revenue 0.3 – – – 0.6 0.9 –
New Mexico Department of Revenue – – – – 0.7 0.7 –
Arizona Department of Revenue – – – – 0.6 0.6 0.7
Minnesota Department of Revenue – – – – 0.5 0.5 –
Los Angeles County (CA) – – – – 0.4 0.4 –
Inyo County (CA) – – – – 0.2 0.2 –
U.S. Customs and Border Protection – – – – 0.2 0.2 –
Kentucky Department of Revenue 0.1 – – – – 0.1 –
South Carolina Department of Revenue – – – – 0.1 0.1 –
Wisconsin Department of Revenue – – – – 0.1 0.1 –
Illinois Department of Revenue – – – – – – 0.7
Other US Governments 0.4 – – – 0.3 0.7 0.5
Singapore Total 28.4 – – – – 28.4 –
Inland Revenue Authority of Singapore 28.4 – – – – 28.4 –
China Total 23.1 – – 1.5 1.6 26.2 2.9
State Administration of Taxation 23.1 – – – 1.5 24.6 0.2
Shanghai Municipality – – – 1.0 – 1.0 2.2
Beijing Municipality – – – 0.5 0.1 0.6 0.5
South Africa Total 22.2 1.0 – 1.3 0.6 25.1 28.3
South African Revenue Service 22.2 1.0 – 1.3 0.6 25.1 28.3
UK Total 1.3 – – 13.7 9.1 24.1 48.2
Her Majesty's Revenue and Customs 1.3 – – 13.7 0.1 15.1 48.2
Westminster City Council – – – – 9.0 9.0 –
Guinea Total 22.7 – – – 0.1 22.8 0.6
Presidency of the Republic of Guinea 22.7 – – – 0.1 22.8 0.6
France Total – – – 14.3 (0.3) 14.0 5.2
Directorate General of Public Finance – – – – (0.3) (0.3) –
Direction Générale des Finances Publiques– Rhône-Alpes – – – 10.8 – 10.8 4.0
Union de Recouvrement des Cotisations
de Sécurité Sociale et d’Allocations Familiales – – – 3.5 – 3.5 1.2
Peru Total 0.1 – 12.2 0.9 – 13.2 1.0
The National Superintendency of Customs
and Tax Administration 0.1 – 12.2 0.9 – 13.2 1.0
Iceland Total – – 0.1 8.3 3.9 12.3 13.8
Directorate of Internal Revenue – – 0.1 8.3 3.9 12.3 13.8
Brazil Total 2.9 1.1 0.3 3.1 1.7 9.1 1.5
Federal Revenue of Brazil 2.9 1.1 0.3 3.1 1.7 9.1 1.5
22 Taxes Paid: Our Economic Contribution 2021 | riotinto.comAnalysis by country and level of government continued
Fees, dividends
and other
extractive Total
Corporate Government related Employer Other taxes and tax payments Employee
Country and level of government ($US millions) income tax royalties payments payroll taxes payments borne payroll taxes
Total Other 11.9 4.0 0.6 4.9 3.0 24.4 26.5
Madagascar – General Direction of Taxes 0.7 4.0 0.2 0.3 1.7 6.9 1.1
Oman – Ministry of Finance Secretariat General for Taxation 3.9 – – – 0.2 4.1 –
Luxembourg – Inland Revenue 2.9 – – – – 2.9 –
Netherlands Tax and Customs Administration 0.4 – – 2.2 0.1 2.7 2.5
Serbia – Tax Administration – – 0.4 0.7 0.6 1.7 1.5
Belgium – Federal Public Service Belgium 0.5 – – 0.9 – 1.4 2.3
Switzerland Federal Tax Administration 0.8 – – 0.1 0.3 1.2 0.1
Indian Tax Department 1.1 – – – – 1.1 1.6
Japan – National Tax Agency 1.0 – – – – 1.0 2.0
Germany – Federal Ministry of Finance 0.2 – – 0.3 – 0.5 1.0
Malaysia – Inland Revenue Board of Malaysia 0.4 – – – – 0.4 –
Kazakhstan – Committee of State Revenue – – – 0.2 – 0.2 0.2
New Zealand – Inland Revenue Department – – – 0.1 0.1 0.2 13.2
Finnish Tax Administration – – – 0.1 – 0.1 0.1
Zambia Revenue Authority – – – – – – 0.6
Spain – Agencia Tributaria – – – – – – 0.3
Total payments to governments 8,914.1 3,282.8 108.7 423.5 604.5 13,333.6 1,485.8
Total 2021 net refunds from governments on sales taxes, VAT, GST, excise duties, fuel credits and withholding taxes on supplier invoices not borne
by Rio Tinto were $1.5 billion. These refunds are not included in the table above.
1. Indigenous governments and other government-controlled bodies have been included to comply with extractive industry reporting requirements in the United Kingdom and Canada.
2. Includes $236 million of the total $356 million paid to the Mongolian government in respect of disputed tax assessments, the remainder of which was levied as disputed interest and penalties.
Including the full $356 million would bring the total amount of payments to Mongolian governments to $664 million for 2021. Refer to page 33 for further details.
Taxes Paid: Our Economic Contribution 2021 | riotinto.com 23Tax and other payments to governments
made on a project-by-project basis
The analysis by project is prepared in accordance with the basis of preparation in Appendix 1.
Fees, dividends Total payments
and other for report on
extractive payments to Total
Corporate Government related governments Employer Other taxes and tax payments Employee
Product group and project (US$ millions) income tax royalties payments purposes payroll taxes payments borne payroll taxes
Iron Ore 7,757.2 2,955.0 1.7 10,713.9 141.7 60.3 10,915.9 465.0
Pilbara – Australia 7,745.7 2,952.6 1.5 10,699.8 138.0 59.2 10,897.0 454.2
Dampier Salt – Australia¹ 11.5 2.4 0.2 14.1 3.7 1.1 18.9 10.8
Copper 627.7 142.5 60.2 830.4 41.1 389.9 1,261.4 99.3
Kennecott Utah Copper – USA 109.5 17.7 44.0 171.2 15.4 2.3 188.9 48.3
Oyu Tolgoi – Mongolia – 124.8 14.3 139.1 24.4 380.4 543.9 23.9
Resolution Copper – USA (13.8) – – (13.8) 1.2 1.6 (11.0) 4.3
Escondida – Chile – EAU² 554.4 – 1.9 556.3 – 5.6 561.9 22.2
Winu – Australia (22.4) – – (22.4) 0.1 – (22.3) 0.6
Minerals 398.8 9.6 24.4 432.8 51.0 32.9 516.7 244.9
Iron Ore Company of Canada³ 527.0 – 6.7 533.7 20.4 17.7 571.8 113.3
Richards Bay Minerals – South Africa 22.2 1.0 – 23.2 1.1 0.6 24.9 24.2
Rio Tinto Fer et Titane – Canada (9.8) – 1.0 (8.8) 16.9 3.9 12.0 54.8
QIT Madagascar Minerals 0.7 4.0 0.2 4.9 0.3 1.7 6.9 1.1
US Borates (1.8 ) – 9.3 7.5 6.7 3.8 18.0 21.6
Jadar – Serbia – – 0.4 0.4 0.7 0.6 1.7 1.5
Diavik – Canada 4.6 – 5.9 10.5 2.9 4.6 18.0 20.6
Argyle – Australia (144.1) 4.6 0.9 (138.6) 2.0 – (136.6) 7.8
Aluminium 42.0 107.5 9.1 158.6 14.2 7.0 179.8 37.9
Weipa including Amrun – Australia 18.9 68.8 1.6 89.3 8.6 5.6 103.5 30.5
Gove – Australia – 37.6 7.5 45.1 3.7 0.8 49.6 6.9
Sangaredi – Guinea – EAU² 22.7 – – 22.7 – – 22.7 –
Porto Trombetas – Brazil – EAU² 0.4 1.1 – 1.5 1.9 0.6 4.0 0.5
Exploration (38.4) – 12.5 (25.9) 4.4 2.8 (18.7) 17.9
Exploration – Australia (27.8) – – (27.8) 2.1 0.8 (24.9) 10.0
Exploration – Brazil 0.2 – 0.3 0.5 0.4 0.4 1.3 0.4
Exploration – Chile 0.1 – – 0.1 – 0.2 0.3 –
Exploration – Peru 0.1 – 12.2 12.3 0.9 – 13.2 1.0
Exploration – USA (11.0) – – (11.0) 0.7 1.2 (9.1) 4.5
Exploration – Other – – – – 0.3 0.2 0.5 2.0
Non-Extractive Projects 126.8 68.2 0.8 195.8 171.1 111.6 478.5 620.8
Smelting and Refineries 128.4 64.9 0.7 194.0 105.0 94.1 393.1 342.7
Commercial, Finance, Head Office
and Managed Operations (1.6) 3.3 0.1 1.8 66.1 17.5 85.4 278.1
Total payments to governments 8,914.1 3,282.8 108.7 12,305.6 423.5 604.5 13,333.6 1,485.8
1. Dampier Salt is reported within Iron Ore, reflecting management responsibility.
2. EAU: Equity accounted units will not be included in the formal UK filing of the “Reports on Payments to Governments” to be filed at Companies House.
3. Iron Ore Company of Canada is reported within Minerals, reflecting management responsibility.
24 Taxes Paid: Our Economic Contribution 2021 | riotinto.comReconciliation of accounting profit, tax charge,
corporate income tax paid and royalties
Reconciliation of 2021 accounting profit and total tax charge Reconciliation of 2021 total tax charge and current tax charge
US$ millions US$ millions
Profit before tax 30,833 Total tax charge 8,258
Less: share of profit after tax of equity accounted units (1,042) Temporary differences
29,791 Unrealised exchange losses 0
Expected tax charge at UK rate of 19% 5,660 Tax losses (375)
Higher rate of tax on Australian underlying earnings at 30% 2,693 Provisions 216
Other tax rates applicable outside the UK and Australia 110 Capital allowances (42)
Impact of items excluded from underlying earnings (a) (127) Tax on unremitted earnings (1)
Recognition of previously unrecognised deferred tax assets (212) Post-retirement benefits 21
Other items 134 Other temporary differences 67
Total tax charge 8,258 Current tax charge 8,144
(a) Impact of items excluded from underlying earnings Reconciliation of 2021 current tax charge and corporate income tax paid
US$ millions US$ millions
Impairment charges (21) 2021 Current tax charge 8,144
Exchange derivatives gains/(losses) (126) Add current tax charge of equity accounted units 673
Losses from increases to closure estimates (non-operating and 8,817
fully impaired sites) 84 Final instalment in Australia on 2020 profits paid in H1 2021 862
Utilisation of capital losses on the gain from the recognition of Final instalment in Australia on 2021 profits due in H1 2022 (1,055)
the wharf at Kitimat, Canada (64) Tax payments greater than tax charges (timing) 290
Total impact of exclusions (127) Corporate income tax paid 8,914
Reconciliation of government royalties expense to government royalties paid
US$ millions
Government royalties included in accounting profit 3,048
Difference between royalties paid and royalties accrued 235
Total government royalties paid 3,283
Effective corporate income tax rates on total earnings Profit before Total tax Effective corporate
US$ millions tax charge income tax rate (%)
Underlying earnings 30,298 (8,482) 28.0%
Exclusions from underlying earnings (507) 224 44.2%
29,791 (8,258) 27.7%
Add share of profit after tax of EAU 1,042
Total profit before tax 30,833
Taxes Paid: Our Economic Contribution 2021 | riotinto.com 25Payments to governments and the
mining life cycle
Our projects are long-term investments, and the amount
we contribute to governments varies depending on where
the project is in its life cycle.
Mining and processing, by its very nature, disturbs the environment While we are proud of the economic contribution our business makes
and can impact surrounding communities. But it also delivers to governments around the world through our taxes and royalties, we
significant economic and social benefits, including the production of also continue to work to minimise our impact on the environment and
essential materials, employment, small business development, training the Indigenous communities around our sites. By encouraging and
and skills development, and socioeconomic programmes. Through supporting investment, governments have the opportunity to support
taxes and royalties, we can also support the basic infrastructure of increasing community needs. In this way, tax policy can play an
society – bridges and roads, schools and hospitals. important role in supporting countries’ economic activity, growth
and employment.
Explore and evaluate – 10-20 years
1. Explore
The first phase of a project (before it becomes a mine) is exploration and evaluation. Payments made to governments
and evaluate during this stage usually include employment-related taxes for small project teams, as well as payments for permits,
fees and licences. Generally, no corporate taxes or royalties are paid in this phase.
Develop and innovate – Up to 10 years
2. Develop The increased expenditure created by the design and construction of a facility, as well as employment taxes
associated with the greater number of people employed to work on the project, mean there are usually more taxes
and innovate paid during a project’s second phase. Withholding taxes, custom duties and unrecoverable GST/VAT on payments
supporting the development of the project may be relevant. As tax losses will generally arise, there may be no
corporate taxes paid in this phase.
3. Mine
and process Mine and process | Market and deliver – Decades
Once the facility is operational, governments begin to receive royalty payments, which can span many decades.
In the initial years of operation, there may be no corporate income taxes paid as allowances for the capital costs
associated with construction are applied or tax losses from the design and construction phase are utilised.
Once tax losses have been utilised, corporate income taxes begin to be paid. As corporate income taxes relate
to profits, commodity prices affect the tax revenue collected by governments. Profitable operations can result
in a significant economic contribution in the form of taxes and royalties as well as other benefits to local
4. Market economies in the form of employment, payments to suppliers and support to local communities.
and deliver
5. Repurpose Repurpose and renew – 5+ years
and renew Payments to governments in the final closure and post-closure phases, when the mine is no longer
operational, are significantly less than in the operating phase.
Underpinned by disciplined capital allocation
26 Taxes Paid: Our Economic Contribution 2021 | riotinto.comOur commitment to transparency and
responsible tax principles
We believe that greater transparency and accountability are
key to earning and building trust, encouraging sustainable
business practices and translating taxes and royalties into
beneficial development outcomes for communities that host
our operations.
Being open about our tax payments, mineral development contracts, Our disclosures in this report demonstrate our approach to the seven
beneficial ownership and our stance on a range of other sustainability Responsible Tax Principles:
issues – like climate change – allows us to enter into open, fact-based
conversations with our stakeholders in detail, and provides a better 1. Tax is a core part of corporate responsibility and governance
understanding of everyone’s roles and responsibilities. and is overseen by the Board of Directors (the Board).
By partnering with investors, governments and civil society 2. We comply with the tax legislation of the countries in which we
organisations, multinational companies like ours can be at the forefront operate, and pay the right amount of tax, at the right time, in the
of collaborative efforts to restore integrity and support stable and countries where we create value.
effective tax systems. That is why we are a founding member of the 3. We will only use business structures that are driven by commercial
Extractive Industries Transparency Initiative (EITI), and a signatory considerations, are aligned with business activity and which have
to the B Team Responsible Tax Principles. Through increased and genuine substance. We do not seek abusive tax results.
improved disclosures, EITI seeks to strengthen public and corporate 4. We seek, wherever possible, to develop co-operative relationships
governance, promote understanding of natural resource management with tax authorities, based on mutual respect, transparency and trust.
and provide the data to inform reforms for greater transparency and
5. Where we claim tax incentives offered by government authorities,
accountability in the extractives sector. We are committed to improved
we seek to ensure that they are transparent and consistent with
mineral resource governance and have played a leading role in the
statutory or regulatory frameworks.
disclosure of tax payments to governments, mineral development
contracts with governments and beneficial ownership information. 6. We engage constructively in national and international dialogue with
governments, business groups and civil society organisations to
The B Team is a not-for-profit initiative formed by a global group support the development of effective tax systems, legislation and
of business leaders to catalyse a better way of doing business. administration.
The B Team Responsible Tax Principles define what leadership
7. We provide regular information to our stakeholders, including
in responsible tax looks like and were developed by a group of
investors, policy makers, employees, civil society organisations
cross-sector, cross-regional companies to articulate best practice
and the general public, about our approach to tax and taxes paid.
in seven key areas.
Taxes Paid: Our Economic Contribution 2021 | riotinto.com 27You can also read