Technology - Mirus Capital Advisors
←
→
Page content transcription
If your browser does not render page correctly, please read the page content below

INDUSTRY REPORT
                                                                            E-Commerce
                                                                                Q1, 2021

                      Technology

In This Issue:
●   Industry News                                           © Mirus Capital Advisors, Inc. 2021

●   Transactions
●   State of the Industry
●   About Mirus
●   Mirus Business Services
    Spotlight

200 SUMMIT DRIVE, 4TH FLOOR, BURLINGTON, MA 01803 | 781.418.5900 | MERGER.COM            1
E-Commerce

Industry News

U.S Digital Revenue Rose 45% YoY in Q1

Salesforce Full Article

According to the Q1 2021 Shopping Index released by Salesforce, recent
stimulus checks have generated increased consumer online spending this
quarter. Digital revenue rose by 45% YoY, well above pre-pandemic
levels. Categories that captured a majority digital sales growth include
sporting goods, home appliances and luxury handbags. On the other
hand, categories reporting struggling sales growth included art, dining
and general handbags and luggage. Continued growth indicates that
retailers need to make investments into the e-Commerce space in order
to adapt to sustained consumption in the digital space.

The Future of E-Commerce

Shopify Full Article

According to Shopify’s 2021 report, at the height of the pandemic, ten
years of e-commerce growth occurred in the span of 3 months. Both
millennials and older shoppers have driven the online shopping trend. At its
peak, e-Commerce accounted for 16.4% of total global retail sales, and
84% of customers shopped online during the pandemic. E-Commerce is
what Shopify dubs the “economic sweet spot” as consumers and brands
rush online. E-Commerce is expected to grow as a percentage of retail
sales over the next five years. While it has proven to be a tailwind for
brands, it will also become a headwind as the e-Commerce landscape
becomes more crowded and competitive.

2021 Trends in E-Commerce

The Science Times Full Article

E-Commerce has taken the retail world by a storm, and it is forecasted to
continue to grow. According to Statista, over 2.14 billion people
worldwide will be shopping online in 2021.

Notably, changes in consumption patterns and increased mobile devices
usage will shape the e-Commerce of 2021. Major companies such as
Google, Sony Music and Amazon have announced employees will
continue to work from home until the end of 2021. Teleworking has further
reinforced the decline in travel and luxury good purchases and a spike in
sales of “everyday” products. Furthermore, mobile commerce or m-
commerce will take center stage in 2021. “By the end of 2021, mobile
sales will account for 72.9% of all e-commerce sales, or about $3.56
trillion, an increase of 22.3% over last year.”
                                                                            2
E-Commerce

                      E-Commerce M&A

                                                                          Expedia
                                                                          acquired Liberty
                      160                           Walmart                                                       35,000

                                                                                                                           Aggregate Transaction Value
Closed Transactions

                      140                           acquired Flipkart                                             30,000
                      120                                                                                         25,000
                      100                                                                                         20,000
                       80
                       60                                                                                         15,000

                                                                                                                                      ($M)
                       40                                                                                         10,000
                       20                                                                                         5,000
                        0                                                                                         -
                            Q1 Q2 Q3 Q4 Q1 Q2 Q3 Q4 Q1 Q2 Q3 Q4 Q1 Q2 Q3 Q4 Q1 Q2 Q3 Q4 Q1
                               2016         2017               2018            2019             2020       2021

                                         Closed Transactions            Aggregate Transaction Value ($M)

                      Selected Q1 2021 E-Commerce Transactions

                                                                                                                           3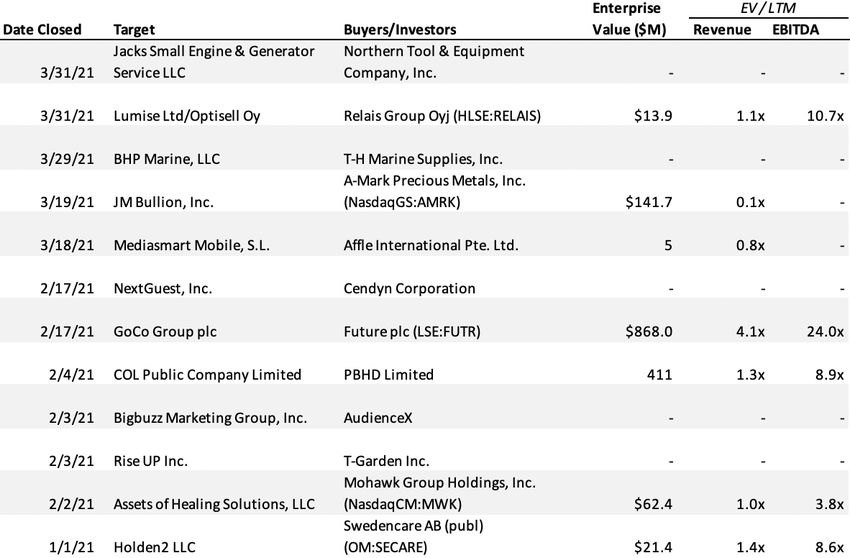
Consumer
The consumer industry continues to grow steadily in Q1. There has been
continuing improvement in revenue and EBITDA multiples and M&A activity
remains robust. The outlook for the rest of the year is optimistic. The Consumer
Confidence Index surged in March to the highest reading this year at 109.7, up
from 90.4 in February. With increasingly individualized shopping experiences
driven by big data, e-Commerce will continue to play a key role in the
consumer market.

                                                                                   4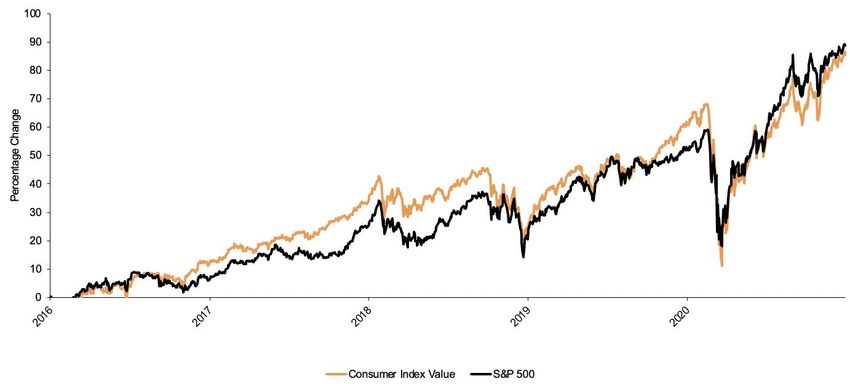
Consumer
                               State of the Industry

                                                                                            Consumer Confidence Index
                          160
                          140
                          120
                          100
                           80
                           60
                           40
                           20
                               0
                                    Q1       Q2          Q3    Q4    Q1    Q2          Q3    Q4     Q1    Q2          Q3    Q4    Q1    Q2          Q3    Q4    Q1    Q2          Q3    Q4       Q1
                                                  2016                          2017                           2018                          2019                          2020                  2021

                                   Source: Capital IQ

                                                                                                 Consumer Price Index
                         265

                         260

                         255

                         250

                         245

                         240

                         235

                         230

                         225
                                   Q1       Q2          Q3    Q4    Q1    Q2          Q3    Q4     Q1    Q2          Q3    Q4    Q1    Q2          Q3    Q4    Q1    Q2           Q3   Q4        Q1
                                                 2016                          2017                           2018                          2019                          2020                2021

                                    Source: Capital IQ
                                                                                                  Industry Valuations
                         16x                                                                                                                                                                            1.6x
                         14x                                                                                                                                                                            1.4x
           EV / EBITDA

                         12x                                                                                                                                                                            1.2x

                                                                                                                                                                                                               EV / Revenue
                         10x                                                                                                                                                                            1.0x
                          8x                                                                                                                                                                            0.8x
                          6x                                                                                                                                                                            0.6x
                          4x                                                                                                                                                                            0.4x
                          2x                                                                                                                                                                            0.2x
                          0x                                                                                                                                                                            0.0x
                                   Q1      Q2          Q3     Q4    Q1    Q2          Q3    Q4    Q1     Q2          Q3    Q4    Q1    Q2          Q3    Q4    Q1    Q2          Q3    Q4    Q1
                                                2016                           2017                           2018                          2019                          2020               2021

                                                                                                  EV / EBITDA               EV / Revenue
                                    Source: Capital IQ

                                                                                  Consumer Transaction Volume
                     2,500
Transaction Volume

                     2,000

                     1,500

                     1,000

                         500

                          0
                                   Q1      Q2          Q3     Q4    Q1    Q2          Q3    Q4     Q1    Q2          Q3    Q4    Q1    Q2          Q3    Q4    Q1    Q2           Q3    Q4       Q1
                                                2016                           2017                           2018                          2019                           2020               2021

                                    Source: Capital IQ
                                                                                                                                                                                             5
The Value of
                                                  Accomplishment
                                                  The highest level of expertise and hard
                                                  work is what accomplishment requires.
                                                  It’s what you deserve and what we do.

                                                  • We sweat the small stuff.
                                                  • Take a 3:00am call.
                                                  • Say yes.
                                                  • Say no.
                                                  • Dig deeper when things get tough.
                                                  • And celebrate with you when your
                                                    efforts pay off and you can reflect on
                                                    it all and say, “It’s really remarkable
                                                    what we’ve accomplished here.”
                                                  • Then and only then, will we know that
                                                    we’ve accomplished something
                                                    meaningful, too.
About Mirus

Spending on consumer products & services drives over two-thirds of the US economy
and improving consumer sentiment is driving increased investment activity in the
sector. Well-capitalized consumer companies are turning to M&A as a key business
strategy to gain access to high growth emerging markets, cover the multichannel
landscape, acquire scale, and ensure access to resources. Our Consumer Group
understands these trends and can help you best position your company for growth or
a successful exit in the midst of ongoing consolidation. Mirus provides direct access to
sector-specific expertise, as well as global buyers and sellers.

Partner Spotlight

Andrew Crain brings to Mirus a diverse skillset of transactional,
executive and legal acumen. Andy is an experienced
dealmaker, and his prior experience as a family business
owner gives him a unique vantage point from which to
successfully guide clients through the financial, operational
and emotional aspects of the transaction process. An
investment banker since 2005, Andy provides merger &
acquisition and corporate finance advisory services to owners            Andrew Crain
of consumer products, food & beverage, business & industrial            (781) 418-5950
services,   manufacturing     and    distribution     companies       crain@merger.com
throughout New England and nationwide. An investment
banker since 2005, Stuart also has 20 years experience as a
senior executive of national retail chains, and e-commerce
and direct marketing companies. Stuart has led shoe, home
furnishing, continuing education and food catalogs Or
companies. He has additional experience in apparel and
beauty.     Stuart’s transaction experience centers on e-
commerce and catalog companies, food and beverage,                         Stuart Rose
and home and gift. Stuart, a frequent speaker and writer, has            (781) 418-5922
an MBA from Harvard University and has taught direct                   rose@merger.com
marketing and advertising at Bentley College.
                                                                                      6
You can also read