The American Rescue Plan and the Unemployed: Making Health Coverage More Affordable After Job Loss - ASPE
←
→
Page content transcription
If your browser does not render page correctly, please read the page content below
July 1, 2021

                                                                                                           HP-2021-15

        The American Rescue Plan and the Unemployed:
           Making Health Coverage More Affordable
                       After Job Loss
            The American Rescue Plan offers enhanced health insurance premium
                 tax credits and cost-sharing reductions for people receiving
                       unemployment compensation benefits in 2021.

                      Rose C. Chu, D. Keith Branham, Kenneth Finegold, Ann B. Conmy,
                         Christie Peters, Nancy De Lew, and Benjamin D. Sommers

    KEY POINTS
       •   Under the American Rescue Plan Act of 2021 (ARP), people who receive or were approved to receive
           unemployment compensation (UC) for any week beginning in 2021 are eligible for enhanced
           Marketplace subsidies to obtain health insurance and to pay for care. The enhanced subsidies are
           accessible on HealthCare.gov as of July 1, 2021.
       •   Marketplace advanced premium tax credits (APTCs) are newly available for taxpayers receiving UC
           with household income less than 100 percent of the Federal Poverty Level (FPL), while those with
           higher household incomes now generally qualify for zero-premium benchmarks plans, since the ARP
           treats taxpayers receiving UC benefits as if their household income was at least 100 percent and no
           more than 133 percent FPL.i
       •   The Congressional Budget Office and the Joint Economic Committee estimated that 1.4 million people
           will benefit from these new provisions, including 500,000 new Marketplace enrollees saving on
           average more than $7,000 this year on health insurance. These ARP provisions will build on the
           record growth in health insurance coverage related to the Affordable Care Act.
       •   Those newly eligible for premium tax credit subsidies under the ARP (household income above 400%
           FPL) are likely to see some of the greatest decreases in post-APTC premiums if they received UC in
           2021. This Issue Brief presents several case studies, showing premium savings as a result of the ARP,
           in some cases of more than $700 a month.

i
 The ARP APTC provisions are currently only temporary. The UC provision only applies to coverage in 2021, while other
APTC provisions are applicable to 2021 and 2022 coverage.

    aspe.hhs.gov                                                                                                    1
INTRODUCTION
American Rescue Plan (ARP) Unemployment Compensation Provision for Health Coverage
The COVID-19 public health emergency has exacerbated the health care needs of uninsured, unemployed
workers. A total of 6 percent of all adults (15.3 million individuals) reported in a July-August 2020 survey that
someone in their household lost health insurance during the pandemic, representing the largest annual loss of
employer coverage ever recorded.1,2 Other studies indicate lower estimates of loss of health coverage, with
many employers continuing health coverage for their laid off employees;3,4 however, uncertainty regarding
stability of coverage remains.
The ARP, enacted on March 11, 2021, includes a number of provisions to make private health coverage more
affordable, including for people receiving unemployment compensation (UC). Under the ARP, individuals
approved for UC for at least one week beginning in 2021 are eligible for enhanced Marketplace subsidies for
themselves and their household throughout 2021, if they are otherwise eligible for such subsidies. Temporary
special rules regarding treatment of household income allow UC recipients to be treated as if their income was
133 percent of the Federal Poverty Level (FPL), which under the ARP, generally qualifies them for a zero-
premium benchmark silver plan and cost sharing subsidies in 2021.ii These rules also allow UC recipients with
household incomes below 100% FPL who are not eligible for Medicaid to be eligible for Marketplace subsidies.
These provisions are temporary and only apply to UC recipients for 2021 and are being implemented on
HealthCare.gov beginning July 1, 2021.
The purpose of this Issue Brief is to examine the UC premium tax credit (APTC) and cost-sharing reduction
(CSR) provisions under the ARP, describe the populations likely to benefit from these new temporary
provisions, and to provide illustrative examples to highlight the possible household impacts of these
provisions.
METHODS
Our analysis uses Department of Labor data including unemployment compensation claims, labor force
participation, and unemployment rates. The analysis also uses HealthCare.gov Qualified Health Plan (QHP)
premium and service area data from CMS for 2021 coverage.5,6 We also review external studies on the
uninsured and UC recipients during the COVID-19 public health emergency.
RESULTS
Eligible Population of UC Recipients
Unemployment compensation programs are administered by the states, funded by state and federal taxes on
employers; three states provide for employee contributions. During prior economic downturns, the federal
government fully funded additional weeks of emergency benefits for workers who exhausted their regular UC.
The Emergency Unemployment Compensation Act of 2008 and subsequent legislation provided up to 34 weeks
of additional UC (up to 63 weeks in states with unemployment rates of 8.5 percent or higher), paid by 100
percent federal funding.
ii
The enhanced premium tax credit provision applies when the UC recipient is the taxpayer of the household. The cost-
sharing subsidy provision applies if anyone in the household is the UC recipient and a silver plan is selected. Also, in most
states, the benchmark plan is a zero-premium plan; however, as discussed on pages 6-7 of this report, some state cover
non-Essential Health Benefits in their plans, which means the premium tax credits do not fully cover the cost of the
benchmark plan.
July 2021 ISSUE BRIEF 2The Coronavirus Aid, Relief, and Economic Security (CARES) Act (March 2020) as enacted provided 13
additional weeks of federally funded Pandemic Emergency Unemployment Compensation (PEUC) for those
who exhaust regular state benefits and then additional weeks (up to 13 or 20 weeks depending on state laws)
of federally funded Extended Benefits (EB) through December 31, 2020. The CARES Act also provides federally
funded Pandemic Unemployment Assistance (PUA) for some who exhaust all those benefits (regular UC, PEUC,
and EB if available) and for others who lost their jobs due to the pandemic but who are not normally eligible
for UC in their state. This new group includes the self-employed, those seeking part-time employment, and
those who otherwise would not qualify for regular UC.iii The Consolidated Appropriations Act, 2021 (December
2020) and the ARP then extended these enhanced UC benefits through September 6, 2021, providing up to 24
weeks of PEUC.
The Department of Labor reports that the total number of persons receiving UC ranged from at least 14.5
million for the week ending June 5, 2021, to at least 20.4 million for the week ending February 20, 2021 (the
week with the highest number of UC recipients so far this year), but these numbers are an underestimate since
they are missing PEUC and PUA data for Florida and Georgia.iv,7
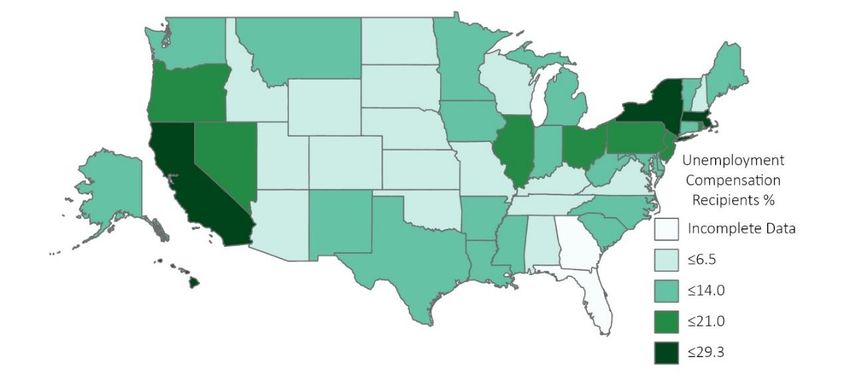
Figure 1 presents a map of the share of each state’s labor force that was receiving UC as of February 20, 2021.
Since the ARP features are tied to UC receipt, that is the more relevant measure for understanding the ARP’s
impact on health insurance, rather than the unemployment rate, which includes some individuals who are no
longer receiving UC or never received UC.
Figure 1: Total Unemployment Compensation Recipients as a Percentage of Labor Force by State, as of
February 20, 2021
Source: U.S. Department of Labor
Note: PEUC and PUA claims were missing for Florida and Georgia.
Table 1 shows state level unemployment rates and UC recipient rates along with the most recent data
available on health uninsurance rates from the 2019 American Community Survey.
iii
PUA eligibles include those not meeting requirements for wages earned or time worked during the base period, usually
the first four out of the last five completed quarters prior to the filing of the claim.
iv
For the week ending February 20, 2021, there were 4.8 million continuing claims filed for regular UI, 8.4 million for
PEUC, 5.9 million for PUA, and 1.3 million for EB.
July 2021 ISSUE BRIEF 3Table 1: Rates of Unemployment, Unemployment Compensation Recipients, and Uninsured by State
State February 2021 Unemployment Compensation Recipients 2019 Uninsured
Unemployment Rate (%) (% Labor Force) Age 19-64
Week of February 20, 2021
Alabama 4.0 5.0 15.0
Alaska 6.6 12.5 15.8
Arizona 6.9 6.5 15.4
Arkansas 4.5 8.0 13.1
California 8.5 25.6 10.9
Colorado 6.6 5.4 10.7
Connecticut 8.5 13.0 8.3
Delaware 6.3 6.6 9.3
District of Columbia 8.1 11.3 4.4
Florida 4.7 1.5* 19.5
Georgia 4.8 6.3* 18.9
Hawaii 9.2 21.8 5.9
Idaho 3.3 3.4 16.5
Illinois 7.4 15.5 10.5
Indiana 4.0 10.8 11.6
Iowa 3.6 8.1 7.3
Kansas 3.2 2.9 13.1
Kentucky 5.2 5.1 9.1
Louisiana 7.6 12.0 13.1
Maine 4.8 7.6 11.6
Maryland 6.2 11.4 8.3
Massachusetts 7.1 23.7 4.2
Michigan 5.2 13.3 8.3
Minnesota 4.3 9.8 6.9
Mississippi 6.3 8.6 19.5
Missouri 4.2 4.4 14.2
Montana 3.9 8.6 11.8
Nebraska 3.1 2.4 11.7
Nevada 8.3 18.5 15.5
New Hampshire 3.3 6.3 8.9
New Jersey 7.8 17.7 11.1
New Mexico 8.3 12.4 14.6
New York 8.9 29.3 7.5
North Carolina 5.7 7.2 16.4
North Dakota 4.7 5.3 8.2
Ohio 5.0 18.5 9.1
Oklahoma 4.4 5.5 20.5
Oregon 6.1 14.9 10.3
Pennsylvania 7.3 16.1 7.9
Rhode Island 7.3 16.5 5.9
South Carolina 5.2 7.7 16.1
South Dakota 2.9 1.7 14.2
Tennessee 4.9 5.6 14.9
Texas 6.9 10.3 24.5
Utah 3.0 1.9 12.1
Vermont 3.1 11.2 6.7
Virginia 5.2 6.4 11.0
Washington 5.6 7.0 9.5
West Virginia 6.2 7.1 10.0
Wisconsin 3.8 4.6 8.1
Wyoming 5.3 4.3 16.6
Total 6.2 12.7 12.9
*PEUC and PUA were missing for Florida and Georgia
Sources: Department of Labor and 2019 American Community Survey.
July 2021 ISSUE BRIEF 4UC Recipients without Health Insurance during 2021
Precise information on uninsured rates among those receiving UC is not available in administrative data.
However, survey data offer some insights. An analysis of the Census Bureau’s Household Pulse Survey found
that more than 4 million uninsured workers were receiving UC from Nov 23, 2020, to January 18, 2021. Nearly
half of this group (49 percent) were people of color, including 24 percent Hispanic and 16 percent Black; 39
percent had children under 18 living at home; and 76 percent did not have a college degree.8 Two-thirds of
these uninsured workers receiving UC live in just 10 states9:
• Texas (776,000)
• California (639,000)
• New York (258,000)
• Florida (249,000)
• Georgia (213,000)
• Pennsylvania (171,000)
• New Jersey (131,000)
• North Carolina (115,000)
• Illinois (108,000)
• Washington (105,000)
Impact of ARP UC Provisions on Marketplace Premiums
Generally, households with incomes less than 100 percent FPLv in states that have not expanded Medicaid are
not eligible for APTCs and many are also not eligible for Medicaid; this situation is known as the “Medicaid
coverage gap.” A recent ASPE report estimated that there are 2.3 million uninsured non-elderly adults in the
Medicaid coverage gap,10 and the new ARP UC provisions will make APTCs available to many of them. UC
recipients who are taxpayers and their tax households who meet the other eligibility criteria for APTCsvi are
now eligible for enhanced APTCs.
Because the ARP UC provision treats the households of UC recipients as if they had household incomes of at
least 100 percent and no more than 133 percent FPL, they are generally eligible for zero-premium benchmark
silver plans. Households in which any individual is a UC recipient can also be eligible for cost-sharing
reductions. For comparison, before the ARP, households with income of 133 percent FPL paid up to 2.07
percent of their household income towards the premium of the second lowest cost silver (SLCS) plan.
A small number of states do not have zero-premium plans. This most commonly occurs if all plans in the state
cover services that are not Affordable Care Act (ACA) defined essential health benefits (EHBs), which means
premiums in that state cannot be reduced by APTCs to zero dollars.vii However, due to the comprehensiveness
of ACA EHBs, non-EHB portions of premiums are typically relatively small. These details are discussed at more
length in ASPE’s previous analysis of zero-premium plans under the ARP.11
v
The exception is for legally present individuals who are not eligible for Medicaid because of immigration status; these
individuals can have incomes less than 100 percent FPL or less than 133 percent FPL (non-expansion vs. expansion) and
qualify for APTCs, if otherwise eligible.
vi
To be eligible for APTCs, persons cannot be eligible for minimum essential coverage outside of the individual market,
including Medicaid, Medicare, and employer coverage that is affordable (for 2021, defined as self-only coverage for the
employee that costs 9.83 percent or less of household income) and that provides minimum value.
vii
Non-essential health benefits are services beyond the ACA’s ten categories of essential services and include certain
state mandates, adult vision, and adult dental coverage. For more details see: https://www.cms.gov/cciio/resources/data-
resources/ehb#ehb.
July 2021 ISSUE BRIEF 5APTCs can be applied to any metal tier plans (Bronze, Silver, Gold, or Platinum) enrolled in through the Marketplace, with consumers paying the difference in premium between the benchmark plan (second-lowest cost silver) and their chosen plan, if its premium is higher. People with household incomes of 133 percent FPL (or treated as such, as in the case of UC recipients) who are otherwise eligible can enroll in plans with CSRs that yield an actuarial valueviii (AV) of 94%, meaning that the plans cover on average 94% of total costs of in- network essential health benefits (EHB) covered by the health plan, meaning consumers can expect to pay on average the other 6% of those costs. This means that under the ARP, some UC recipients will be eligible not just for substantial premium savings but also for far more generous coverage, with lower deductibles and copays. The enhanced APTCs and CSRs for UC recipients will be implemented at HealthCare.gov starting on July 1, 2021, and generally will take effect August 1 for consumers who apply or update an existing application by July 31, 2021. UC recipients residing in states with State-based Marketplaces (SBMs) are also eligible for enhanced APTCs. At least six SBMs (California, Maryland, Massachusetts, New Jersey, Rhode Island, and Washington State) automatically switch silver plans to 94% AV plans for those showing UC on their enrollment application. UC recipients in those SBM states who don’t have silver plans or who did not list UC on their enrollment applications can update their enrollment applications to be enrolled in those plans, as can UC recipients in the other SBM states (Colorado, Connecticut, District of Columbia, Idaho, Minnesota, Nevada, New York, Pennsylvania, and Vermont). The ARP also extended options for coverage through Consolidated Omnibus Budget Reconciliation Act (COBRA) coverage, most commonly utilized by those who have lost benefits from a job. Under the ARP, 100 percent of COBRA premiums for eligible individuals are paid for by the federal government through September 30, 2021. However, after September 2021, those who do not continue their COBRA coverage are eligible to apply for Marketplace coverage during a Special Enrollment Period (SEP). Those losing COBRA coverage and who are UC recipients in 2021 may elect to switch to Marketplace coverage with enhanced APTCs and CSRs during the SEP. viii The actuarial value (AV) of a health plan is the average percentage of total costs of in-network essential health benefits (EHB) covered by the health plan. The AV of plans available in the individual market ranges from 60% for bronze plans, 70% for silver plans, 80% for gold plans, and 90% for platinum plans. For certain eligible individuals (generally those with household incomes between 100%-250% FPL) silver CSR plan variations are available, which enhance AV from 70% to 73%, 87%, or 94% depending on household income. July 2021 ISSUE BRIEF 6
Estimated Take-up of the ARP Provisions for UC Recipients
The Congressional Budget Office (CBO) and Joint Economic Commission (JEC) estimate that 900,000 UC
recipients already enrolled in Marketplace coverage will receive on average $1,040 in additional PTCs, and
500,000 UC recipients will newly enroll in Marketplace and receive on average $7,040 in PTCs.12

Enrollment Assistance
According to a 2018 Commonwealth survey, two thirds of uninsured adults did not try to enroll in health
insurance on the Marketplace.13 When asked why, 36 percent said they did not think it would be affordable,
15 percent said they did not think they needed it, 8 percent said they did not think they would be eligible for
insurance, and 7 percent said they were not aware of the Marketplace. Those receiving UC in 2021 can apply
for health plans with APTCs and CSRs during the COVID-19 Special Enrollment Period through August 15, 2021,
directly on HealthCare.gov or through an insurance agent, assister, or Navigator
(https://localhelp.healthcare.gov/#/). Many community health centers and hospitals also have assisters.

Case Studies: Potential Household Impacts
We selected several hypothetical case scenarios to highlight the impact the ARP UC provision could have on
individuals and families. The individuals, families, and couples differ by age, household income, state (Medicaid
expansion and non-Medicaid expansion), and geography. Table 2 shows these scenarios and premiums (net of
APTCs) before and after the ARP UC provisions.

Table 2: Vignettes Illustrating the Impact of the ARP UC Provision Could Have on Premiums and AV

                                                                                                     Subsidized
              Household            Household
 Scenario                                         State       County           Unsubsidized   w/o     w/
              Composition          Income                                                                   Difference
                                                                                              UC     UC
              Single adult, age
     1                             78% FPL        Texas       Harris               $321       $321   $0       -$321
              27
              Family of 3,
              parents age 45,                     Montan
     2                             175% FPL                   Yellowstone          $1,263     $32    $0       -$32
              dependent age                       a
              19
              Family of 4,
              parents age 35,                                                                 $14
     3                             225% FPL       Florida     Miami-Dade           $1,415            $0       -$147
              children ages 0-                                                                 7
              14
     4        Couple, age 55       350% FPL       Illinois    Cook                 $1,205     $367   $2       -$365
     5        Couple, age 40       500% FPL       Alaska      Anchorage            $1,316     $765   $2       -$763
Note: Plan Year 2020 APTC determination is based on 2020 FPL guidelines.
*Rounded to nearest dollar; assumes post ARP APTC for the subsidized without UC estimates
**Approximate

Individuals who received UC in 2021 with household income outside of the CSR eligibility range (generally
250% FPL) will see the greatest increase in the AV of their benchmark plan, going from 70% to
94%. Meanwhile, those not currently eligible for any APTCs (primarily those below 100 percent of FPL in non-
Medicaid expansion states) would see very large reductions in premiums.

 July 2021                                                                                           ISSUE BRIEF         7
These changes represent substantial potential savings in terms of premiums and out-of-pocket costs. For example, a single 27-year old adult in Harris County Texas with an annual income of $10,000 (approximately 78% FPL) was previously ineligible for Marketplace subsidies; under the ARP UC provision, the monthly premium of the benchmark plan would drop from $321 to $0 after subsidy. Similarly, a qualifying 55-year old couple in Cook County, Illinois, with annual income of 350% FPL, could see a drop in monthly benchmark premium of $365. Those newly eligible for premium tax credit subsidies under the ARP (household income above 400% FPL) may see some of the greatest decreases in post-APTC premium if they received UC in 2021. For example, a qualifying 40-year old couple in Anchorage, Alaska, with annual income at 500% FPL could save as much as $763 in monthly benchmark premium when purchasing the benchmark plan. Eligible UC recipients with annual household income above 200% and up to 250% FPL may also benefit substantially, with silver plan AV on average increasing from 73% to 94% and monthly benchmark premiums decreasing to zero or near zero. For example, a family of 4 in Miami-Dade County, Florida, with parents age 35 and 2 children under 15, and an annual income of 225% FPL, could see their monthly after APTC premium reduced from $147 to $0. Those with annual household income about 150% FPL and up to 200% FPL may also see some reduction in benchmark premiums and increase in silver plan AV (from 87% to 94%)—for example, a family of 3, with parents age 45 and a dependent age 19, annual income of 175% FPL, living in Yellowstone County, Montana, could see a benchmark premium reduction of $32 per month. CONCLUSION The ARP UC provisions address the impact of the COVID-19 pandemic on job loss, as well as the need for affordable health insurance coverage. They provide enhanced Marketplace subsidies to individuals receiving unemployment compensation in 2021. These significant changes, which are available starting July 1, 2021, at HealthCare.gov states, can substantially reduce the cost of private health coverage for millions of workers and their families who have experienced job losses during the pandemic, and will build on the already record enrollment in ACA-related coverage in 2021.14 July 2021 ISSUE BRIEF 8
REFERENCES

1
  Dorn, S and Dorn, R. Congress can Provide Millions of Uninsured Workers with Health by Connecting Unemployment
Insurance Beneficiaries with Health Insurance Premium Tax Credit. Families USA, February 8, 2021. Accessed at:
https://familiesusa.org/resources/congress-can-provide-millions-of-uninsured-workers-with-health-care-by-connecting-
unemployment-insurance-beneficiaries-with-health-insurance-premium-tax-credits/.
2
  Data from NPR, The Robert Wood Johnson Foundation, and Harvard T.H. Chan School of Public Health. The Impact of
Coronavirus on Households Across America, September 2020. Accessed at: https://cdn1.sph.harvard.edu/wp-
content/uploads/sites/21/2020/09/NPR-RWJF-Harvard-National-Report_092220_Final1-4.pdf.
3
  McDermott, D, Cos, C, Rudowitz, R, and Garfield, R. How Has the Pandemic Affected Health Coverage in the U.S.? Kaiser
Family Foundation, December 9, 2020. Accessed at: https://www.kff.org/policy-watch/how-has-the-pandemic-affected-
health-coverage-in-the-u-s/.
4
  Fronstin, P. and Woodbury, S. Update: How Many Americans Have Lost Jobs with Employer Health Coverage During the
Pandemic? Commonwealth Fund Blog, January 11, 2021. Accessed at:
https://www.commonwealthfund.org/blog/2021/update-how-many-americans-have-lost-jobs-employer-health-
coverage-during-pandemic.
5
  Centers for Medicare and Medicaid Services, Consumer Information and Insurance Oversight. (November 23, 2020). Plan
Year 2021 Qualified Health Plan Choice and Premiums in HealthCare.gov States. Accessed at:
https://www.cms.gov/CCIIO/Resources/Data-Resources/QHP-Choice-Premiums.
6
  Health Insurance Exchange Public Use Files (Exchange PUFs). Centers for Medicare and Medicaid Services, Center for
Consumer Information and Insurance Oversight (CCIIO). Accessed at: https://www.cms.gov/CCIIO/Resources/Data-
Resources/marketplace-puf.
7
  Unemployment Insurance Weekly Claims. Department of Labor, June 3, 2021. Accessed at:
https://www.dol.gov/newsroom/releases.
8
  Dorn, S and Dorn, R. Congress can Provide Millions of Uninsured Workers with Health by Connecting Unemployment
Insurance Beneficiaries with Health Insurance Premium Tax Credit. Families USA, February 8, 2021. Accessed at:
https://www.familiesusa.org/wp-content/uploads/2021/02/COV2021-32-Congress-Health-Care-Insurance-Beneficiaries-
Tax-Credits_Analysis_LayoutB.pdf.
9
  Data from Census Household Pulse Survey November 23, 2020 to January 18, 2021. Accessed at:
https://www.census.gov/programs-surveys/household-pulse-survey/data.html.
10
   Branham DK, Peters C, and Sommers BD. Estimates of Uninsured Adults Newly Eligible for Medicaid If Remaining Non-
Expansion States Expand (Data Point No. HP-2021-12). Washington, DC: Office of the Assistant Secretary for Planning and
Evaluation, U.S. Department of Health and Human Services. May 28, 2021.
https://aspe.hhs.gov/system/files/pdf/265621/aspe-data-point-medicaid-expansion-new-eligible.pdf.
11
   Branham DK, Conmy AB, DeLeire T, Musen J, Xiao X, Chu RC, Peters C, and Sommers BD. Access to Marketplace Plans
with Low Premiums on the Federal Platform, Part III: Availability Among Uninsured Non-Elderly Adults and HealthCare.gov
Enrollees Under the American Rescue Plan (Issue Brief No. HP-2021-09). Office of the Assistant Secretary for Planning and
Evaluation, U.S. Department of Health and Human Services. April 2021. https://aspe.hhs.gov/pdf-report/access-to-low-
premiums-issue-brief-part-III.
12
   Reconciliation Recommendations of the House Committee on Ways and Means. Congressional Budget Office, February
15, 2021. Accessed at: https://www.cbo.gov/publication/57005.
13
   Gunja, M. Z. and Collins, S.R. Who Are the Remaining Uninsured, and Why Do They Lack Coverage? Commonwealth
Fund Biennial Health Insurance Survey, 2018. Commonwealth Fund, Aug. 2019. Accessed at:
https://www.commonwealthfund.org/publications/issue-briefs/2019/aug/who-are-remaining-uninsured-and-why-do-
they-lack-coverage.
14
   Issue Brief No. HP-2021-13. Health Coverage Under the Affordable Care Act: Enrollment Trends and State Estimates.
Office of the Assistant Secretary for Planning and Evaluation, U.S. Department of Health and Human Services. June 2021.
Accessed at: https://aspe.hhs.gov/system/files/pdf/265671/ASPE%20Issue%20Brief-ACA-
Related%20Coverage%20by%20State.pdf.

    July 2021                                                                                     ISSUE BRIEF        9
HP-2021-15 U.S. DEPARTMENT OF HEALTH AND HUMAN SERVICES Office of the Assistant Secretary for Planning and Evaluation 200 Independence Avenue SW, Mailstop 447D Washington, D.C. 20201 For more ASPE briefs and other publications, visit: aspe.hhs.gov/reports ABOUT THE AUTHORS Rose C. Chu is a Program Analyst in the Office of Health Policy in the Office of the Assistant Secretary in ASPE. D. Keith Branham is a Senior Research Analyst in the Office of Health Policy in ASPE. Kenneth Finegold is a Senior Social Science Analyst in the Office of Health Policy in ASPE. Ann B. Conmy is a Social Science Analyst in the Office of Health Policy in ASPE. Christie Peters is Director of the Division of Health Care Access and Coverage for the Office of Health Policy in ASPE. Nancy De Lew is the Associate Deputy Assistant Secretary for the Office of Health Policy in ASPE. Benjamin D. Sommers is the Deputy Assistant Secretary for the Office of Health Policy in ASPE. SUGGESTED CITATION Chu, R.C., Branham, D.K., Finegold, K., Conmy, A.B., Peters, C., De Lew, N., and Sommers, B.D. The American Rescue Plan and the Unemployed: Making Health Coverage More Affordable After Job Loss (Issue Brief No. HP-2021-15). Office of the Assistant Secretary for Planning and Evaluation, U.S. Department of Health and Human Services. July 2021. COPYRIGHT INFORMATION All material appearing in this report is in the public domain and may be reproduced or copied without permission; citation as to source, however, is appreciated. DISCLOSURE This communication was printed, published, or produced and disseminated at U.S. taxpayer expense. ___________________________________ July 2021 ISSUE BRIEF 10
Subscribe to ASPE mailing list to receive
email updates on new publications:
https://list.nih.gov/cgi-bin/wa.exe?SUBED1=ASPE-HEALTH-POLICY&A=1

For general questions or general
information about ASPE:
aspe.hhs.gov/about

 July 2021                                                          ISSUE BRIEF   11
You can also read