The Compelling Case for Managed Futures - David Lerman Senior Director, Asset Managers CME Group 312-648-3721 - Endor ...
←
→
Page content transcription
If your browser does not render page correctly, please read the page content below
The Compelling Case for
Managed Futures

David Lerman
Senior Director, Asset Managers
CME Group
312-648-3721
David.Lerman@cmegroup.com

                                  © 2019 CME Group. All rights reserved.
Risk Disclosure

The risk of loss in commodity interest trading can be substantial. You should,
therefore, carefully consider whether such trading is suitable for you in light of
your financial condition. The high degree of leverage that is often obtainable in
commodity interest trading can work against you as well as for you. Different
strategies are often utilized in commodity interest trading, significant
consideration should be given to which strategy is appropriate for your particular
financial situation. All investments in the commodity interest market should be
made with risk capital only.

The information, opinions and disclosures provided in this presentation are for the
purpose of supplying background information only and do not constitute
investment advice. Under no circumstances should this presentation be
considered as an offer to sell, or a solicitation to buy, interest in any account
managed by Endor Handel LLC. No representation, expressed or implied, is being
made with respect to the accuracy or completeness of the information or opinions
expressed within this presentation.

As with all trading strategies, past performance is not necessarily indicative of
future results.

                                                                    © 2019 Endor Handel LLC. All rights reserved.
The Investor’s Dilemma

                 Equities                                  Global                       Non-
                                                       diversification               correlation

    Real                            Fixed
   Estate                          Income
              Passive/Active/LDI
                  Strategies
                     GTAA
                                                                                                   Regulated &
                      SAA                                                Liquidity                 now central
                   Via cash                                                                         clearing
               futures/swaps or
                     funds

   Private
                                   Cash
   Equity
                Alternatives                                                         Long and
               Commodities                             Transparency                     short
                                                                                     strategies
                Real Assets
                   Timber
               Infrastructure

      Is there an investment Strategy that incorporates many of the elements above?

                                                                                © 2019 CME Group. All rights reserved.   3
Managed Futures History and Overview
Making sense of managed futures industry…
• 1st managed account attributed to noted technician Dick Donchian who secured power
of attorney to trade retail customer accounts in 1948
• Commodity Trading Advisors (CTAs)
- Professional commodity traders registered with National Futures Association (NFA) for purposes of
trading decisions on behalf of customers
- They may trade on behalf of separately managed accounts or pooled funds
• Commodity Pool Operators (CPOs)
- Registered with NFA to create and administer managed futures funds, commodity funds,
commodity pools
- CPOs usually retain services of CTAs to trade all or part of fund
- CPOs concentrate on fund raising, accounting, evaluation and monitoring of CTA performance
© 2019 CME Group. All rights reserved. 4Managed Futures: Growth in Assets Under Management*
(billions USD) 1980-2018
$400.00
$350.00
$300.00
$250.00
$200.00
$150.00
$100.00
$50.00
$-
1988
1989
1990
1991
1992
1993
1994
1995
1996
1997
1998
1999
2000
2001
2002
2003
2004
2005
2006
2007
2008
2009
2010
2011
2012
2013
2014
2015
2016
2017
2018 (6/30)
*According to the CME Group
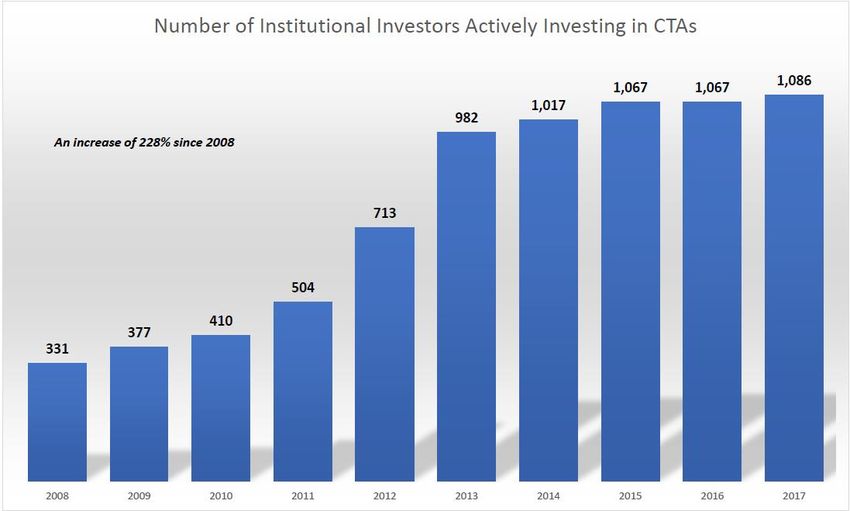
© 2019 CME Group. All rights reserved. 5More Institutions are Allocating to Managed Futures
Source: Mark Shore, Coquest Advisors
© 2019 CME Group. All rights reserved. 6Harvard Management Company:
Portfolio Evolution (1980-2016)
100%
80%
60%
40%
20%
0%
1980 1991 1996 2000 2007 2008 2010 2013 2014 2015 2016
-20%
Cash Absolute Return Total Real Assets Total Fixed Income
Private Equities Emerging Markets Foreign Equities Domestic Equities
Source: Michael O’Phelan of RJO Futures and Harvard Management Co.
© 2019 CME Group. All rights reserved. 7Stanford Endowment Asset Allocation
Merged Pool Policy Asset Allocation
(as of July 1, 2016)
Natural Domestic
Resources Equity
9% 8%
Real
Estate
8% International
Equity
20%
Private
Equity
26% Fixed Income
& Cash
6%
Absolute
Return
23%
© 2019 CME Group. All rights reserved. 8A sampling of Plan Sponsors/Endowments/SWFs that
allocate to managed futures
Pensions Plan Endowments Others
Sponsors
• Alberta Investment
Management • Northwestern University • Foundations such as R.
Woods Foundation
• Ontario Teachers Pension • University of Texas Investment
Plan Management • Sovereign Wealth funds—
ADIA
• California State Teachers • University of Oregon
Retirement System Endowment • Registered Investment
Advisors (RIAs)
• IL Teachers Retirement • University of Toronto Asset
System Management • HNW Investors
• Teachers Retirement System
of Texas
• Florida State Board of
Administration
© 2019 CME Group. All rights reserved. 9Major CTA Strategies
1 Trend Following/Countertrend Strategies
2 Arbitrage
3 Options Writing
4 Fundamental Global Macro
5 Intermarket / Intramarket Spreading
© 2019 CME Group. All rights reserved.Commodities/Commodity Trading Advisors and some Myths:
CTA’s use more than just commodities
A Commodity Trading Advisor (CTA) is an individual or organization which, for
compensation or profit, advises others as to the value of or the advisability of buying or
selling futures contracts, options on futures, or retail off-exchange forex contracts.
What does this mean?
A CTA is a member of the National Futures Association (NFA) so that it is registered and
regulated by the U.S. Commodity Futures Trading Commission.
WHY IS THIS SO CONFUSING?!
The word “commodity” in CTA doesn’t reflect what the strategies are trading. CTAs are
licensed to trade within the commodity interest marketplace. In the United States, this
includes product markets such as commodities, futures, options, swaps, physicals, digital
currencies, forex etc..
© 2019 CME Group. All rights reserved. 11Types of futures markets
Energy
Metals Brent Crude Oil Light Sweet Crude Oil
Copper Platinum Steel Heating Oil Natural Gas
Gold Palladium Zinc Henry Hub Swap
Silver
FX
Commodities
Australian Dollar Japanese Yen
British Pound Russian Ruble Corn Soy Oil
Canadian Dollar Swiss Franc Lean Hogs Soy Meal
Euro FX Live Cattle Soybeans
Indian Rupee Wheat
Equities
E-mini Nasdaq 100
Interest Rates
Nikkei 225 Mini
E-mini S&P 500 S&P CNX Nifty Index 2-Year Treasury Note 30-Year Treasury Bond
E-mini S&P MdCap 400 E-mini Russell 2000 5-Year Treasury Note
10-Year Treasury Note
…and now Bitcoin futures
© 2019 CME Group. All rights reserved. 12Managed Futures: Potential Impact on Portfolios
Managed futures portfolio impact: Potential for higher returns and lower volatility.
Traditional 60 / 40 Allocating 10% to
Portfolio Managed Futures*
U.S.
Bonds
40% U.S. U.S. U.S.
Stocks Bonds Stocks
60% 36% 54%
Average Annual Return 5.3% 5.4%
Annual Volatility 8.9% 8.0%
Ratio of Return to Volatility 0.59 0.68
Maximum Drawdown 33% 28%
Source: PIMCO, Bloomberg. 1 January 2000 to 31 March 2017.
* Past performance is not a guarantee or a reliable indicator of future results. U.S. Stocks: S&P 500 Total Return,
U.S. Bonds: Bloomberg Barcalays U.S. Aggregate Index, Managed Futures: SG Trend Index, SG Trend Index
inception: 1 January 2000. It is not possible to invest directly in an unmanaged index.
© 2019 CME Group. All rights reserved. 1310 compelling Reasons one might consider when
investing in Managed Futures
1. Diversify beyond the traditional asset classes.
Managed Futures are an alternative asset class that has achieved strong performance in both up
and down markets, exhibiting low correlation to traditional asset classes, such as stocks, bonds,
cash and real state.
2. Reduce overall portfolio volatility.
In general, as one asset class goes up, some other asset class goes down. Managed Futures
invest across a broad spectrum of asset classes with the goal of achieving solid long-term returns.
3. Increase returns and reduce volatility.
Managed Futures, as well as commodities, when used in conjunction with traditional asset
classes, may reduce risk, while at the same time potentially increasing returns.
4. Returns evident in any kind of economic environment.
Managed Futures may generate returns in bull and bear markets, boasting solid long-term track
records despite economic downturns. Moreover, they often do so with less volatility and smaller
drawdowns than other asset classes (see chart above).
5. Strong performance during stock market declines.
Managed Futures may do well in down markets because they employ short-selling and options
strategies that allow them to profit in such markets.
© 2019 CME Group. All rights reserved. 1410 compelling Reasons one might consider when
investing in Managed Futures
6. Successful institutions use them.
Pension Plan Sponsors, Endowments and Foundations have long used Managed Futures to
generate returns in excess of the S&P 500.
7. Commodity Trading Advisors (CTAs), Pool Operators (CPOs), and Managed
Futures Mutual Funds have access to a wide variety of global futures products
that are liquid and transparent.
These are more than 150 liquid futures products across the globe, including stock indexes, fixed
income, energies, metals, and agricultural products.
8. The CTA/CPO/Managed Futures Mutual Fund community is regulated.
Trading in a regulated marketplace builds the credibility and trustworthiness of the
CTA/CPO/Managed Futures Mutual Fund community.
9. Risk Management and Clearing.
CME Clearing institutes some of the most sophisticated risk management practices in the financial
world. For more than 100 years, CME Clearing has provided services that substantially mitigate
the risk of clearing member failure. CME Clearing has provided the resources to ensure the
performance of every contract on our exchanges for more than a century.
10. Overall industry growth has been exceptional.
In the last 35 years, assets under management for the Managed Futures industry have grown
1000 fold. Current assets under management stand at over $310 billion.
© 2019 CME Group. All rights reserved. 15Stocks vs. Managed Futures During Critical Events*
S&P 500 Total Barclay BTOP
Period Event Difference
Return Index 50 Index
Fourth Quarter 1987 Black Monday - Global Stock Markets Crash -22.53% 16.88% 39.41%
Fourth Quarter 2008 Bear Market in U.S. Equities led by Financials -21.95% 9.14% 31.08%
Third Quarter 2002 WorldCom Scandal -17.28% 9.41% 26.69%
Third Quarter 2001 Terrorist Attacks on World Trade Center and Pentagon -14.68% 4.12% 18.79%
Third Quarter 1990 Iraq Invades Kuwait -13.75% 11.22% 24.97%
Second Quarter 2002 Continuing Aftermath of Technology Bubble Bursting -13.39% 8.52% 21.92%
First Quarter 2001 Bear Market in U.S. Equities led by Technology -11.86% 5.97% 17.83%
Second Quarter 2010 European Sovereign Debt Crisis, "Flash Crash" -11.42% -1.94% 9.48%
First Quarter 2009 Credit Crisis Continues -11.01% -1.75% 9.26%
Third Quarter 1998 Russia Defaults on Debt, LTCM Crisis -9.94% 10.54% 20.48%
First Quarter 2008 Credit Crisis, Commodity Prices Rally -9.45% 6.43% 15.88%
Third Quarter 2011 European Sovereign Debt Crisis -8.90% 0.44% 9.34%
Third Quarter 2008 Credit Crisis, Government-Sponsored Bailout of Banks -8.37% -4.11% 4.26%
Fourth Quarter 2000 DotCom Bubble Bursts -7.82% 19.78% 27.60%
Third Quarter 1999 Anxiety during Run Up to Y2K -6.24% -0.67% 5.57%
Source: AlphaMetrix Alternative Investment Advisors, Bloomberg
*Past Performance is not necessarily indicative of future results.
© 2019 CME Group. All rights reserved. 16Visit our Managed Futures Resource Center to access:
• Podcasts: interviews on topics centered around risk management and
managed futures strategies. Each interview provides a unique
perspective from leading industry participants and range from 5 to 30
minutes in length.
• Managed Futures Research Digest: An aggregate of abstracts to help
navigate the vast world of research papers. Topics include:
- General managed futures
- Performance and portfolio management
- Trend following
- Liquidity and volatility
- Performance measurement
- Performance in varying interest rate
• Lintner Revisited: A Quantitative Analysis of Managed Futures: an
update to Dr. John Lintner's seminal paper, which describes the
diversification benefits that managed futures strategies can bring over the
long-term to an equity/fixed income/hedge fund portfolio.
Learn more at cmegroup.com/managedfutures
© 2019 CME Group. All rights reserved. 17Managed Futures Contact Information
Contact info:
David Lerman
Senior Director, Education
david.lerman@cmegroup.com
312-648-3721
Colby Borders
Director, Alternative Investment Marketing
colby.borders@cmegroup.com
312-648-3682
© 2019 CME Group. All rights reserved. 18CME Group Disclaimer
Futures trading is not suitable for all investors, and involves the risk of loss. Futures are a leveraged investment, and
because only a percentage of a contract’s value is required to trade, it is possible to lose more than the amount of money
deposited for a futures position. Therefore, traders should only use funds that they can afford to lose without affecting their
lifestyles. And only a portion of those funds should be devoted to any one trade because they cannot expect to profit on
every trade.
The Globe Logo, CME®, Chicago Mercantile Exchange®, and Globex® are trademarks of Chicago Mercantile Exchange
Inc. CBOT® and the Chicago Board of Trade® are trademarks of the Board of Trade of the City of Chicago. NYMEX, New
York Mercantile Exchange, and ClearPort are trademarks of New York Mercantile Exchange, Inc. COMEX is a trademark
of Commodity Exchange, Inc. CME Group is a trademark of CME Group Inc. All other trademarks are the property of their
respective owners.
The information within this presentation has been compiled by CME Group for general purposes only. CME Group
assumes no responsibility for any errors or omissions. Although every attempt has been made to ensure the accuracy of
the information within this presentation, CME Group assumes no responsibility for any errors or omissions. Additionally, all
examples in this presentation are hypothetical situations, used for explanation purposes only, and should not be
considered investment advice or the results of actual market experience.
All matters pertaining to rules and specifications herein are made subject to and are superseded by official CME, CBOT,
NYMEX and CME Group rules. Current rules should be consulted in all cases concerning contract specifications.
Copyright © 2018 CME Group. All rights reserved.
© 2019 CME Group. All rights reserved.You can also read