The Happiness Indicator - Combination of a self-help website and a scientific follow-up study
←
→
Page content transcription
If your browser does not render page correctly, please read the page content below

The Happiness Indicator
                Combination of a
self-help website and a scientific follow-up study

      http://www.happinessindicator.com

               Prospectus 2021
                    What it involves
        For what purposes it can be used
                   How you can join

                      A project lead by:
        Dr. Martijn Burger and Prof. Dr. Ruut Veenhoven
        Erasmus University Rotterdam, The Netherlands
   Erasmus Happiness Economics Research Organization EHERO
                Contact: veenhoven@ese.eur.nl
Happiness Indicator                                               Prospectus 2021

Summary

The Happiness Indicator is a self-help website as well as a scientific follow-up
study. Participants record periodically how happy they feel and how they spend
their time. Every year they report on major changes in their life.

Benefits for participants
The website offers its users instant feedback on their happiness. Participants
can:
• Accurately assess how happy they feel most of the time
• Compare their happiness with similar people
• Track their happiness over time
• Chart how much they enjoy daily activities using the happiness diary
• Compare with similar people who use their time differently

Scientific uses
The website provides longitudinal data on a lot of people at low cost. The
instrument can be used to assess:
• How people really spend their time
• How happy particular people feel during particular activities
• How interventions such as of trainings or organizational change work out on
    happiness, both in the short-run and on the long-term
• How life-choices, such as early retirement, work-out on the happiness of
    particular kinds of people.
The Happiness Diary allows within-person comparisons and as such provides a
better view on causal effects than current cross-sectional studies.

Use for practitioners
Practitioners can use the Happiness Indicator for assessing the effects of their
interventions on happiness.

Origin
The Happiness Indicator started as a joint project of Erasmus University
Rotterdam and insurance company VGZ in The Netherlands. The project started
in 2010 and monitor has now attracted more than 100.000 participants.

Effect on happiness
A first effect study in 2014 among 5000 participants who had used the
Happiness Diary at least twice observed an upward change in average
happiness. This study is reported in 2020 in an article in the International
Journal of Applied Positive Psychology (5, 153-187) entitled Raise of Happiness
Following Raised Awareness of How Happy One Feels: A Follow-Up of Repeated
Users of the Happiness Indicator Website.

Satellite projects
Now that the system is developed, we can host parallel projects in other
countries and variants that focus on specific purposes, such as effect studies.
Satellite projects can draw on a common database and will also contribute to its
enlargement. This prospectus describes the options and costs.

                                         2
Happiness Indicator                                  Prospectus 2021

Contents

1) Aim: Greater happiness for a greater number            5

2) The kind of happiness addressed                        6

3) Use for participants: Tools for getting happier        7
      •   Happiness Comparer                              8
      •   Happiness History                               9
      •   Happiness Diary                                 10
      •   Further self-help tools                         15

4) Use for researchers
                                                          18

5) Use for practitioners                                  19

6) How to join                                            20

7) Standard contract                                      22

                                         3
Happiness Indicator                                               Prospectus 2021

Aim of the Happiness Indicator
Greater happiness for a greater number
The prime aim of this project is to foster happiness. It does so in two ways. In
the short-term it provides people a better view on their own happiness, which
will be helpful in seeking a more satisfying way of life. On the long-term the
project generates information about the effects of major life-choices on
happiness, which information can be used in evidence-based happiness
education.
       The short-term goal feeds the long-term ambition. By providing people
instant feedback on their happiness, the website attracts a lot of regular
participants. Over the years their responses have created the large database
which helps to see how different ways of life pan out on the happiness of
particular kinds of people.

This approach to greater happiness has parallels in health promotion. The short-
term aim of informing people about their own happiness is akin to raising health
conscience. The long-term goal of charting effects of life-choices is akin to
evidence-based health education about the effects of lifestyle.

The Happiness Indicator can also be used by policy makers for getting a view on
conditions for happiness, both of people in general and for particular kinds of
people, such as employees in a firm or pupils in a school.

Approach
Self-help website that generates instant feedback
Particular features of the website are 1) instant feedback using comparison with
participants in a similar life situation, and 2) yearly follow-up of major life
choices.

Participants
Participants are recruited in various ways, such as using advertisements and
media exposure. The project does not aim at representativeness for the general
population. Its aim is to generate information for people seeking ways to a more
satisfying life.

After online registration, users get an e-mail every month with the invitation to
rate their happiness again. Monthly reminders via email are default, but
participants have the opportunity change the frequency of getting such
reminders (either, daily, weekly, monthly, half yearly, or yearly).

The e-mail contains a link to the Happiness Indicator website. On that site
participants provide some profile information and can then use the ‘tools’ for
working on their happiness.

                                         4
Happiness Indicator                                              Prospectus 2021

Kind of happiness addressed
How well one feels
The focus of this Happiness Indicator is on how happy people FEEL, that is, on
the affective component of happiness, which is also referred to as ‘hedonic level
of affect’. This focus on how one feels appears both in the wording of the
questions (How happy do you feel), in the use of smiley’s and in the sequence of
questions (first ‘How do you feel today’).

This focus on affective experience has several reasons. One reason is to bypass
the various distortions that may be involved in the cognitive evaluation of how
successful one is in meeting standards of the good life. Since the tool is to
provide a better view on one’s happiness, people should know how they really
feel most of the time. Another reason is that affective experience appears to be
the more important when it comes to consequences of happiness, such as the
positive effect on health.

Start page Happiness Indicator

                                        5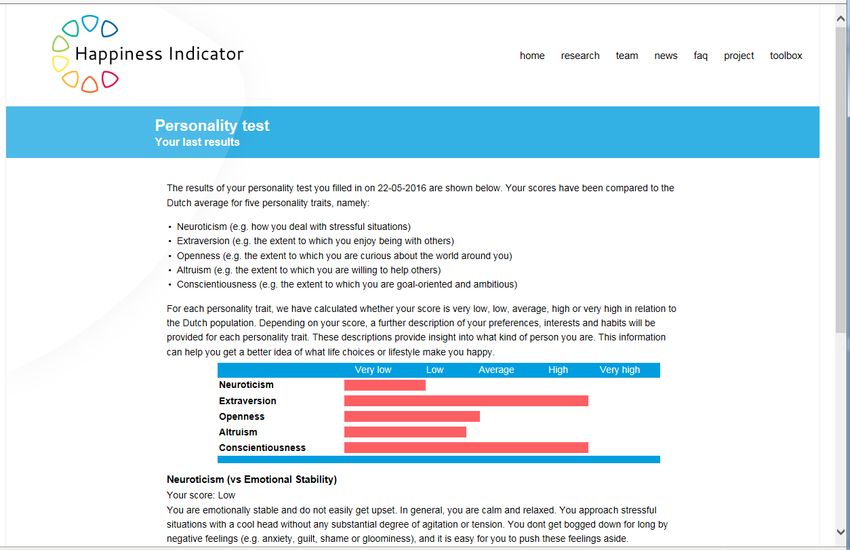
Happiness Indicator                                               Prospectus 2021

Use for participants
Tools in the Happiness Indicator
Many people seek ways to get happier than they are, and this quest reflects is
an increasing stream of self-help books and advisory websites. These tools focus
typically on self-reflection: what kind of person you are, what you really want in
life and what inner restrictions keep you from doing that. They also encourage
reframing: count your blessing and see that the glass is half full rather than half
empty.
       This Happiness Indicator follows a different approach and focuses on facts
about one’s happiness. How happy do you feel most of the time? Could you be
happier than you are now? What changes in your way of life are likely to make
you feel better?

The main tools are depicted on the navigation page of the Happiness Indicator,
the Happiness Comparer and the Happiness Diary.

Navigation page 'Your toolbox'

                                         6
Happiness Indicator                                              Prospectus 2021

Happiness Comparer: Could I be happier than I am now?

You answer two simple questions: How happy they feel today and how happy
they have felt during the last month. They record their answers on a 0 to 10
numerical scale marked with smiley’s. See screenshot 2 below. This task takes
less than a minute.

How happy do you feel?

What kind of person are you?
When participating for the first time, users also answer some questions about
the following personal characteristics:
- age
- sex
- education
- marital status
- employment
- health

This takes about two minutes. The resulting profile is used for later comparison
with people in a similar life situation.

                                        7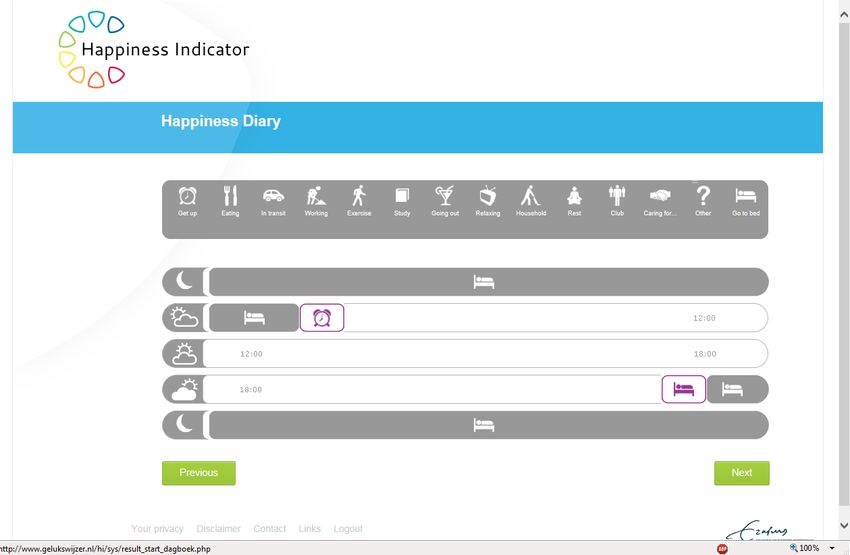
Happiness Indicator                                              Prospectus 2021

Comparison with similar people
Once you have entered how happy you feel currently, the program provides
instant feedback in the form of a comparison with the average happiness of
other participants with a similar profile. See the screenshot below.

This simple tool provides you a better view on your own happiness in the first
place. The questions focus attention on how you actually feel and distinguish
between how you feel at the moment and how you usually feel. Though we have
typically an idea of how happy we are, these notions are mostly less precise; we
tend to remember extremes better than average affect.
       The comparison with similar people is helpful for estimating the chances of
getting happier. Chances are small if you score 9 while the average score of
similar people is 7. Yet chances are better if you score 7 while the average
person like you scores 9. In that case greater happiness is apparently possible in
conditions like yours.
       The standard comparison is with people of the same age, sex, marital
status, income and health. Additionally, you can refine the comparison, such as
by adding education. You can also compare with different people, such as with
people of your age and education who work less. Such a comparison will be
helpful if you consider to reduce your working hours.

                                        8
Happiness Indicator                                                       Prospectus 2021

Happiness History: Track your happiness through time

After recording your happiness three times or more, the system automatically
generates your happiness history and displays that in a time graph. The
Happiness History page also shows how similar people have fared during the
same period. This informs you on how well you are doing relatively.

How happiness has changed over time. Comparison with similar people1

The Happiness History provides more accurate information about how happy you
have felt in the past than your memory typically does. Research has shown that
we tend to remember how we have felt in particular situations, but that we are
bad in recollecting how we felt most of the time. An accurate view on how you
have felt enables a better estimate of why you have felt so. The trend line
further indicates whether you are on the right way or not.
       The comparison with similar people further informs you on whether you
are doing better or worse. If the happiness of all people like us goes down, there
is probably an external factor involved that is probably beyond your control. If
the happiness of similar people goes up, but your happiness goes down there is
probably something going on in your particular situation, which you can possibly
change.

1
  This picture is taken from the version in Dutch since historical data is not yet available
for the new international version.
                                              9
Happiness Indicator                                                 Prospectus 2021

Happiness Diary: What you did and how you felt yesterday

In the Happiness Diary you note what you have done during the previous day
and how happy you have felt during each of the activities. This tool is an internet
application of the ‘Day Reconstruction Method’ (DRM), developed by Nobel
Laureate Daniël Kahneman and his co-workers (2004) as an affordable
alternative for experience sampling. Yesterday’s Happiness Diary works as
follows:

You first ‘reconstruct’ the previous day, recording your activities from rising in
the morning until going to bed at night. You record activities that lasted for 30
minutes or more. Some of the main activity categories are predefined (e.g.
eating, commuting, working, exercise, studying, going out, relaxation,
household, rest, religious or political activity, self- and other care). You can also
define unique activities per timeslot.
       For every activity, you also answer questions about where they were (e.g.
at work, at home or elsewhere) and with whom (e.g. alone, family, friends,
colleagues, boss).

Start screen of Yesterday’s Happiness Diary

                                         10
Happiness Indicator Prospectus 2021
Reconstruction of activities in the previous day: an example
Rating of happiness during each of these activities
11Happiness Indicator Prospectus 2021
The system then computes average happiness during the different kinds of
activities and presents these in a bar-chart.
Estimates of how happy you typically feel can be inaccurate, even if that
estimate concerns the recent past. For that reason, it is worth double checking
your estimates. The Happiness Diary provides such a double check since it
automatically computes a time weighted average of happiness during all
activities of the previous day. If that computed average differs substantially from
your global self estimates on the Happiness Comparer, there is reason to
reconsider.
Again you can compare with comparable people. If these differ less, that is
another reason to have a second look at your global estimate.
How happy one felt during different kinds of activities. Example of a profile
Though we have mostly an idea of what activities we enjoy most and least,
these notions are often inaccurate. For instance, we tend to overestimate our
enjoyment of the time spend with children and underestimate how good we feel
at rest. This tool provides a more precise view and is as such helpful in seeking
ways of life that fit us better.
12Happiness Indicator Prospectus 2021
Comparison with how similar people feel during these kind of activities
Again, the tool allows comparison with similar people and that also enables more
informed decisions.
An example: One of the decisions we face is whether switch to another job or
not. That question is fueled by the fact that we typically feel less happy at work
than during leisure, only academics enjoy work and leisure equally much. In that
context we estimate the chance that we will feel better in another job, but such
estimates are difficult to make and we easily fall prey to the tendency of seeing
greener grass far away. In that context it is useful knowing how much people
like you enjoy their working hours and whether the difference with how they feel
during leisure activities is equally big.
Likewise, you may think that your sex life falls short and consider an extra
marital affair. In that context it is worth having a view on the sex life of people
like you. Do they have sex more often and do they enjoy bedtime with their
spouse more? This tool provides also an impartial answer to that sensitive
question.
13Happiness Indicator Prospectus 2021
Further Self-help Tools
Next to these three tools the website provides also access to the following online
sources for improving your happiness.
Personality test
You can complete a personality questionnaire that covers the big five personality
dimensions, that is, altruism, conscientiousness, extraversion, neuroticism and
openness. Your scores on these traits are compared to the average scores in the
general population, for the time being scores in the Netherlands.
Example of how your personality differs from the average person
14Happiness Indicator Prospectus 2021
Work involvement
You can also complete a questionnaire on work and get online feedback on how
involved you are in your work and how close you are to burn out. An example of
a feedback is presented below
Example of how your work orientation differs from the average person
Links to other tools
In the future the Happiness Indicator will more such additional tools, which will
allow you to keep developing your view on yourself. We will also provide links to
selected self help sites.
15Happiness Indicator Prospectus 2021
Use for researchers
Though devised as a self-help tool in the first place, the Happiness Indicator can
also be used for various scientific purposes.
Technical advantages
Follow-up
The Happiness Indicator generates longitudinal data on a lot of people at low
cost.
Within person comparison
The Happiness Diary also allows comparison of how the same person had felt
during different activities, e.g. how happy a person feels at home and at work.
The difference scores are free of personal characteristics and as such tells a
great deal about causality.
Control groups
The project is particularly suited for effect studies, because matched control
groups can be selected from the large pool of participants, now already more
than 100.000 persons. Scientists can also draw on the available background
information such as on personality and time use.
Tailored variants
It is possible to add modules to the standard Happiness Indicator
Examples of studies that used the Happiness Indicator
To data the Happiness Indicator has been used for the following scientific
studies.
Effect on happiness
A first effect study among 5000 participants who had used the Happiness Diary
at least twice observed an upward change in average happiness. See: Raise of
Happiness Following Raised Awareness of How Happy One Feels: A Follow-Up of
Repeated Users of the Happiness Indicator Website
Happiness and activity among elderly
An early version of the Happiness Indicator was used to track changes in the
everyday activities of elderly people in the Netherlands. The main question was
pattern of activities appears to be most rewarding for what kinds of people,
taking personality into consideration. Results are published in Daily activities and
happiness in later life: The role of work status
Recovery from work
The Happiness Diary was used to track daily activity patterns of workers over
multiple workdays, and found that workaholics feel better when they engage in
16Happiness Indicator Prospectus 2021
physical activity after work Workaholism and daily recovery: A day
reconstruction study of leisure activities
Happiness in trades
The Happiness indicator was used to assess differences in happiness between
employees working in different branches, such as government, education, retail
and industry. Teachers appeared to feel best and workers in the hospitality
industry least. Geluk onder docenten (in Dutch)
Happiness at work
The Happiness Diary was also used for assessing the difference in enjoyment of
time spent working and at home. This difference provides an additional view on
the worker’s satisfaction with work. It appears to be largely unrelated to
responses to common questions on job satisfaction. One of the reasons is that
this difference controls trait satisfaction; a trait-unhappy worker may score low
on a standard question on job satisfaction but feel nevertheless better at work
than at home and behaves accordingly. (Gaucher et al in preparation).
Happiness in regions
The Happiness Indicator has also been used for monitoring happiness in regions
in the Netherlands. This application capitalizes on the large number of
participants. The study showed that people feel better in the northern provinces
of the country than in the south. See Geluksgevoel in Nederlandse provincies (in
Dutch)
Mood during commute
The Happiness Diary was used to assess what pattern of commuting is the least
dissatisfying for what kind of persons. People appeared to feel best when
commuting by bike and worst when using public transportation, but effects
differed markedly across subgroups. Commuting and happiness: What ways feel
best for what people?
The Happiness Indicator provides many more research opportunities, both
because of its method and in view of the variables. To date, there are few large-
scale studies that combine time use and happiness. To our knowledge there are
no datasets at all that provide information of both happiness and life choice.
17Happiness Indicator Prospectus 2021
Facilities for satellite projects
The Happiness Indicator is designed to host parallel projects, both twin projects
in other countries and studies that aim at a particular subject. One reason is that
this will enlarge the pool of participants, a large pool being required for the long-
term goal of charting consequences of life choices. Another reason is that such
cooperation is cost efficient. Costs of development are shared with later users.
Erasmus Happiness Economics Research Organization (EHERO) facilitates use of
the Happiness Indicator in the following ways:
• Data collected with the Happiness Indicator will be managed and – on
request - available in Excel or SPSS format for you to use and perform your
own research.
• We will provide you with an annual descriptive report about the number of
participants, the frequency of participation, profile information of participants
(e.g. to match census data), and happiness levels within your user
population.
• If needed, experts from EHERO can help you to customize your own
Happiness indicator to meet the specific demands of your participants, or to
answer specific research questions. You will have the opportunity to consult
with senior researchers (PhD’s), who are trained to guide you in your
happiness research and perform complex statistical analyses (e.g. multi-level
modeling, structural equation modeling, and so on).
18Happiness Indicator Prospectus 2021
Use for practitioners
Ever more professionals make their living helping people to get happier than
they are. This is partly done in the context of psychotherapy, partly in life-
coaching and partly in education, adult education in particular. Greater
happiness is also a growing issue in organizations and figures in trainings and
organizational design.
Though happiness is a prime aim of these practitioners, they seldom assess the
effect of their interventions on happiness. As a result, interventions a typically
based on theoretical belief rather than on empirical evidence. This hampers the
development of these professions and also limits the market for the services.
This trade would flourish better I clients could be reasonably sure of getting a bit
happier.
For long effect studies were hardly possible in this field, because of the huge
costs involved in long term follow up and the absence of control groups.
The Happiness Indicator makes follow-up much easier and cheaper. Practitioners
can encourage their clients to participate and can thus monitor their happiness
over time. The Happiness Diary also provides a view on behavioral chance that
reflects in time-use. Changes in happiness and time-use can be compared to
changes among similar people selected from the wider pool of participants.
19Happiness Indicator Prospectus 2021
How to join
Costs for satellite projects
How can you setup your own ‘twin project’ and use the Happiness Indicator in
your own country or organization? Below is an overview of costs. All prices are
provisional.
Standard
Basic fee
Є 4.250 start fee, excl. VAT. This allows our ICT-experts to setup a:
• Home website address for your Happiness Indicator project
(http:\\www.happinessindicator.com\’uniquename’)
• A personal page for each user, on which they can access self-help tools
and get feedback
• Client-database to receive profile and self-help data from your participants
This set-up will take about two weeks.
Data file
Є 750 for each file with available data, provided on request in SPSS or Excel.
Storage and web maintenance
Є 500 per year after the year of start.
Optional extra’s and costs:
Translate website into local language
You can translate the website in your local language. Please present translations
in an Excel file. Implementation in your variant of the website will require an
extra fee of 1.700 excl. VAT.
Adding questionnaires
You can add additional questions to the profile to be filled out by your
respondents. We charge 2.550 excl. VAT to add a maximum of 100 questions to
the respondent’s profile. You can also add additional questionnaires to the
toolbox.
Adjusting activities in Happiness Diary
You can adjust the nature of activities in yesterday’s happiness diary at a cost of
4.250 euro (excl. VAT). Please be aware that the diary has a maximum of 14
main activity groups and 6 sub-activities that fall within the main activity groups.
Annual report:
We can manage the data of your clients and provide you with a minimum of one
annual download of your client database. Also, we will provide you with a
minimum of one annual report. The total costs for data management, including
20Happiness Indicator Prospectus 2021
the annual download and report are 11.250 euro. The download can be provided
in either SPSS or Excel. The annual report will contain the following descriptive
information regarding your participants:
• Number of participants and frequency of participation
• Demographic characteristics based on participants profile (age, gender,
educational level, and so on)
• A timeline based on mean daily and monthly happiness of your
participants for that year
• Average time spent and happiness derived from activities as reported in
yesterday’s happiness diary.
Bi-annual or quarterly reports
In addition to the standard one-year report, you may be interested in receiving
reports on a bi-annual or quarterly basis. We will charge an additional 5.200
euro for every report that is ordered in addition to the annual report. The report
will have the same setup compared to the annual report. More complex reports
and/or more specific analyses can be discussed outside of this contract.
All prices are exclusive of VAT.
21Happiness Indicator Prospectus 2021
Standard Contract
Provider
Erasmus Happiness Economics Research Organization (EHERO), Erasmus
University Rotterdam
Dr. Martijn Burger, academic director
Drs. Guy van Liemt, executive director
Burgemeester Oudlaan 50
3062PA, Rotterdam
The Netherlands
Client [your name and contact details]
Agree to the following:
Article 1: Subject of Agreement
1.1
The default version of the Happiness indicator Website will be made available to
the client within one month after signing this contract. Users are free to go to
the website and use the Happiness Indicator after this month. The development
of extra options for users and their costs will be discussed outside this contract.
1.2
Erasmus University Rotterdam holds the rights to update the default version of
the Happiness indicator with questions they deem relevant for scientific research
on Happiness and Well-being.
1.3
The specific webpage of the Happiness Indicator will use a secure protocol
(HTTPS) to ensure anonymity of users on the web. Data will be downloaded in a
secure database, which is only accessible by the ICT department at Erasmus
University Rotterdam to ensure the security of the database.
1.4
The Happiness Indicator home site will contain a standardized text stating the
joint co-operation between Erasmus University Rotterdam and client.
1.5
Users from client will be labeled with a unique TAG. This TAG will be used to
monitor the number of participants from client that use the Happiness indicator,
and to produce a minimum of one annual report for client.
1.6
Erasmus University Rotterdam is not responsible for any type of information
published by client, based on data collected with the Happiness indicator.
22Happiness Indicator Prospectus 2021
1.7
Erasmus University Rotterdam holds the right to use information from client
users for scientific publications on the impact of life choices on happiness. In
such publications, anonymity is ensured by not stating any type of personal
information that threatens user anonymity in any way.
1.8
Joint publications of client and Erasmus University Rotterdam can be discussed
outside of this contract. The discussion will be based on a) the content, b) form
(e.g. book chapter, scientific article, other), c) the timing of publication, d) what
kind of outlet (e.g. scientific, societal).
Article 2: Start, duration, and end of contract
2.1
This contract will start on DD-MM-YY, with a duration of XX year. This contract
will end on DD-MM-YY.
2.2
Before the end-date of this contract, both parties will evaluate the project and
state their intentions regarding continuation/non-continuation of this contract.
Article 3: Evaluation
3.2.
After 6 months, both parties will evaluate their cooperation, discuss potential
problems, and take action to solve these problems if needed.
Article 4: Secrecy
4.1
Employees of client and Erasmus University Rotterdam that are involved in this
contract are bound to secrecy about the subjects discussed in this contract
during the execution of this contract, and after ending this contract.
4.2.
Anonymity of users will always be insured in all types of communication.
23Happiness Indicator Prospectus 2021
Article 5: User rights and Ownership
5.1
The models, methods, and other types of self-help tools developed in the
Happiness Indicator are the intellectual property of Erasmus University
Rotterdam.
5.2
The models, methods, and other tools developed by client will remain the
intellectual property of the client.
5.3
The information users from client provide by participating in the Happiness
Indicator are the ownership of the researchers performing the Happiness
Indicator project at Erasmus University Rotterdam.
5.4
The information users from client provide by participating in the Happiness
Indicator are also the ownership of client. It thus concerns a mutual ownership
of information of clients by Erasmus University Rotterdam and client.
Signatures:
Provider
Erasmus Happiness Economics Research Organization
Erasmus University Rotterdam
3062 PA, Rotterdam
The Netherlands
Dr. Martijn Burger Date:
Academic Director
Drs. Guy van Liemt Date:
Executive director
Client Date:
.. name..
.. affiliation ..
.. address
24You can also read