The Motherson story - April 2018 Photo by Rajarishi Mitra - Samvardhana Motherson Group
←
→
Page content transcription
If your browser does not render page correctly, please read the page content below

The Motherson
story.

April 2018      Photo by Rajarishi Mitra.

01 A brief introduction
   to Motherson.

Motherson.
    Samvardhana
    Motherson Group
    was started in 1975
    as a partnership
    between Late Mrs.
    Swaran Lata Sehgal
    and her son           The name signifies a
    Mr. Vivek Chaand      relationship of trust with
    Sehgal.               all stakeholders.
    .

3
US$ 9.1 Bn
                          approx.
                          in yearly
                          revenues.
                          (FY16-17)

                                       Operating
    Samvardhana                        over 230
    Motherson Group                    facilities in
    (SMG) is one of the                37 countries.
    world’s fastest
    growing specialized
    automotive
    component
    manufacturing                      Over
    companies                          120,000
    for OEMs.                          people.

                           Working
                           with 25
                           joint
                           venture
                           partners.

4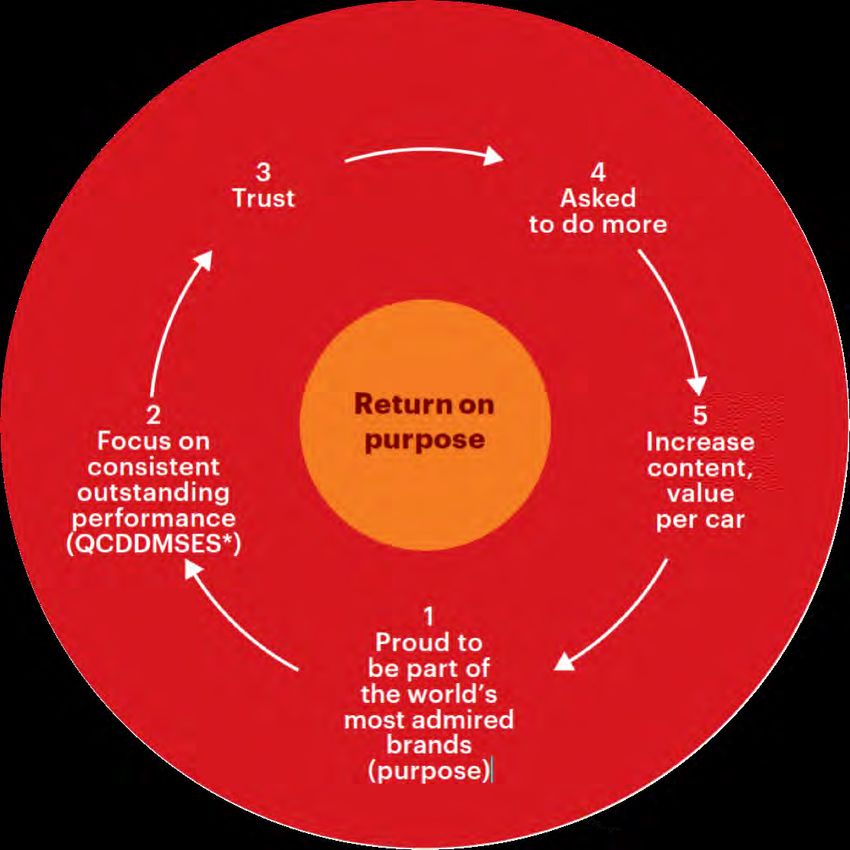
MSSL's core
           business units.                                          % of
                                                                 MSSL sales*.

           • One of the largest manufacturer of   01 Modules,
             IP modules, door trims and
             bumpers for passenger cars in
                                                  bumpers,               51.2%
             Europe & India                       door trims
                                                  and plastic
                                                  parts

           • One of the largest manufacturers     02 Wiring
             of wiring harnesses for passenger    harnesses
             cars in India and for commercial                    26.6%
             vehicles globally

                                                  03 Rear        21.6%

           • One of the largest manufacturer of   view mirrors
             rear-view mirrors globally,

5   *Extrapolated to FY 2017-18
Formulated        To be a
                      globally
    in 1997, the      preferred
    vision of         solutions
                      provider.
    the Group
    has been the
    same all along.

6                                 Photo by Ron W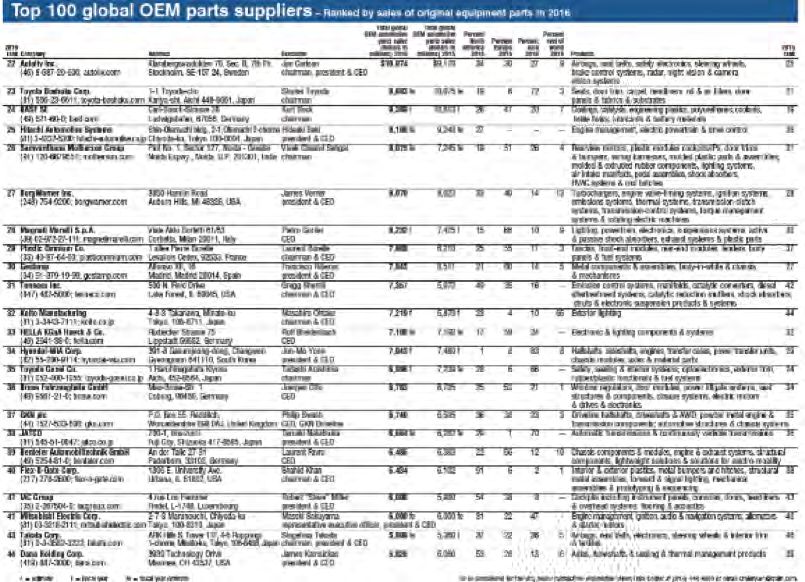
Since 1999-2000 we

             .
                   started to print our
                   targets for the next 5
                   year plans in our
                   Annual Report.

                   Today, Motherson only
                   gives a 5-year guidance
                   with a focus on long
                   term growth

    5 Year Plans
7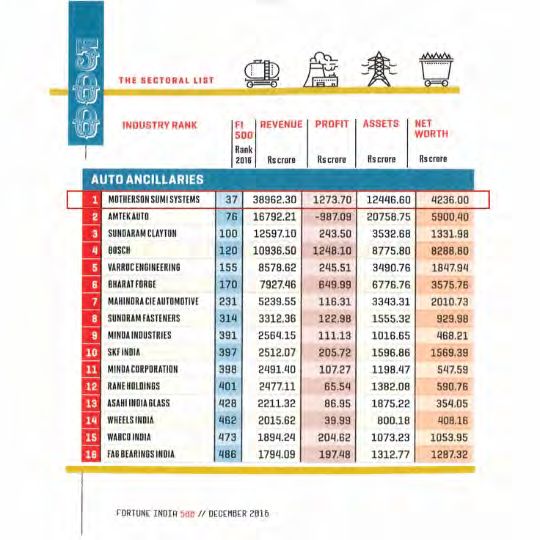
5 Year targets & our
  achievements.
             Target                   Achievement                            Target                    Achievement                     Target                        Achievement
        (as set in 2000)                 (2005)                         (as set in 2005)                  (2010)                  (as set in 2010)                      (2015)
                                                                                                                           Make MSSL a 5 Billion Dollar     Achieved
                                   Achieved                   Make MSSL a Billion Dollar            Achieved               Company                          USD 5.5 Bn
To cross Rs. 1000 Crore            Rs. 1029 Crores*           Company                               USD 1.5 Bn
(Consolidated) by the year 2005                                                                                            70% of our consolidated
                                   *taking full turnover of
                                                              60% of our consolidated turnover      Sales from             turnover should cater to the     Sales from customers
                                   JVs
                                                              should cater to the requirements of   customers outside      requirements of our customers    outside India is 85%
                                   Sales from                 our customers outside India           India was 70%          outside India
Achieve 30% of sales from global
                                   customers outside                                                                       Global Presence in 26-27
customers                                                     Contribution from any individual      Single largest                                          Presence in 25 countries
                                   India was 29%                                                                           countries
                                                              customer in our turnover shall not    customer
                                   Largest customer           be more than 20% of the total         contributed 15% of
Not to have dependence of over                                turnover                              the total turnover
                                   contributed 27% of                                                                                                       26%*
25% on any one source
                                   the total turnover                                                                                                       (on consolidated basis)
                                                                                                    ROCE of 37%
                                                              Strive to maintain business
                                                                                                    (standalone basis)     Achieve ROCE of 40%              36%
Attaining                          ROCE of 39%                ROCE of 40%
                                                                                                                                                            (Excluding Acquisitions done post
                                   (on both                                                         ROCE of 22%                                             announcement of Vision 2015)
Return on Capital Employed of      Consolidated &                                                   (consolidated basis)
40%                                                                                                                                                         41%
                                   Standalone Basis)
                                                              Shift our stated dividend policy of   Dividend Payout                                         (on standalone basis)
                                   Dividend Payout            40% payout of the company’s           Ratio
Dividend Payout Ratio 40%          Ratio was 43% for          profits to 40% payout of the          44% (Standalone)
                                   2004-05                    consolidated Profits                  32% (Consolidated)                                      Dividend Payout Ratio
                                                                                                                           Dividend Payout Ratio of 40%
                                                                                                                                                            37% (on consolidated basis)
                                                                                                                           of our consolidated net profit
                                                                                                                                                            62% (on standalone basis)

                        Consistent Growth with Focus on Target ROCE of 40%
 8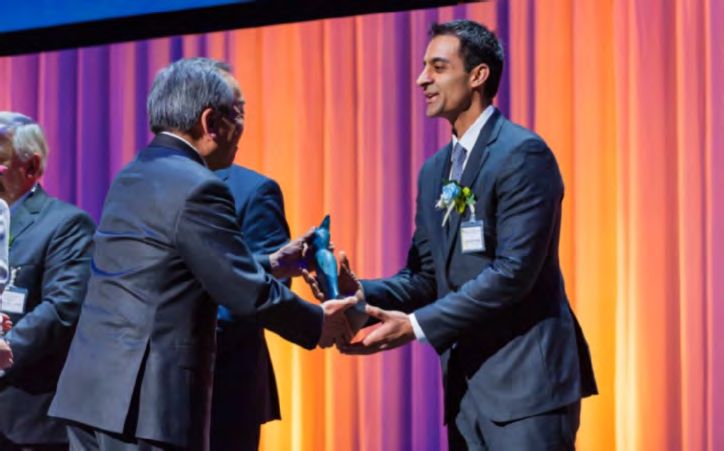
Our 2020
    targets.
                01                                             02

                 $
    Our 5th          18 billion
    five-year                       40% ROCE
                     FY19-20      (consolidated).
    plan.             (MSSL).

                    40% of
                 consolidated     3CX15
                   profit as
                                    (No country, customer or
                                   component should be more
                                      than 15% of our total
                   dividend.                turnover)

                04                                             03

9
Our path
02 growth.  of profitable
Delivering growth while
     statying disciplined.
     • MSSL consolidated revenues
     (Rs. in millions)
                                                                                                                   4,82,042

                                                                                                                   62,200 *

             Within India                                                                            3,65,803      58,617
                                                                                   3,44,903
             Outside India                                                                            48,703
                                                                                    52,590
             Total

                                                                                                                   3,61,225
                                                                                    2,92,313          3,17,100
            193              1,530             10,290             67,022

                              1,528             7,306
            193                                                   20,431
                                 2               2,984             46,591

           1993               2000              2005               2010              2015              2016         2017

         * Revenues of PKC group (acquired at the end of March 2017) of Euro 845.67 million for 2016 on performa
11
The group has integrated 20 acquisitions since 2002,
Acquisitions.
creating synergies while leaving companies to
manage themselves as autonomously as possible.
08
05
Huon Corporation
Dagger Frost Tools
Australia India (Gear cutting tools),
(Door trim business) Strategic business units
purchase
01 09 12 17 21
06
Wexford Electronics Visiocorp Sintermetal SA Abraham and Reydel
ASL Systems
Ireland, (Wiring harness) UK (Rear view Spain, (powder metal Co Ltd Netherlands
UK (Wiring harness),
Asset purchase mirrors) parts), Share purchase Hungary (Plastic (Interior Polymer
Asset purchase
molding automotive Modules), Share
business unit) Purchase
(Proposed)
2002 2005 2006 2007 2009 2011 2012 2014 2016 2017 2018
02 07 10 13
Reiner Precision Empire Rubber Peguform, Scherer & Trier 18
Germany (Machined metal Australia (Rubber moulding Germany (Interior & Germany (Extruded Kobek Siebdruck
components), Asset business), Asset purchase exterior polymer plastic parts), Asset GmbH & Co. KG
purchase modules) Purchase Germany
(Illumination solutions)
11 14 Share purchase
03 Vacuform 2000 Minda Schenk
G&S Kunststofftechnik GmbH Germany (Plastic 19
South Africa
Germany (Plastic injection (Thermoformed molding), Asset PKC Group
moulding), Company purchase polyethylene and blow purchase Finland (Wiring
moulded components) harnesses), Share
15
F.P. Formagrau
04 Acquisitions Stoneridge Inc
Purchase
Czech Republic (Plastic at the behest Wiring Harness
division 20
injection moulding), Company Myoung Shin Global
purchase of our USA (Wiring harness)
India
customers. 16
Magneti Marelli Shock
India (Sheet Metal &
Frames), Share Purchase
Absorbers Pvt. Ltd
India (Stake purchase)
12Proposed acquisition of Reydel.
Reydel Financial Highlights
• MSSL’s subsidiary SMRPBV, has executed the transaction documents $ million CY17P1
for the proposed acquisition of Reydel Automotive Holdings B.V. and Revenues 1,048
Reydel Automotive Management B.V on April 02, 2018 EBITDA 68
• Reydel Automotive is an established global supplier of Instrument EBIT 48
Panels, Door Panels, Console Modules, Decorative Parts and Cockpit Gross Debt 25
Modules, Cash 88
1. Unaudited US GAAP figures
• The company has strong customer relationships (25+ years average) with
global OEMs and its top customers include PSA, Renault, RSM, Reydel Product Portfolio
SsangYong / Mahindra, VW and GM Instrument Panels Door Panels
• Transaction is structured under a Lockbox arrangement from 1 Jan 2017;
all business cash flows from lockbox date to accrue to buyer
• The proposed transaction to be discussed with employee representatives
and would be subject to customary closing conditions and receipt of
required regulatory approvals. Indicatively, it is expected that the
transaction will take 4-6 months to close. Console Modules Cockpit Modules
• Consideration is expected to be financed using existing cash and
banking limits at SMRPBV and estimated to be EPS accretive from Day 1
Aggregate equity Decorative Parts
purchase price of
USD 201 million for
16 20 5,650
100% stake in the countries facilities employees
Target Entities
13Motherson and Reydel –
Combined Geographic Over 250
facilities in
Overview. 41 countries.
NETHERLANDS ESTONIA
CZECH
GERMANY POLAND REPUBLIC HUNGARY
FINLAND LITHUANIA RUSSIA SLOVAKIA
UK
IRELAND
JERSEY
FRANCE
SERBIA
USA PORTUGAL SOUTH KOREA
MOROCCO JAPAN
SPAIN CHINA
INDIA
MEXICO LUXEMBOURG PHILIPPINES
ITALY HONGKONG
THAILAND
CROATIA
SINGAPORE
BRAZIL MACEDONIA
CYPRUS
SRI LANKA
ARGENTINA
SOUTH MAURITIUS UAE INDONESIA AUSTRALIA
AFRICA
14Customer-wise
revenue breakup. ROLLING
STOCK
3CX15
Existing Pro-forma
15%
Audi 21%
Others 16%
21%
Paccar 11%
2% Daimler 2%
Scania 12%
2%
2%
Suzuki
5%
TATA
4% AUTOMOTIVE
2% 7%
Kia VW 2%
1%GM 7% 1%
4%
4%
Hyundai Seat 5%
3% 6% 3%
Ford
6% Porsche BMW PSA Renault Group 5%
3% 5% 1% 4%
3% 4% 7%
4%
Please note that the split in the charts are based on Reydel’s
unaudited CY17 US GAAP figures
CX15 achieved
15 Existing represents sales mix of April – December 17,
extrapolated to full yearGeography-wise
revenue breakup.
3CX15
Existing Pro-forma
Others 9%
9%
India
21%
13% Germany
23% 12%
France
1%
Brazil 5%
3% UK
2%
3%
Korea
3% Spain 2%
Mexico 13% 13%
5%
China 5%
6% USA
Hungary 5%
16%
6%
14%
6%
5%
Please note that the split in the charts are based on Reydel’s
unaudited CY17 US GAAP figures
16 Existing represents sales mix of April – December 17,
extrapolated to full year40% Payout : Stated Dividend Policy.
20,000 40%
(Rs. in millions)
37%
15,543 33%
16,000 32% 32%
30% 30%
29%
12,922
12,000
PAT
20%
Dividend Payout 8,625
8,000 Dividend Payout Ratio
5,068
10%
3,775
4,000
3,184
2,428
840 786
160 46 268
'- 0%
2000 2005 2010 2015 2016 2017
17Current share capital.
(Rs. in millions)
Total 2,105
QIP & Preferential Share Allotment
FCCB 81
35
Bonus Issue
Right Issue
SMIIEL Merger
Original IPO 1,404
1,323
81
Dilution 35 35
Year Mode %
2005 FCCB 10% 882 1,915
2016 QIP 5.75%
35
1,214 1,214
388
773
35
105 235
283
58 12 12 12 12
35 165 12 12
12 4 4 4 4
58 58 58 58 58 58 58 58
1993 2000 * 2005 * 2010 * 2015 * 2016 * 2017 * 30th Sep 2017
* As of 31st March of corresponding FY
1803 Our "not so secret” recipe.
How
     Motherson
     creates
     value.

20
Strengthening customer
trust via QCDDMSES
2. Cost
performance. 1. Quality
Work at leading
cost levels.
Seamlessly fit global
quality standards of
the customer.
3. Design
Provide design support
for current products
8. Sustainability and new concepts.
Be committed to long-
term greatness rather
than transactional
relationships. 4. Delivery
Deliver globally and
be able follow the
customer where they
need us.
7. Environment
Meet the highest 5. Management
environmental 6. Safety Lead the organisation
standards. Work to the highest with the highest
standards of governance
safety. standards.
21
21Increasing content per car :
a “not yet” company.
Wiring Harness Cockpit Bumper Frontend Module Door Trim
Focus on Interior Lamp Pillar Trim
giving the best
suited Inside Handle
Spoiler
solutions to Air Cleaner Assy.
Fuse Box
customers.
with an open Junction Box
Tail Gates
mind. In the Increasing
process, we Grommets & content per car Compressor
Rubber Parts
increase Shock Absorber
content per Connectors
Outside Handle
vehicle, serve Extruded Plastic
more Parts
Scuff Plate
geographies, Battery Tray
Box Floor Console
get new
technologies, Headlight Pedal Box Assembly
make new
acquisitions, Tail Light Air Intake Manifold
etc. Sheet Metal
Wireless Power
Parts Exterior Mirror Interior Mirror HVAC Systems Body Control Vehicle
Module Electronics
22Top line is vanity.
Bottom line is sanity.
Cash in bank
is reality.
Never pursue
top line for the
sake of topline
only.A strong focus
on ROCE.
• Return on Average Capital Employed (ROACE)
for MSSL in our 5-year plans.
• All time high ROCE for Standalone at 48%
48% Standalone
43%
41%
40% 39%
37% Target
36%
27% 28%
26% Consolidated
24%
22%
Consolidated ROCE,
excluding acquisitions done
post announcement of
Vision 2015
2000 2005 2010 2015 2016 2017
24
24Stable and improving operating margins
and ROCE - Case Study (SMR).
Revenue and EBITDA margins ROCE
(€m)
(%)
2,200 25%
50% 47%
45%
41%
1,700 20% 40%
% 1,575
GR: 14.25 34%
-17 C A 1,394 35%
31%
FY10 1,276
30%
1,200 1,119 15%
25%
993 25%
860 17%
755 20%
700 620 10%
10.5% 10.9% 15% 13%
9.6% 9.8%
10% 6%
200
7.0% 6.5% 5% 5%
5.7%
5.0%
0%
FY10 FY11 FY12 FY13 FY14 FY15 FY16 FY17 FY10 FY11 FY12 FY13 FY14 FY15 FY16 FY17
-300 0%
Revenues EBITDA %
Figures till FY15 are as per IGAAP.
25 Figures from FY16 onwards are as per Ind-AS04 Implications.
Returns to
     shareholders.
                                                             3,620 X which
     • INR 2,500 invested in the MSSL IPO is                   is equal to
       worth INR 9,049,520 (including                           361,881%
                                                                  return
       cumulative dividend)*.

                                                                             Cumulative dividend
                                                                             Capital Value

                                                      268X

                                               85X
                              IPO     8X

                        1993        2000       2005   2010     2018

27   *As on 03rd April 2018
Raising funds, while reducing financing costs.
Finance Cost. Significant improvement in credit rating recognised
and rewarded by investors.
• SMRP (BB+ / - / - ) • SMRP ( BB+ Pos / - /
Ratings • MSSL ( - / - / - ) BB+ Pos)
• MSSL ( -/ Baa3 /- )
Interest 4.1%
rates
3.7%
2.5%
1.8%
• €500mn / • €100mn / • $400mn 5.5 • €300mn 7 yr 1.8%
Debt 7yr / 4.125% 10yr / 3.7% yr 4.875% € (SMRPBV)
raising (SMRPBV) (SMRPBV) eqvl. ~2.5% • Lowest Indian linked
(SMRPBV) non-Govt pricing
May-14 June-15 June-16 June-17
28Motherson is trusted by OEMs globally.
Global Partner for Toyota
Daimler Regional
Contribution
Award
Innovation & Technology
Award from VW
E&Y Entrepreneur of
the Year 2016
29Motherson is trusted by OEMs globally.
Volkswagen Daimler Ford Toyota
Regional Supplier of the Year Best Project
Contribution Award Silver award Performance
Supplier Award for
Innovation & Partnership Best Performance South America ZERO PPM Certificate for Certificate for
Technology Award (support in global growth) Award Supplier of the year Award Quality Delivery
Maruti Suzuki GM Renault Nissan
Excellence in Overall Best
Overall Comprehensive Certificate for Tooling Supplier of QCDM Performance
Performance Assessment Safety Localization the Year Award Awards
30Motherson is trusted by OEMs globally.
Hyundai Tata Mahindra Volvo Honda Cars
Motors
Quality Best Best SPD Quality Excellence Outstanding support
Excellence Supplier Performance Award in Sales Promotion
Honda Motorcycles
Paccar Navistar Foton Ashok Leyland Suzuki Motorcycle & Scooters
Supplier Diamond Excellent Zero Defect Performance Award – Strong CR Efforts in
Performance Supplier Supplier Business Partner New Development VA / VE- HSCS
31Motherson is trusted by OEMs globally.
Caterpillar JCB John Deere
Platinum Level in Strategic Partner in Commendable Partner-level Supplier
Supplier Quality Progress Performance for In Achieving
Excellence Process Chairman’s Award India Business Excellence Program
Komatsu Honda Power Kobelco Tata Hitachi
Products
Significant Supplier
Contribution Performance Preferred Business Significant Contribution
Award Award Partner on Quality
32…the
world’s
most
Volvo
admired
Mahindra
Fiat
Chrysler
Peugeot
Porsche
brands.
Land Rover
Honda Renault
Mazda Toyota
Audi
Navistar Daimler
Hyundai
BMW
Proud
Tata
Motors Tesla Nissan
to be
John
Paccar
Deere
part of…
Suzuki
Ford
Bombardier
GM Volkswagen
33 Photo by Glenn Strong
33Rankings.
SMG’s ranking has gone MSSL ranked No. 1 MSSL is among the Fab
up from 40th in 2014 to auto ancillary in India for 50 companies of Asia
26th in 2016 in global 7 consecutive years by for 5 consecutive years
automotive suppliers Fortune India by Forbes
by Automotive News
34Value creation for all
Stakeholders.
CUSTOMERS INVESTORS
… The world’s leading … The ever growing wealth
automotive brands PROUD TO of our investors
BE
PART OF
EMPLOYEES SOCIETY
… The lives of our employees … The wellbeing of the communities
we work in
35Thank you. “The contents of this presentation are for informational purposes only and for the reader’s personal non-commercial use. The contents are intended, but not guaranteed, to be correct, complete, or absolutely accurate. This presentation also contains forward-looking statements based on the currently held beliefs and assumptions of the management of the Company, which are expressed in good faith and, in their opinion, are reasonable. Forward-looking statements involve known and unknown risks, contingencies, uncertainties, market conditions and other factors, which may cause the actual results, financial condition, performance, or achievements of the Company or industry results, to differ materially from the results, financial condition, performance or achievements expressed or implied by such forward-looking statements. The Company disclaims any obligation or liability to any person for any loss or damage caused by errors or omissions, whether arising from negligence, accident or any other cause. Recipients of this presentation are not to construe its contents, or any prior or subsequent communications from or with the Company or its representatives as investment, legal or tax advice. In addition, this presentation does not purport to be all-inclusive or to contain all of the information that may be required to make a full analysis of the Company, target entitles or the proposed transaction. Recipients of this presentation should each make their own evaluation of the Company and of the relevance and adequacy of the information and should make such other investigations as they deem necessary.”
You can also read