The response of market and policy design to increasing shares of renewables in California and Germany - Dallas Burtraw, Jim Bushnell, Christian ...
←
→
Page content transcription
If your browser does not render page correctly, please read the page content below
Dallas Burtraw, Jim Bushnell, Christian Gambardella, Michael Pahle

   The response of market and policy
       design to increasing shares of
renewables in California and Germany
                Lessons learned and directions for the path ahead

                                                          Report
                                                       April 2019
The response of market and policy design to increasing shares of renewables in California and Germany
Contents
2
Contents
Executive Summary 3 3 Market and policy responses to
increasing shares of renewables 33
1 Introduction 11
3.1 Germany 33
2 The electricity market and policy
3.1.1 Renewable policy adjustments and
architecture in Germany and California:
complementary integration measures 33
Background 14
3.1.1.1 Responses in renewable policy design 33
2.1 Germany 14
3.1.1.2 Responses related to complementary
2.1.1 Liberalization and regulation 15 integration measures 37
2.1.2 Generation: Capacity expansion and 3.1.2 Electricity wholesale market
market structure 16 adjustments 38
2.1.3 Transmission, distribution, and 3.1.3 Transmission system operation
ancillary services 17 adjustments and regional integration 40
2.1.4 Transmission: Capacity expansion and 3.1.3.1 Responses in transmission system
market structure 19 operations 40
2.1.5 Electricity wholesale market 20 3.1.3.2 Regional integration 43
2.1.6 Electricity retail market 23 3.2 California 44
2.1.7 Renewables and climate policy 24 3.2.1 Renewable policy adjustments 44
2.2 California 25 3.2.2 Electricity wholesale market
2.2.1 Liberalization and regulation 25 adjustments 46
2.2.2 Generation 26 3.2.3 Transmission system operation
adjustments 46
2.2.3 Transmission capacity expansion 28
2.2.4 Electricity wholesale market 29 4 Trends and future pathways 49
2.2.5 Transmission, distribution, and 4.1 Electricity pricing model and regional
ancillary services 30 market integration 49
2.2.6 Electricity retail market 31 4.2 Renewable procurement model 51
2.2.7 Renewables and climate policy 32 4.3 Renewable policy design 52
4.4 Demand flexibility and retail rate design 54
4.5 Electrification 56
5 Summary and conclusion 59
6 References 61
Acknowledgements
The authors are grateful for comments by Lion This report was prepared as part of the AHEAD
Hirth, Andreas Löschel, Julia Metz, Kevin Novan, project funded by Stiftung Mercator Foundation
Stephanie Ropenus and Christoph Neumann. and ClimateWorks.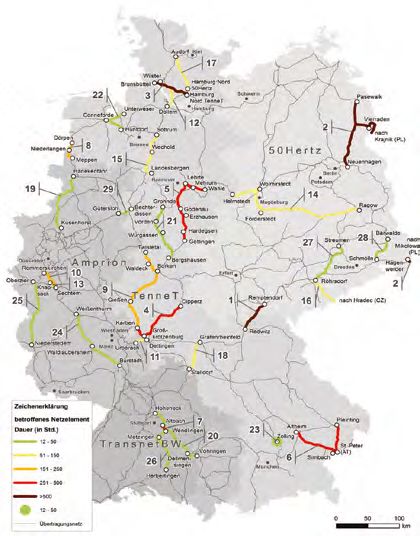
The response of market and policy design to increasing shares of renewables in California and Germany
Executive Summary
3
Executive Summary
Germany and California stand out as two of the in the retail rate components. Regarding the way
world’s leading jurisdictions in transforming their ahead, both jurisdictions have ambitious targets.
electricity systems to accommodate the integra- Germany has set a target for renewables of 80
tion of high shares of renewables. percent of power consumption by 2050 intended
to be the backbone of the energy transition to the
In both jurisdictions, more than 30 percent of elec- “age of renewables,” (Energiewende); California has
tricity consumption is drawn from generation with a target of 60 percent renewables by 2030, and
nonhydroelectric renewable resources (FIGURE ES-1). 100 percent clean energy by 2045—potentially
In Germany, renewable production even surpassed allowing for a role for other technologies to achieve
production from coal for the first time in 2018. Nota- net-zero carbon emissions. These changes frame
bly, this was accompanied by considerable changes another transformation in the expected electrifica-
Figure ES-1 | In-state shares of net generation in Germany (top left) and California
(top right) for 2018 (Source: Fraunhofer ISE and U.S. Energy Information Administration).
Average residential retail price (nominal) in Germany (bottom left) and California (bottom
right) in 2008 and 2018 (Source: Bundesnetzagentur (2018) and own calculations1).
Germany California
1% 8%
Other 14 %
8% Wind
24 % Hydro
Solar
8% Lignite 15 %
Biomass Solar
3%
Hydro
4%
Wind 7%
offshore Geothermal
13 % 2%
17 % Nuclear Biomass
Wind
onshore 10 %
Nuclear 44 %
8% 13 % Natural Gas
Natural gas Hard coal
29,80
23,85
21,65
7,59 Taxes & 15,58 1,58 Taxes &
Other Levies Other Levies
1,14 6,44
7,37 6,79 Renewable Levy 1,34 Procured Energy
Transmission & Distribution
1,16 Transmission
Distribution 5,91
5,90 Wholesale Energy 9,34 Wholesale Energy
8,72 0,79
6,40 3,09
7,22 6,70
3,40
2008 2018 [EUR ct/kWh] 2008 2018 [USD ct/kWh]
1 For further details, please refer to https://energyathaas.wordpress.com/2018/10/08/100-of-what/.
The response of market and policy design to increasing shares of renewables in California and Germany
Executive Summary
4
tion of transportation and potentially heating and electricity crisis the electricity market was sub-
cooling in buildings and industry, possibly leading stantially reformed, resulting in partial reregula-
to substantial growth in electricity consumption. tion. Transmission and distribution services are
regulated, and generation is competitive within a
The experiences in Germany and California offer strong administrative framework that influences
important lessons for other jurisdictions. We con- investment decisions. In 2009, California intro-
sider whether the apparent convergence of policy duced a day-ahead market and locational marginal
and market design in Germany and California will pricing, changes that occurred before renewables
reveal any general best-practice pathways. Alter- became significant and climate change emerged
natively, divergent pathways might suggest that as an overarching focus of policy. Thus the state
best practice will differ among jurisdictions be- was well positioned to accommodate the rapid
cause of different regulatory traditions and other growth of renewables later that decade.
reasons, or that consensus around best practice
has yet to emerge.
“In contrast, Germany started out with
The objectives of the report are threefold: a problematic legacy electricity indus-
1. To provide general background and a history of try structure, which required substan-
climate and electricity policy in Germany and tial responses to growing renewables.”
California, describing important characteristics
of their electricity systems, including regula- In contrast, Germany, which also began to liberal-
tion and market design, actors, and resources. ize its market in the late 1990s, by and large re-
2. To investigate how markets and policies have tained its problematic legacy electricity industry
evolved and improved, and how those trends structure and pursued a relatively disorganized
have been affected by efforts to promote and “just do it” approach (Mitchell, 2010) focused on
accommodate increasing shares of renewables. pushing renewables in the market. Only in the
3. To identify options for the way forward to course of time did the problems and drawbacks
achieve greater integration of renewables and of this approach unfold, for instance in the policy
identify future inflection points where changes cost crisis triggered by uncontrolled deployment
in regulatory policies or market design might of solar photovoltaic. Furthermore, the policy-driven
become essential to achieve this outcome. rapid introduction of renewable generation exacer-
bated the flaws in Germany’s market design. In
Section 1 provides an introduction to the two elec- retrospect the major obstacles to further expan-
tricity markets and the related regulatory frame- sion of renewables, namely grid bottlenecks and
works. In Section 2 we describe in some detail the social acceptance problems more broadly, might
historical development and broader situation in have been avoided through a more carefully planned
both jurisdictions. This provides the backdrop for and integrated policy approach from the start. In
the later analysis of the market and policy design 2011, Germany had its own catalytic event similar
adjustments in response to the increasing share of to California’s energy crisis when the country de-
renewables, and we identify similarities and differ- cided to phase out nuclear power and adopted the
ences relevant for a comparison. long-term renewable target. This had substantial
impacts on both the market dynamics and the
overall policy approach. In response, substantial
“In California, the market reforms adjustments to the electricity system have been
following the 2000-2001 electricity made as explained in more detail below.
crisis positioned the state well to
accommodate subsequent rapid Several differences between the two jurisdictions
growth of renewables.” need to be acknowledged. First, a high share of to-
tal consumption in Germany is provided by import-
In California, efforts were taken in the 1990s to ed hard coal and domestic lignite, whereas in Cali-
deregulate the industry, but after the 2000–2001 fornia, coal generation is located out of state and
The response of market and policy design to increasing shares of renewables in California and Germany
Executive Summary
5
the share of coal has always been smaller. Coal both jurisdictions are trying to go where electricity
now provides 4 percent of total power for California systems have not gone before.2
and will be phased out entirely. Second, the Ger-
man market is highly interlinked with other mar-
kets, not least because it is located in the center “As renewable shares increased,
of Europe, and subject to regulation to enforce the efficiency and equity issues have
EU’s Internal Energy Market. Although California become a major concern for
imports 16 percent of its power from neighboring regulatory responses.”
states, the formal wholesale market linkage has
been limited. Third, industrial customers make up a In Section 3, we build on that background to con-
higher share of consumption in Germany than in sider how markets and policies have been de-
California or its neighboring states: This may ex- signed and reformed to accommodate an increas-
plain why Germany prioritizes industrial processes ing share of renewables in the electricity system.
to make demand more flexible whereas California In general and as pointed out above, we observe
focuses on residential consumers. Fourth, the that in Germany – after a prolonged period of “just
electricity sector in Germany constitutes a larger do it” in which costs were not particularly worri-
share of the nation’s emissions than is true for some – reaching a high level of renewable genera-
California. F
inally, the major share of California’s tion has been accompanied by substantial reforms
retail market is regulated, whereas Germany’s in market and policy design to increase policy
market is completely liberalized. cost-effectiveness and make markets more effi-
cient3. In contrast in California, market policy
changes have been more incremental and were
“Historical differences diminish as not necessarily driven by increasing renewables.
both jurisdictions are trying to go At least lately the evolution of policy in Germany
where electricity systems have not may be viewed as a more careful energy transfor-
gone before.” mation developed through legal and regulatory re-
form, while in California the process has been driv-
Yet the similarities between the two jurisdictions en by experimentation. Both jurisdictions have
outweigh the differences—now and probably even experienced energy cost increases that have
more so in the years to come. Both have chosen sparked some backlash against aggressive poli-
pathways that explicitly provide a diminishing role cies promoting renewables, and both have become
for large-scale technologies like nuclear power concerned with fixing regulatory flaws that some-
and carbon capture and storage as mitigation times provide inefficient or inequitable incentives
pathways. The historical reasons for these choic- for renewable investment. The most important de-
es vary, but the result is a common imperative for velopments and recent trends to accommodate
an expanded role of renewables to meet societal renewables are summarized in TABLE ES-1.
objectives—to grow their economies, to reduce
conventional air pollutants, and especially to ad- The report culminates in Section 4 with an as-
dress climate change. With the recent decision to sessment of policy and future pathways. We eval-
phase out coal, Germany’s energy mix is bound to uate the emerging pathways of electricity sectors
come closer to California’s. Moreover, although in California and Germany from five perspectives.
their regulatory traditions are somewhat different
and the (partly) regulated retail market in Califor-
nia provides policy options not available in Germa-
ny, these differences diminish at a closer look. Fi-
nally, the most important common theme is that
2 See “Is California going the way of Germany when it comes to energy?” San Diego Union-Tribune, 11 November 2018.
3 For lessons for the New Green Deal proposal drawn from the German experience as assessed in this report see: “The
Unrealistic Economics of the Green New Deal” Wall Street Journal, 13 February 2019.
The response of market and policy design to increasing shares of renewables in California and Germany
Executive Summary
6
Table ES-1 | Evolution of electricity sectors to accommodate renewable energy
Germany California
Renewable policy adjustments
Policy design and →→ Increasing policy costs of deployment →→ Primary policy tool remains renewable
complementary precipitated gradual shift b eginning in 2012 portfolio standard (RPS). Targets have been
integration from fixed feed-in tariff (FIT) to competitively adjusted upward several times.
measures auctioned sliding market premium from →→ Beginning about 2010, when RPS started to
2015 on. bind, more stringent requirements c ombined
→→ Increasing grid bottlenecks led to 2017 with smoother procurement process, includ-
introduction of capacity caps in auctions ing guarantee of cost recovery, substantially
for new wind capacity to limit deployment increased capacity.
in grid-constrained regions.
→→ Increasing congestion and curtailment
costs have initiated a shift from physical
dispatch priority for renewables to (partial)
financial dispatch insurance and controlled
balancing by transmission system operator.
Changing market →→ Shift from FIT to auctions and related →→ RPS initially applied to large investor-
structure transactions costs (e.g., permits) created owned utilities (IOUs), later extended to
market entry barriers for distributed renew- publicly owned utilities (POUs) and commu-
ables (typically deployed by households nity choice aggregators (CCAs), to relieve
and small investors) and prompted branch- burden on IOUs.
ing of the policy pathway to establish a
greater role of retail price incentives (e.g.
net metering) alongside auctioning.
Electricity wholesale market adjustments
Market design →→ Increasing short-term volatility triggered To address declining and more volatile short-
strengthening and adaptation of intraday term prices, new market products reward
market to reduce lead time in spot market, flexible generation:
introduce quarter-hour products. etc.* →→ flexible ramping constraint in real-time
→→ Recently, dedicated “integration products” market;
were added to include wind futures and →→ flexible ramping product that makes real-
hedge volume risk.* time payments to specified fast-ramping
capacity;
→→ long-term flexible capacity requirement
that percentage of capacity comply with
resource adequacy requirements by provid-
ing fast-ramping capabilities.
Flexibility →→ Anticipated need for flexible resources and →→ Tariff design and other programs were
EU legislation sparked interest in demand introduced to reduce peak load. Interest in
flexibility, resulting in 2016 legislation that demand scheduling is growing. No adjust-
determines roll-out schedule of smart ments to incentives for renewable supply in
metering infrastructure across consumer the RPS so far.
segments.
→→ Introduction of possibility for distribution
system operators to offer rates with re-
duced grid fees to flexible load.
*Non-regulatory adjustments initiated by the privately operated power exchange.The response of market and policy design to increasing shares of renewables in California and Germany
Executive Summary
7
Germany California
Transmission system operation adjustments
Pricing model →→ Despite increasing congestions, no adop- →→ Locational marginal pricing was adopted in
tion of zonal or locational marginal prices, 2009, but not specifically in response to
mainly for political reasons (transition to higher share of renewables.
such pricing would delay expansion of grid
and cause distributional issues, and insuffi-
cient liquidity in new zones or nodes).
→→ Pricing model Despite increasing conges-
tions, no adoption of zonal or locational
marginal prices, mainly for political reasons
(transition to such pricing would delay
expansion of grid and cause distributional
issues, and insufficient liquidity in new
zones or nodes).
→→ Ongoing redesign of balancing market
products includes renewable and demand-
side resources in power balancing.
Grid →→ Slow expansion of transmission grid caused →→ Reforms to generation interconnection
expansion measures to accelerate grid expansion, in- process to better integrate transmission
cluding centralization of the planning pro- planning with resource planning. A continu-
cess, new coordination measures (e.g. grid ally evolving generation Resource Adequacy
development plan), and streamlining of (RA) framework is attempting to maintain
permission procedures. the financial viability of conventional
resources needed to maintain reliability.
Regional →→ Increasing trade, differing policy priorities, →→ Renewable expansion drives increased
cooperation and European Union regulation led to tech- western US market coordination. Energy
nical cooperation (use of common market- Imbalance Market (voluntary balancing
clearing algorithm, implicit allocation of market) is rapidly expanding into most
transfer capacities through flow-based western US states and British Columbia.
market coupling) with five large interlinked Negotiations are under way to introduce
markets (Pentalateral Energy Forum). day-ahead market.
Improved coordination between system →→ Expansion of California system operator to
operators was triggered by anticipation of US West would dilute California’s influence.
market diffusion of renewables. Concerns about ceding authority to federal
regulators have stalled tighter integration
of regional markets.
Electricity markets. Both jurisdictions are (gener- would benefit from imitating Germany’s regional
ally) on good paths when it comes to their pricing cooperation initiatives. This assessment, summa-
models, procurement practices, and moves toward rized in FIGURE ES-2, is described fully in Section 4.1.
regional integration. (One exception is the increas-
ing grid bottlenecks in Germany, where wind is Renewable procurement. Both jurisdictions have
mostly available in the north and demand is most- moved well past the treatment of renewables as
ly in the south.) There remains room for improve- exotic technologies and now confront the integra-
ment across all these areas, but the way forward is tion of large shares of renewables into their in-
more or less clear. Opportunities to learn from cumbent electricity systems. Distributional is-
each other’s experiences and options going for- sues, such us where to build new plants and how
ward are available. For example, Germany might to distribute the policy costs, have become more
adopt California-style zonal or nodal pricing as a important. Germany relies on a centralized pro-
remedy to the constrained grid, and California curement model. In California’s decentralized ap-The response of market and policy design to increasing shares of renewables in California and Germany
Executive Summary
8
Figure ES-2 | Electricity pricing model and regional market integration pathways
past path / adjustments now future path / trends
pricing model
LMP*
zonal
CA increasing
congestions
?
single zone leading up
DE to LMP?
trading only
CA
regional integration
more integration
PEF**, EU regulation
towards policy
integration (e.g.
trading only joint renewable
DE auctions)
*Locational Marginal Pricing **Pentalateral Energy Forum
proach, the advent of unregulated community renewable procurement. There remain opportuni-
choice aggregators (CCAs) increasingly leads to ties to achieve better integration through im-
customer defections. Going forward, California proved scarcity pricing—that is, to go beyond sup-
faces a choice: either try to adapt its renewable porting generic MWhs and begin taking temporal
policies to a decentralized electricity market envi- and geographic scarcity into account. Furthermore,
ronment or concentrate its procurement decisions climate policy has become an increasingly import-
through a more centralized mechanism that again ant motivation for investment in renewables, and
takes discretion out of the hands of individual re- the challenge is to incorporate renewable technol-
tail providers. This trend is summarized in FIGURE ogy policies into climate policy. Both jurisdictions
ES-3 and described fully in Section 4.2. have a mix of carbon pricing and companion poli-
cies, and the carbon markets (the EU Emissions
Policy design. Although policies vary, both juris- Trading System and California’s cap-and-trade
dictions have evolved toward similar improvement program) are now sufficiently well established to
in cost-effectiveness and increasing stringency of contribute to more stringent emissions reductions.
Figure ES-3 | Renewable procurement
past path / adjustments now future path / trends
decentralized with
many small CCA*?
procurement model
semi-decentralized
CA ?
centralized model
to avoid customer
defection?
centralized
DE
*Community Choice AggregatorsThe response of market and policy design to increasing shares of renewables in California and Germany
Executive Summary
9
Figure ES-4 | Renewable policy designs
past path / adjustments now future path / trends
CA
RPS* → need to go beyond
supporting generic
MWh
policy design
→ increase role of
carbon pricing
auctioned premium
administered FIT**
DE
*Renewable Portfolio Standard **Feed-In Tariff
Less clear, however, is how to align renewable poli- ter technology that would enable such pricing is be-
cies with carbon pricing. Carbon pricing is expect- ing rolled out in both jurisdictions and regulatory
ed to provide a more efficient signal for invest- steps appear imminent. However, the potential of
ment than technology support policies; however, time-based pricing remains largely untapped due
the carbon price is undermined by policies that to issues such as consumer reluctance including
push renewables through subsidies outside the data security concerns, potential distributional
carbon market. How can carbon pricing be posi- issues, and general issues in rate design that con-
tioned so that it plays an effective role in promot- flicting goals of efficient pricing and the recovery
ing technology investments? The recent trends of embedded system fixed costs. FIGURE ES-5,
and potential paths forward are illustrated in FIG- described in Section 4.4, illustrates the lack of
URE ES-4, which is described in Section 4.3. progress to date and suggests possible pathways
forward.
Demand flexibility. The advent of substantial re-
newable generation has exposed the importance Electrification. Both jurisdictions acknowledge a
of variability of renewable energy supply and made role for electrification of transportation, heating/
the activation of demand-side resources a pressing cooling, as well as new industrial processes. The
integration issue. Thus, the fourth domain in the technologies are either already becoming available
evolution of markets and regulation is to align de- or at least are in an early stage of development.
mand with the timing of renewable availability. For The absence of physical infrastructure, for example
many economists, time-based electricity prices for electric vehicle charging and other functions, the
provide an intuitive option to achieve this coordi- lack of a regulatory framework, and immature market
nation (“getting consumer prices right”). Smart-me- institutions represent barriers to integrating supply
Figure ES-5 | Demand flexibility and retail rate design
past path / adjustments now future path / trends
consumer participation
CA → manage surplus and
volatile generation
→ lack of demand response through making demand
→ supply-sided resource adequacy more flexible
→ focus on managing peak-load → enable both fixed cost
recovery and efficient
DE pricingThe response of market and policy design to increasing shares of renewables in California and Germany
Executive Summary
10
Figure ES-6 | Mainstreaming electrification
past path / adjustments now future path / trends
CA
ZEV* target & program
electrification
→ provision of
infrastructure
→ mitigation of distorted
“electrification
EV** targets 2020 and 2030 (subsidies) incentives”
DE → electrification targets in
other sectors?
*Zero Emission Vehicle **Electric Vehicle
and demand in market equilibria and obstruct the California and Germany now face several questions.
electricity sector’s potential role in decarbonization What role can carbon pricing play for decarbonizing
of the broader economy. FIGURE ES-6, drawn from the power sector? Will companion policies needed
Section 4.5, illustrates the lack of progress to date or eventually be phased out? And finally, what is
for electrifying transportation and suggests possible the appropriate medium-term target for renewables?
pathways forward. The expected rapid expansion of the use of elec-
tricity and displacement of emissions from direct
These five perspectives describe a shifting para- combustion of fossil fuels in other sectors may
digm. Up to the present, renewables have been de- make expanding the role for electrification a high-
ployed for technology development and co-bene- er priority than complete decarbonization of the
fits, such as creating jobs and improving air quality, electricity sector. At the same time, at least in
but increasingly they are being put into the service Germany grid bottlenecks and the scarcity of new
of climate action— to electrify and decarbonize sites constitutes a barrier that increasingly limits
other sectors. This objective would make renew- renewable expansion.
ables the centerpiece of the electricity system.
We find that Germany and California are headed in Germany and California offer ongoing opportuni-
the same direction, asking the same questions, in ties for joint experimentation and exchange of
trying to achieve this outcome. ideas. Their experiences to date provide lessons
not only for each other but also for other jurisdic-
tions moving along the path toward a decarbon-
“Both jurisdictions are entering a new ized economy.
round of market and policy design in
search of solutions to expand the role
of electrification.”
Section 5 concludes with the observation that
Germany and California are converging on a path-
way that requires new policies and legislation—and
ultimately, policy innovation. Many policy choices
are still in the proposal stage, but their eventual
implementation will initiate a new round of market
and policy design, which will once again push the
frontier and generate new evidence on how even
higher shares of renewables can be integrated.The response of market and policy design to increasing shares of renewables in California and Germany
Introduction
1 Introduction 11
GERMANY AND CALIFORNIA STAND OUT AS TWO OF THE WORLD’S LEADING JURIS
DICTIONS IN TRANSFORMING THE ELECTRICITY SYSTEM TOWARD HIGH SHARES OF
RENEWABLES.
Germany has a target for renewable generation of On the way toward their targets, both jurisdictions
80 percent of overall power consumption by 2050. seem to have reached an inflection point: whereas
As of 2018, the share of non-hydro renewable gene the previous focus of regulatory attention was to
ration in total net electricity generation amounted achieve substantial levels of market penetration,
to 37 percent, with almost 80 percent of that en- the relatively high shares that have been achieved
ergy coming from variable renewable energy increasingly necessitate a new focus: integration
sources—wind and solar (FIGURE 1).4 In the first half of renewables into the operation of the grid. Now
of 2018, renewable production exceeded produc- that the first major milestone in the transformation
tion from coal for the first time.5 California has set of the energy industry has been reached, we can
a target of 60 percent renewables by 2030 and look back on the actions that have brought us here
100 percent clean energy by 2045. As in Germa- and seek insights for other jurisdictions.
ny, by 2018, close to 32 percent of California’s net
electricity generation was based on non-hydro Deep decarbonization will require changes in pre-
renewable energy sources6, with more than two vailing market and regulatory designs. Current
thirds coming from solar and wind. systems are fundamentally tailored to dispatchable
generation from fossil or nuclear fuels. As tradition
Figure 1 | In-state shares of net electricity generation in Germany and California, 2018.
Sources: Fraunhofer ISE, U.S. Energy Information Administration.
Germany California
1% 8%
Other 14 %
8% Wind
24 % Hydro
Solar
8% Lignite 15 %
Biomass Solar
3%
Hydro
4%
Wind 7%
offshore Geothermal
13 % 2%
17 % Nuclear Biomass
Wind
onshore 10 %
Nuclear 44 %
8% 13 % Natural Gas
Natural gas Hard coal
4 Net electricity consumption amounted to about 508 TWh in 2018, of which about 30% have been covered by wind and
solar energy (Fraunhofer ISE). For further details, please refer to: https://energy-charts.de/energy_de.htm?source=all-sources&
period=annual&year=2018.
5 https://www.bdew.de/presse/presseinformationen/erneuerbare-ueberholen-erstmals-braun-und-steinkohle-bei-der-
stromerzeugung/.
6 California’s renewable goal covers generation from wind, solar, geothermal, biomass, and small hydroelectric facilities.
This target is additional to generation from large hydroelectric facilities. http://www.energy.ca.gov/renewables/tracking_
progress/documents/renewable.pdf.The response of market and policy design to increasing shares of renewables in California and Germany
Introduction
12
ally configured, markets take power from any of- main observations are summarized in the Execu-
fering based on short-run (marginal) cost to meet tive Summary (TABLE ES-1).
mostly inflexible electricity demand. The growing
share of generation from low-marginal-cost, vari- A major finding is that in Germany, the increase in
able renewable resources presents challenges, in- renewable generation has been accompanied by
cluding a decline in wholesale market revenue and reforms to increase policy cost-effectiveness and
a temporal shift in the demand for dispatchable make markets more efficient, whereas in Califor-
generation to hours when variable resources are nia, market policy changes have been more incre-
not prevalent. To accommodate a growing share of mental and were not necessarily driven by increas-
renewable generation, new designs need to expand ing renewables. In the German case, the changes
the opportunities for system flexibility in its many are all the more remarkable because the country
variants, including scheduling of demand, price- has been criticized in the past for its unsuccessful
responsive demand, and storage, as well as a more liberalization (Joskow 2008). Indeed, there are
efficient use and supply of renewable power—for some apparent deviations from the trend toward a
example, through expanded transmission and dis- more efficient market—for instance, the continued
tribution capabilities. Furthermore, the ambitious use of a single price zone for the whole German
climate policy targets in both Germany and Cali- market. In contrast, although California has con-
fornia call for the electrification of transportation tinued to add enhancements to its wholesale mar-
and buildings; that means the power sector needs ket, a main change wrought by increasing renew-
to grow. Expanded electrification brings the oppor- ables has been to push its market toward tighter
tunity for new investments in renewable electricity integration with neighboring electricity systems.
generation. With battery and thermal storage, the
more flexible temporal nature of electricity demand The third objective is to identify issues that should
in these sectors may provide new opportunities receive more attention if the share of renewables
for integrating the growing generation from inter- is to increase even further. These issues include
mittent renewables. Such challenges, which con- the role of demand-side flexibility through time-
front both jurisdictions, are just a few among many based pricing, the need to reconcile retail tariff
that need to be solved if the renewable transfor- design with fixed-cost recovery, and challenges in
mation is to reach the next level. Adjustments in electrifying final energy demand. Special attention
market and regulatory design, regarded as the will also be given to clean energy policies and the
least-cost way to address them (cf. NREL 2014; role of carbon pricing for driving the transforma-
Pérez-Arriaga et al. 2017), are the focus of this re- tion. In the final section of this report, we discuss
port. the potential convergence of the policy pathways
in Germany and California toward either model or
This report has three objectives. The first is to pro- a new third way, identifying approaches that one
vide general background and history of climate and jurisdiction may adopt from the other to address
electricity policy in California and Germany by de- integration challenges.
scribing characteristics of their electricity systems,
including regulation and market design, actors, A related scientific literature evaluates how the
and resources. market has evolved thus far, and how it might en-
able further penetration of renewables. For exam-
The second objective is to draw lessons and in- ple, Schmalensee (2012) evaluates previous poli-
sights on how market and policy design has en- cies to increase renewable electricity generation
abled and responded to increasing shares of re- in several US states. Pollitt and Anaya (2016) con-
newables. The discussions will be comprehensible duct a comparative study of Germany, the United
for nonexperts in the economics of market design, Kingdom, and New York State and discuss whether
but at the same time, we aim to convey specific their electricity markets can cope with future high
features and mechanisms and describe the ratio- shares of renewables. Yet a thorough analysis of
nale and motivation for regulatory policies. Our design and policy response in economies at theThe response of market and policy design to increasing shares of renewables in California and Germany
Introduction
13
forefront of the energy transition, such as Germa- which in both Germany and California have changed
ny and California, is missing. considerably in recent years, and which are at least
partly indicative of the effects of (and responses
The report is structured as follows. In Section 2 to) higher shares of renewables. In Section 4 we
we provide a short historical account of the evo turn to market and policy design that we perceive
lution of the electricity systems of Germany and as crucial for transitioning to an efficient and equi-
California so far, as background for the subsequent table low-carbon power system. Finally, Section 5
analysis. In Section 3 we trace how market and concludes with a summary of the lessons learned
policy design has responded to increasing shares from comparing the two energy transition front-
of renewables in both jurisdictions. This section is runners and assesses the transferability of the
structured by retail price components (FIGURE 2), resulting insights to other jurisdictions. 7
Figure 2 | Average residential retail price (nominal) in Germany (left) and California (right)
in 2008 and 2018. Source: Bundesnetzagentur (2018), own calculations7
29,80
23,85
21,65
7,59 Taxes & 15,58 1,58 Taxes &
Other Levies Other Levies
1,14 6,44
7,37 6,79 Renewable Levy 1,34 Procured Energy
Transmission & Distribution
1,16 Transmission
Distribution 5,91
5,90 Wholesale Energy 9,34 Wholesale Energy
8,72 0,79
6,40 3,09
7,22 6,70
3,40
2008 2018 [EUR ct/kWh] 2008 2018 [USD ct/kWh]
7 For further details, please refer to https://energyathaas.wordpress.com/2018/10/08/100-of-what/.The response of market and policy design to increasing shares of renewables in California and Germany
The electricity market and policy architecture in Germany and California: Background
14
2 The electricity market and policy
architecture in Germany and California:
Background
THIS SECTION PROVIDES THE HISTORICAL BACKGROUND TO THE CURRENT STATUS
OF BOTH MARKETS, FOR READERS WHO ARE NOT FAMILIAR WITH THE SYSTEMS. THE
COST-EFFECTIVENESS AND DISTRIBUTIONAL OUTCOMES STEMMING FROM PAST
MARKET DESIGN AND POLICY RESPONSES WILL BE DISCUSSED IN THE SUBSEQUENT
SECTION.
2.1 Germany of a new renewables support scheme in 2000, and
the nuclear phase-out decree in 2002. An over-
Three major decisions have shaped the develop- view of these decisions and related events is pro-
ment of Germany’s electricity sector: the liberal- vided in TABLE 1.8
ization of the market in 1998, the implementation
Table 1 | German electricity market regulation and policymaking, 1996–2017
Event Date Description
Liberalization (EU level)
First EU Internal Energy Market 1996 Required member states to implement restructuring
Package (Directive 96/92/EC) regarding generation and transmission ownership, retail
competition, and grid access to third parties (introduced in
national law in 1998)
Second EU Internal Energy Market 2003 See below.
Package
Third EU Internal Energy Market Package 2009 See below.
EU communication, Clean Energy for All 2016 See, e.g., http://fsr.eui.eu/wp-content/uploads/The-EU-
Europeans (“Winter Package”) Winter-Package.pdf
Renewable and climate policy (EU and national level)
Electricity Feed-In Act 1991 Original feed-in tariff, predecessor of Renewable Energy
Sources Act
Renewable Energy Sources Act (RESA) 2000 Comprehensive technology-specific feed-in; dispatch priori-
ty for renewable energy generation, first deployment target
formulated
EU Emission Trading System (ETS) 2005 Emissions trading implemented to achieve Kyoto targets
launch (–12 % by 2012); covers energy and energy intensive indus-
try sectors
Energy Concept 2010 Energiewende decision: 80% renewable energy in 2050;
long-term climate goals (–80 %/95 % in 2050)
8 The most important sources we draw on are policy documents, monitoring reports from government agencies, such as the
Federal Grid Agency (Bundesnetzagentur, BNetzA), and scientific publications. Also included are EU-level policies and
regulation, which have been the major driver for liberalization in Germany.The response of market and policy design to increasing shares of renewables in California and Germany
The electricity market and policy architecture in Germany and California: Background
15
Event Date Description
Act on the Digitization of the Energy 2016 Selective roll-out of advanced metering infrastructure,
Transition definition of technological requirements and data security
standards
RESA Amendment 2017 Public tender or auctions for renewable energy support
Nuclear energy policy (national level)
Nuclear phase-out act 2002 Decision to phase out nuclear power by 2022 by limiting
maximum hours of further operation
Prolongation of nuclear phase-out 2010 Remaining operation time extended by 8 years for older
plants and 14 years for new plants
Prolongation revoked and moratorium 2011 In aftermath of Fukushima, immediate shutdown of eight
for older plants oldest plants, 2002 lifetime limitation restored
2.1.1 Liberalization and regulation ed to increase again. According to Joskow (2008),
Historically, the German market was organized in Germany’s decision to refrain from sector regula-
regional monopolies served by vertically integrated tion after the market was opened up and instead
utilities (Brunekreeft and Bauknecht 2006). Mono to continue relying on negotiated prices had been
polization was institutionalized not by federal law a clear mistake. During the early 2000s, renew-
but through cartel agreements based on legally ables began to enter the market, driven by the
enforced demarcation contracts. The government feed-in tariff scheme, but by and large were still a
never actively regulated the sector but, in line with niche. In 2005, the share of wind energy in total
German tradition, entrusted utilities to resolve net electricity consumption was below 5 percent, and
work access and network charges through volun- the share of solar energy was negligible9.
tary negotiations controlled by the cartel office
and arranged collectively in so-called association The unregulated German electricity sector began
agreements. With this combination of monopoliza- to change with the EU’s second electricity market
tion and lack of regulation, Germany was the ex- package, in 2003. Implemented into national law as
ception in Europe. the 2005 Energy Act, it altered regulation for net-
work charges and investments, unbundled trans-
A push toward liberalization began with the EU’s mission system operators (TSOs) and distribution
first so-called electricity market package, adopted system operators (DSOs), and created a regulatory
in 1996 and implemented in national law in 1998 agency, the Federal Grid Agency (Bundesnetzagen
(Meeus et al. 2005). Its main purpose was to grad- tur, or BnetzA). In the following years, a strong whole
ually and partially open up the market for compe- sale market developed and the European Energy
tition, with the long-term vision of creating an EU- Exchange gained increasing importance as a trad-
wide internal market for energy. Competition was ing platform (Pfaffenberger and Chrischilles 2013).
introduced, but the market was not restructured, In addition, the European Commission (EC) took on
nor were supporting regulatory institutions created. the role of watchdog for competition and notably
Lack of regulation led to an increase in concentra- initiated an antitrust case against E.ON that even-
tion through mergers that eventually resulted in tually resulted in the company’s selling a fifth of
the dominance of Germany’s “big four” suppliers its generation capacity and parts of its distribution
(E.ON, RWE, Vatenfall, EnBW), which from 2000 on, grid. The EC also conducted a sector inquiry to bring
controlled around 90 percent of the market. In the still high concentrations of generation owner-
consequence, although prices had initially fallen ship in many European markets to regulators’
after the liberalization law took effect, they start- attention.
9 See https://www.energy-charts.de/energy_pie_de.htm?year=2005.The response of market and policy design to increasing shares of renewables in California and Germany
The electricity market and policy architecture in Germany and California: Background
16
The third and most recent electricity market reform the regional monopolists eventually formed Ger-
package, adopted in 2009, paved the way for stron- many’s big four (Section 2.1.1). More than half of all
ger supranational governance.10 Its main pillars are production was coming from coal (both lignite and
more effective unbundling, increased market trans hard coal), and another 30 percent from nuclear.
parency, more effective regulatory oversight by Remaining suppliers were mostly small municipal
national authorities, establishment of the Agency utilities.
for the Cooperation of Energy Regulators (ACER),
and better cross-border collaboration and invest- That market began to evolve at the turn of the
ment organized through a new European Network millennium. Liberalization led to an entry of new,
for Transmission System Operators.11 ACER is as- smaller players that mostly invested in relatively
signed the task of developing EU-wide “framework risk-free gas plants. In parallel, the first nuclear
guidelines,” which set principles for developing phase-out, decreed in 2002, initiated a “dash for
specific network codes—for example, rules on coal” (Pahle 2010), with major investments in new
management of the electricity transmission sys- hard coal and lignite plants to replace the nuclear
tem in emergencies and blackouts. Through the capacity. This happened even as the EU Emissions
technical network codes, the EC now indirectly ad- Trading System (EU ETS) was being implemented
vances harmonization and liberalization of member in 2005 because the German government priori-
states’ electricity markets. For example, a network tized ending the use of nuclear energy over climate
code for electricity balancing defines common rules concerns and granted free emissions allowances
of an EU-wide balancing market. to new coal plants. Of the new plants, a few were
projects by foreign utilities, like France’s GDF Suez,
2.1.2 Generation: Capacity expansion and but most belonged to Germany’s big four. How
market structure ever, as FIGURE 3 shows, over time their share
At the start of the 2000s, the German market was decreased because of new players and additional
characterized by high concentration and dominated regulatory intervention, like the EC’s antitrust
by coal and nuclear generation sources. Mergers of case against E.ON (Section 2.1.1).
Figure 3 | Market concentration in Germany, 2007–2012. Source: Brunekreeft et al. (2016).
100%
Shares in Electricity Generation (2007 = 100%)
90%
80%
70%
60%
50%
40%
30%
20%
10%
0
2007 2008 2009 2010 2011 2012
”Big 4“ Other (Incumbents & Third Parties)
10 See, for example, http://onlinelibrary.wiley.com/doi/10.1111/j.1468-5965.2010.02140.x/full.
11 http://europa.eu/rapid/press-release_MEMO-11-125_de.htm?locale=en.The response of market and policy design to increasing shares of renewables in California and Germany
The electricity market and policy architecture in Germany and California: Background
17
Figure 4 | Installed renewable energy generation capacity in gigawatts (GW)
by type of owner13 and sector for 2012 and 2016. Source: Energy Atlas (2018).14
Community Energy Participants Financial and Strategic Investors Large Power Generating Companies
9 16 2 6
34 42 18
20
18
30 41 20
All renewables 2012 [GW] All renewables 2016 (GW) Solar PV 2016 (GW) Wind 2016 (GW)
Renewable generators were a major new factor in ables like rooftop solar PV, while project develop-
the sector. The German Green Party, which was part ers built utility-scale renewables like wind farms.
of the government that implemented the Renewable The emergence of new firms and the declining
Energy Sources Act (RESA) in 2000, deliberately market concentration among electricity genera-
designed that policy to create new and smaller tors are thus the result of the substantial integra-
players. This was partly for political reasons but tion of renewable energy sources (Brunekreeft et
also because the incumbents opposed renewables al. 2016). 13 14
and were highly reluctant to change their traditio
nal business model, which focused on large central- 2.1.3 Transmission, distribution, and ancillary
station plants. For instance, in 2005 the big four services
utilities’ combined ownership of wind plants was The organization of the German electricity trans-
just around 250 MW (Stenzel and Frenzel 2008). mission system is typical for power grid operation
Larger scale12 made investment in renewables and management in most EU member states. Be-
more attractive, in particular in the emerging off- cause member states were free to decide on the
shore wind market. Nonetheless, the share of re- national implementation of EU electricity market
newable generation assets held by the large com- reform, and each state still sought to be self-suffi-
panies and their new “green” subsidiaries remains cient, national bidding zones were mostly national
relatively small: in 2016 the portfolio of two largest (the German-Austrian bidding zone being the only
utilities, E.ON and RWE’s subsidiary, Innogy, includ- exception, until recently). With these national bid-
ed just 510 MW and 862 MW, respectively, accord- ding zones, uniform pricing instead of locational
ing to their annual reports. This amounts to less than marginal pricing became the standard at the na-
3 percent of total installed wind (onshore) capacity. tional level, with Denmark, Sweden, Norway, and
Italy being the exceptions in Europe (Egerer et al.
Attracting small actors was accomplished by a 2016). This implies that the allocation of energy
combination of a guaranteed feed-in tariff and and transmission occurs separately. For the Ger-
priority dispatch, which guaranteed risk-free re- man market, this means that energy is traded on
turn. In 2012, ownership of renewable capacity exchanges and bilaterally (“over-the-counter,” OTC),
was dominated by households, small business, whereas the allocation of transmission capacity is
and project developers (FIGURE 4). Households and basically determined by four privately owned TSOs—
small businesses invested in decentralized renew- Tennet, Amprion, Transnet BW, and 50Hertz—which
12 The largest onshore wind park in the country has a capacity of around 180 MW.
13 Community energy participants include e.g. fund investments, regional energy cooperatives, individual owners, farmers and
farm cooperatives.
14 The Energy Atlas 2018 can be found here: http://www.foeeurope.org/sites/default/files/renewable_energy/2018/
energy_atlas.pdf.The response of market and policy design to increasing shares of renewables in California and Germany
The electricity market and policy architecture in Germany and California: Background
18
own and operate the high-voltage grids in their Figure 5 | Grid control areas of Germany
respective regions (FIGURE 5). The federal regulato- and responsible TSOs. Source: Netzentwicklungs
ry authority supervising these companies is the plan Strom 2030, Version 2019. (Abb.1).21
Federal Grid Agency.
Hence, once the day-ahead and intraday15 mar-
kets are cleared (Section 2.1.5, FIGURE 8), the Ger-
man Energy Act (§13 EnWG) requires that TSOs
keep grid frequency at 50Hertz at every instant of
time to guarantee the reliable functioning of the
German power system. This includes the provision
of corrective and preventive measures, also called
ancillary services in Germany. Ancillary services16
consist of congestion management measures such
as redispatch17 and countertrading, or counterflow,18
as well as the provision of different types of bal-
ancing or control power and energy to correct for
short-term imbalances in the grid region. Through
specific auction formats, TSOs procure sufficient
balancing power ex ante, which they can call on as
needed. TSOs determine their demand for balanc-
ing power based on predetermined operating re-
serve requirements.19 In response to the actual im-
balances in a specific grid region, TSOs demand
balancing energy from the suppliers of balancing
power in real time.20 The corresponding costs, like
all costs accruing from TSOs’ reliability services,
are allocated among the final consumers.21
15 The intraday market in Germany is typically referred to as the real-time market in the US context.
16 Note that ancillary services are defined differently in different contexts. The California Independent System Operator
(CAISO) restricts the definition of ancillary services to spin/nonspin reserve power; in Germany the definition is broader and
ancillary services basically include any short-term measures taken to warrant the reliable operation of the power system.
17 Redispatching consists of modifying the generation plan and/or load to modify the physical flows on congested transmis-
sion lines.
18 Countertrading describes a trade made between two TSOs in the opposite direction of the constraining flow between two
control regions.
19 Operating reserve requirements in Europe are defined for different types of balancing power by the European Network of
TSOs for Electricity (ENTSO-E, formerly UCTE). For primary control power, a deterministic-static approach is applied, which
requires German TSOs to reserve roughly 600 MW of control power at every instant of time. For secondary and tertiary
control power, TSOs are allowed to choose among different approaches. German TSOs use a static-probabilistic approach:
a joint density function of imbalance levels is created based on historical data on the distribution of all random variables
causing imbalances (e.g., wind, solar, or load forecast errors, power plant failures).
20 Each grid connection point is assigned to a balancing responsible party (BRP)—that is, public and private utilities, genera-
tors, large industrial consumers, and load-serving companies. Each BRP reports scheduled load and/or supply for every
15 minutes one day ahead to the respective TSO. BRPs can adjust their schedule forecasts up to one hour before delivery.
After that, TSOs settle any imbalances arising from the announced schedules in their grid region by activating the procured
control power—that is, by requesting energy. All BRPs whose schedule is out of balance pay a uniform imbalance price,
defined for every 15 minutes. The imbalance price reflects the average costs of control energy activated and paid for by the
TSOs. For further information, see https://www.regelleistung.net/ext/static/rebap?lang=en.
21 Document available at: https://www.netzentwicklungsplan.de/sites/default/files/paragraphs-files/NEP_2030_V2019_1_
Entwurf_Teil1.pdf.The response of market and policy design to increasing shares of renewables in California and Germany
The electricity market and policy architecture in Germany and California: Background
19
Electricity trading and transmission allocation are could take several years from planning procedures
similarly separated for trades between adjacent to project approval. To speed up grid expansion,
markets. These trades are organized within the the Power Grid Expansion Act of 2009 (EnLAG)
market coupling scheme of the EPEX Spot.22 Mar- and the Grid Expansion Acceleration Act of 2011
ket coupling allows bidders in each bidding zone to (NABEG; Section 3.1.3) are supposed to eliminate
ignore cross-border transmission constraints. barriers by shifting permitting competences to the
Based on the pan-European “price coupling of re- federal level. The legislation also involves local
gions” solution, which is a uniform clearing algo- stakeholders in public consultations.
rithm to calculate electricity prices and flows in
the covered network area on a day-ahead basis, Transmission grid expansion is now mostly the
energy exchanges optimize transmission capacity responsibility of the Federal Grid Agency, which
allocation to minimize the price difference bet coordinates a five-step process.23 The first two
ween the coupled bidding zones. Trade results are stages comprise estimation of refurbishing and
reported to the respective TSOs, who resort to re- expanding needs for the next 10 to 15 years by
dispatch or countertrade measures contingent on each TSO and for each control region, based on
any infeasible flows between interconnectors scenarios approved by the agency.24 The resulting
(flow-based methodology). This means that TSOs grid development plan is handed over for approval
order generators (consumers) to increase (decrease) to the German government, which seeks in turn
injections (withdrawals) to (from) the grid to make approval of a federal requirements plan (Bundes
trades matching physical constraints. TSOs then bedarfsplan) by the federal Parliament and sub
remunerate generators and consumers for their sequently by the federal Assembly.25 In the final
adjustments and socialize the costs. Since Febru- steps, which include federal sectoral planning and
ary 2015, power exchanges in 19 EU member states planning approval (Planfeststellungsverfahren),
are coupled in the Multi-Regional Coupling, cover- the exact route and transmission technology used
ing 85 percent of European power consumption, for the new transmission line are determined ei-
which has led to converging energy prices and ther by each of the affected federal states or by
thus welfare gains in the coupled markets (Oggioni the Federal Grid Agency. These decisions are sub-
and Smeers 2013). ject to public and environmental consultations.
2.1.4 Transmission: Capacity expansion and FIGURE 6 depicts the current state of transmission
market structure grid expansion projects in Germany based on
After the unbundling of transmission asset owner- NABEG. Even though the grid expansion process
ships during the second wave of liberalization has been expedited, most lines are still in the plan-
(2005 Energy Act), transmission grid expansion ning or approval stage (orange, red, and blue lines).
became highly complex. Because of local public As we discuss in Section 3.1.3, this delayed grid
acceptance problems and a regionalization of per- expansion is increasingly seen as an impediment
mitting procedures combined with a lack of coor- to the efficient expansion of renewables, creating
dination among regional authorities, the process a north-south bottleneck in the German grid.26
22 In 2006 the European Power Exchange EPEX Spot initiated a market coupling process, starting with a trilateral day-ahead
auction format involving the French, Belgian, and Dutch spot markets. Since 2010, the German market has been coupled
with French, Dutch, and Belgian day-ahead markets, defined as the Central West Europe market region, which has also
been linked with the Nordic region. These markets are connected via the “NorNed” cable, which initially linked the Dutch
and Norwegian power systems. For more details, see https://www.epexspot.com/en/market-coupling/another_step_
towards_market_intergration (accessed 8/24/2017).
23 For more details, see https://www.netzausbau.de.
24 See § 12a EnWG for further details on the planning procedure.
25 This is based on the Federal Grid Expansion Plan Law; see http://www.gesetze-im-internet.de/bbplg/.
26 The estimated costs of approved transmission expansion through 2024 amount to €18 billion and €15 billion for grid
expansion on land and offshore, respectively. This information is available from the Federal Grid Agency at
https://www.netzausbau.de/SharedDocs/FAQs/DE/Allgemeines/05_Kosten.html.You can also read