The subsequent contamination of groundwater - Quantifying long-term leaching of PFAS in soils
←
→
Page content transcription
If your browser does not render page correctly, please read the page content below
Quantifying long-term leaching of PFAS in soils &
 the subsequent contamination of groundwater
                                Bo Guo
             Dept. of Hydrology and Atmospheric Sciences
                         University of Arizona
      Collaborator: Mark L. Brusseau (Dept. of Environmental Science, U of A)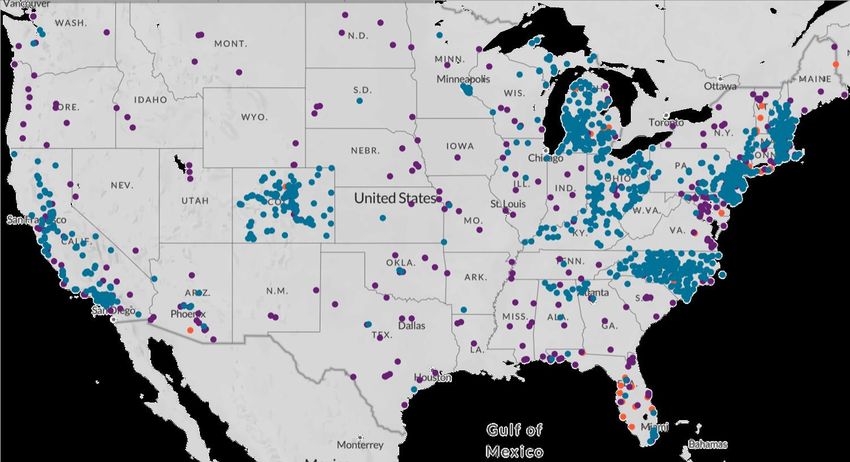
Subsurface Flow Physics Group @ UA
Background
Postdoc Energy Resources Engineering Stanford University 2016-2018
Ph.D. Civil & Environmental Engineering Princeton University 2016
B.S. Hydraulic Engineering Tsinghua University 2011
Appointments
Assistant Professor Hydrology & Atmospheric Sciences University of Arizona 2018-present
Affiliated Faculty Program in Applied Mathematics University of Arizona 2019-present
Research Focuses
Flow, transport, and reactions in porous media
Applications:
contaminant transport in soil and groundwater
shale gas/oil recovery
critical zone science
Visit our group webpage:
www.u.arizona.edu/~boguo/ Sidian Chen Hassan Saleem Matt Bigler
Jicai Zeng Alysa Burritt
Postdoc PhD student PhD student PhD student PhD student
2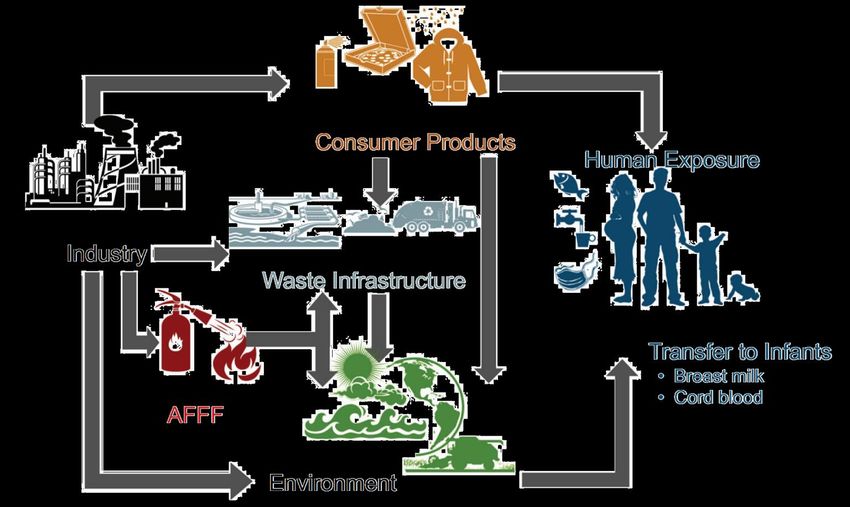
PFAS in the news (google search: July 5, 2021)

                                                 3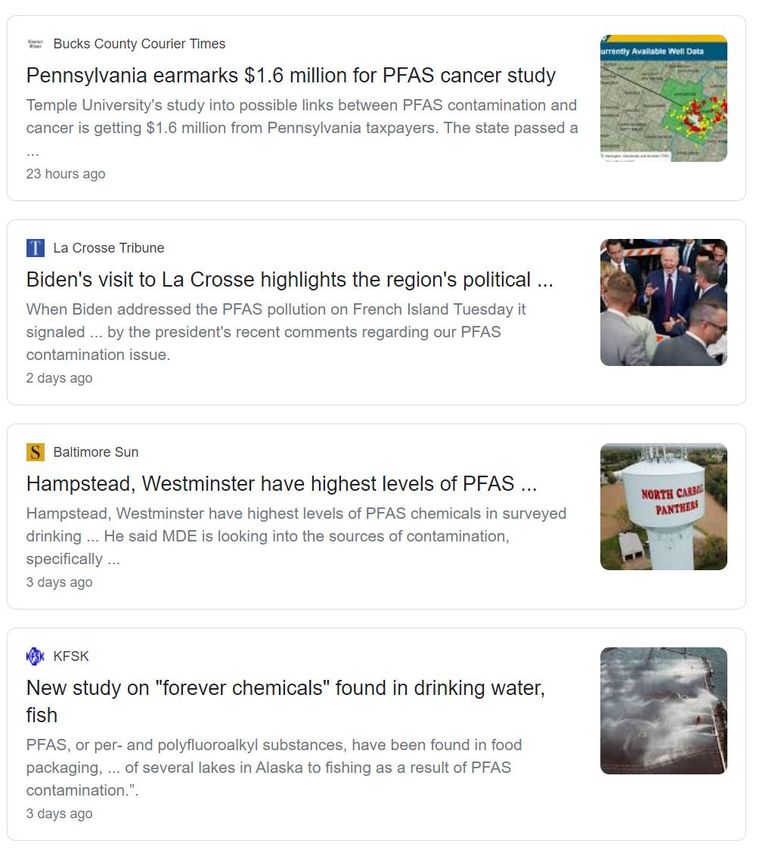
PFAS in the news

              University of Arizona

                                      4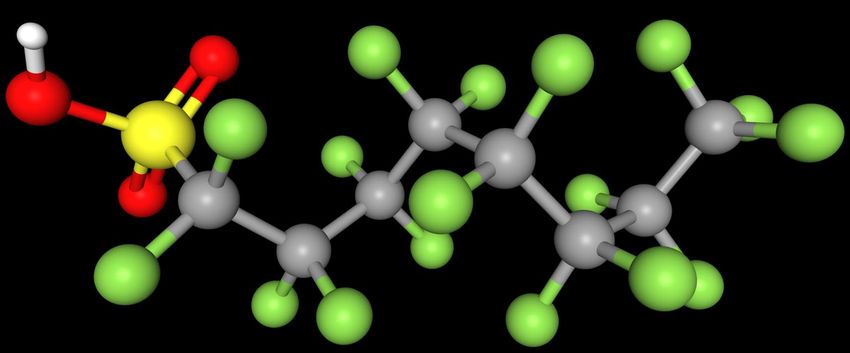
What are PFAS (Per- and poly-FluoroAlkyl Substances)?
                         PFAS molecule (e.g., PFOS)

            Hydrophilic headgroup        Hydrophobic-oleophobic tail
           Hydrogen                                          Fluorine
                       Sulfur

        Oxygen
                                                             Carbon

       •     Surfactant (Surface active agent)
       •     Persistent (C-F bond)
       •     Toxic at ppt levels
                                                                        5
       •     More than 4,000 compounds
Used in our daily life and at military sites
                          “Perfect” chemicals if NOT toxic
Non-stick, stain- and
water-resistant coating
                                           Food packaging

                                                                   Fire fighting foam

                          Schaider et al (2017)

                                                            http://www.safetynews.co.nz/fire-fighting-   6
                                                            foams-causing-sparks-fly/
97% of US residents have PFAS in their blood

                          Sunderland et al (2019)   7
PFAS are widely spread in groundwater

                                                               •   2,337 contamination sites in 49
                                                                   states.
                                                               •   # of sites are rapidly growing as
                                                                   more investigations are carried out.

                                                                                                  8
https://www.ewg.org/interactive-maps/pfas_contamination/map/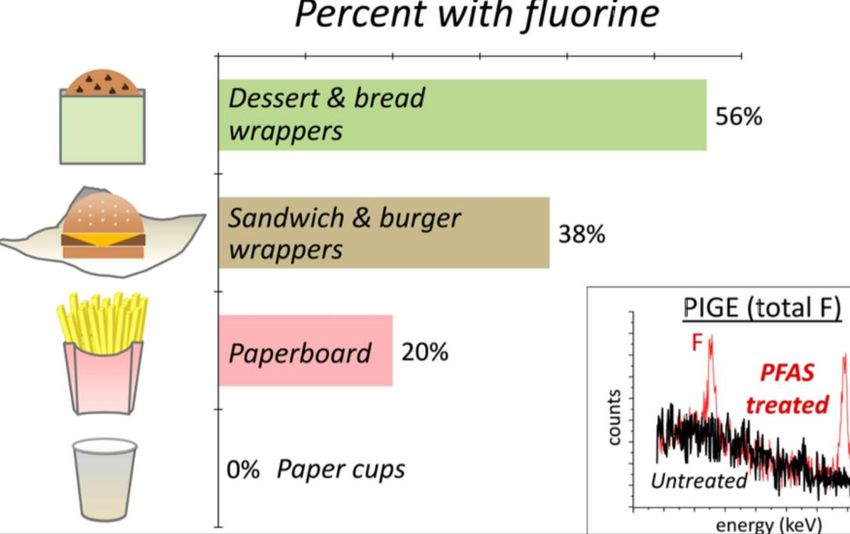
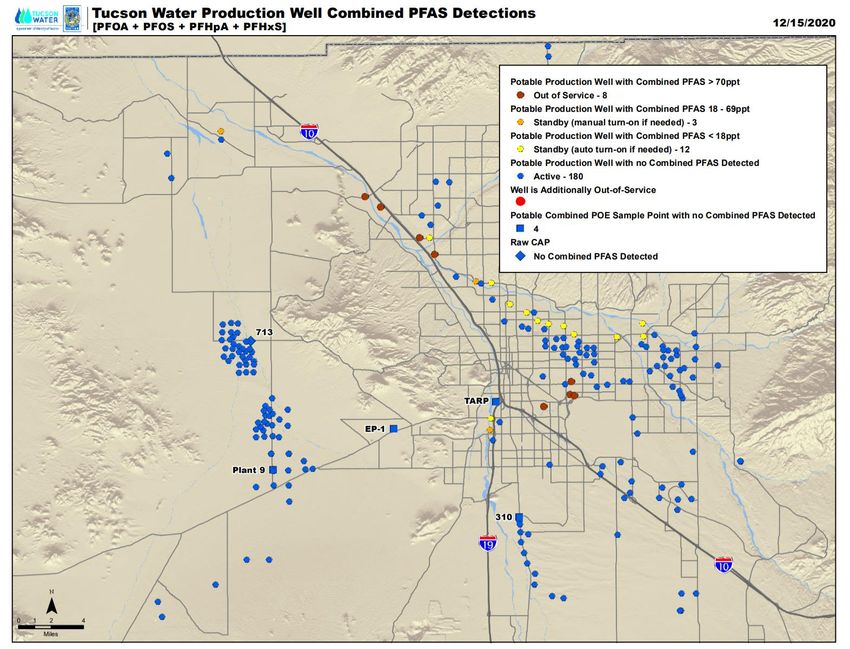
PFAS contamination in Tucson, AZ

 [PFAS]>70 ng/L
 Non detect

 Wastewater
 treatment plants

                                           Near Davis-Monthan
                                             Air Force Base

                    TARP well field   North of AZ Air National Guard

                                                                       9
Regulation of PFAS in groundwater

                                                                     •   Not regulated yet by EPA (“health
                                                                         advisory” 70 ppt)
                                                                     •   States are aggressively setting their own
                                                                         regulatory standards

                              PFAS not regulated in drinking water
                              Regulated (> 70ppt)
                              Regulated (=70 ppt)
                              Regulated (
Field data: AFFF-impacted fire training areas
0 ~2 m Mass ratio
10
Depth (m)
Depth rank
20
Long-chain
30
Short-chain
0 100 101 102 103 104 105
PFOS concentration (μg/kg dw)
• Vadose zones appear to act as significant source zones of PFAS.
• Long-chain PFAS tend to retain in shallow soil, while short-chain PFAS migrate to deeper depths.
Anderson et al. 2019
11
Brusseau, Anderson, Guo. 2020.What are the primary mechanisms that control the
long-term retention of PFAS in the vadose zone?
12PFAS transport and migration in the subsurface
Evapotranspiration
Precipitation Air
e.g., PFOS
molecular structure
Industrial sites, landfills, AFFF infiltration O
wastewater treatment F F F F O
plants
F H
F F F O
F
Hydropholic & Hydrophilic
Oleophobic tail headgroup
Groundwater
Release to groundwater table
Organic matter
Water
Three properties distinguish PFAS from traditional contaminants:
• Persistent in the environment—“forever chemicals”.
• Potentially profound human health effects at part-per-trillion levels.
• As surfactants, they tend to accumulate at solid surfaces and air-water interfaces in soils.
Guo, Zeng, Brusseau. 2020 13Numerical simulations: PFOS migration at a fire training area
Precipitation
Regular fire
training Fire training occurs every 10 days
AFFF solution contains 100 mg/L of PFOS
AFFF infiltration
Simulation time: 30 years (active) + 50 years (post)
4m Two soil types (Accusand vs. Vinton)
Two climatic conditions (Semiarid vs. Humid)
Groundwater
table Parameters determined independently from experiments.
Guo, Zeng, Brusseau. 2020 14Numerical simulations: PFOS migration at a fire training area
Temporal evolution of vertical profiles of PFOS
w/ AWI adsorption w/o AWI adsorption
Active-contamination Post-contamination Active-contamination Post-contamination
Depth (m)
Depth (m)
t = 0-30 yrs t = 30-80 yrs
t = 47 yrs
t = 0-30 yrs t = 30-80 yrs
Total concentration (μg/kg dw) Total concentration (μg/kg dw)
• Air-water interfacial adsorption significantly reduces the downward migration in the VZ.
Guo, Zeng, Brusseau. 2020 15Numerical simulations: PFOS migration at a fire training area
PFOS mass distribution in the vadose zone
t = 30 years t = 80 years
AWI adsorption
(98.7%)
AWI adsorption
Depth (m)
Solid phase (1.2%)
Aqueous (0.1%) (98.8%) • The majority (>98%) of PFOS in
the VZ is adsorbed at the air-water
Solid phase (1.1%) interfaces.
Aqueous phase (0.1%) • Only 0.1% and ~1% of PFOS in
aqueous and solid phase.
• Remediate soils vs. groundwater?
Concentration (μg/kg dw)
Guo, Zeng, Brusseau. 2020 16Numerical simulations: short-chain vs. long-chain PFAS
100%
(C4) (C6)
t = 42 yrs
(C8)
42%
t = 52 d 22% t = 100 d
Mass ratio (%)
• PFBS, PFHxS, and PFOS reach groundwater table at t = 52 d,
100 d, and 42 yrs.
• PFOS is much more strongly retained in the vadose zone than
Depth
PFBS and PFHxS.
Long-chain • Long-chain PFAS is retained in the shallow soil; while short-
Short-chain chain PFAS reach much deeper depth.
Guo, Zeng, Brusseau. 2020
Zeng, Brusseau, Guo. Under review 17THIS IS JUST THE BEGINNING
Take-home message
VZ will act as a long- • The vadose zone will act as a long-term source
term source to GW of PFAS to groundwater.
• The strength of retention varies greatly among
PFAS and under different conditions.
• The quantitative tools will support
characterization, management, and mitigation
of PFAS contamination risks at field sites.
Funding sources:
National Science Foundation (2023351)
Department of Defense ESTCP (ER21-5041)
18You can also read