Threat Landscape Report - Fortinet
←
→
Page content transcription
If your browser does not render page correctly, please read the page content below

QUARTERLY

Threat Landscape
Report

                   Q1 2019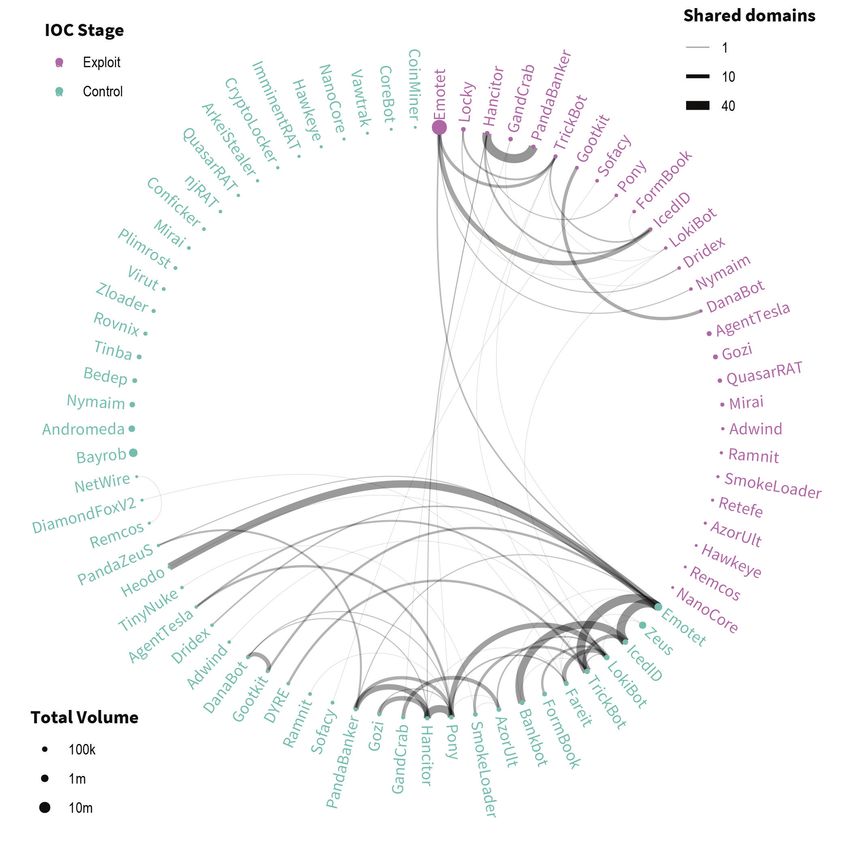
Q1 2019 Quarterly Threat Landscape Report

Table of Contents

Introduction and Overview  .  .  .  .  .  .  .  .  .  .  .  .  .  .  .  .  .  .  .  .  .  .  .  .  .  .  .  .  .  .  .  .  .  .  .  .                        3

Threat Landscape Index .  .  .  .  .  .  .  .  .  .  .  .  .  .  .  .  .  .  .  .  .  .  .  .  .  .  .  .  .  .  .  .  .  .  .  .  .  .                      4

Featured Q1 Updates .  .  .  .  .  .  .  .  .  .  .  .  .  .  .  .  .  .  .  .  .  .  .  .  .  .  .  .  .  .  .  .  .  .  .  .  .  .  .  .                   6

Playbook Preview: Silence Group .  .  .  .  .  .  .  .  .  .  .  .  .  .  .  .  .  .  .  .  .  .  .  .  .  .  .  .  .  .  .                                  12

Exploratory Analysis: A Web of (Filtered) Connections .  .  .  .  .  .  .  .  .  .  .  .  .  .  .                                                            13

References  .  .  .  .  .  .  .  .  .  .  .  .  .  .  .  .  .  .  .  .  .  .  .  .  .  .  .  .  .  .  .  .  .  .  .  .  .  .  .  .  .  .  .  .  .  .  .  .   15

                                                                                                                                                                  2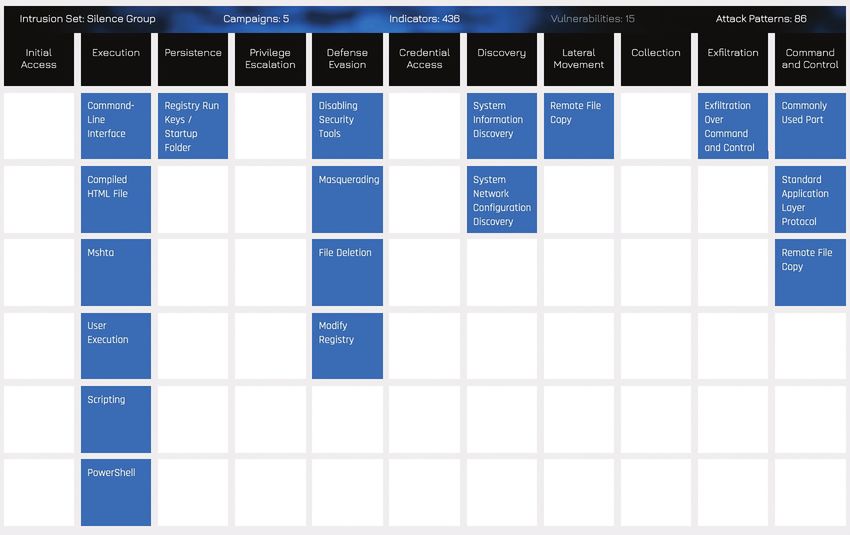
Q1 2019 Quarterly Threat Landscape Report

Q1 2019 Introduction and Overview
It’s time once again to head back out into the wilds of the cyber threat landscape to review another quarter of mischief and mayhem.
Thank you for choosing us as your guide, and we look forward to spending the next dozen-ish pages helping to get you caught up on
important Q1 events and prepared for the future. Here’s a quick synopsis of the attractions we’ll visit this quarter:

       1%

The Fortinet Threat Landscape Index                   Attackers Thinking More                             Content Management Needs
                                                      About ThinkPHP                                      Constant Management
This summary measure of how bad it is
out there was more volatile than ever, but            Exploits targeting the ThinkPHP                     We all know WordPress is a magnet for
rose a slight 1% overall during the quarter.          framework hit the #2 spot, reminding us             attacks, but what about less well-known
                                                      that attackers don’t discriminate against           CMS? We examine new exploits you need
                                                      lesser-known technologies to accomplish             to know about if you use these tools in
                                                      their goals on a global scale.                      your organization.

Tools and Tricks for Living Off                       Coinhive Becomes Victim of Its                      Ransomware Becoming More
the Land                                              Own “Success”                                       Tailored and Targeted

Threat actors increasingly leverage                   The Monero-based cryptomining service               Once the poster child for indiscriminate
legitimate tools already installed on target          Coinhive, which became a favorite of                attacks, recent ransomware attacks
systems to carry out cyberattacks. We                 cyber criminals, shut down in Q1. We                exhibit a more designer and destructive
discuss several of these tools and how                study the effects of that move through the          nature. We trace this trend using several
they’re being used.                                   lens of our telemetry data.                         recent examples.

Playbook Preview: Silence Group                                                     Exploratory Analysis: A Web of (Filtered) Connections

This threat actor traditionally targets financial institutions in Russia            Do threat actors carry out phases of their attack on different
and eastern Europe, but has expanded both their scope and                           days of the week? Do threats use the same infrastructure for
repertoire over the years. We catch you up on their latest tactics.                 exploitation and control? We explore those questions here.

The findings in this report represent the collective intelligence of FortiGuard Labs, drawn from a vast array of network sensors collecting
billions of threat events observed in live production environments around the world. According to independent research,1 Fortinet has
the largest security device footprint in the industry. This unique vantage point offers excellent views of the cyber threat landscape from
multiple perspectives that we’re excited to share with you this quarter.

                                                                                                                                                      3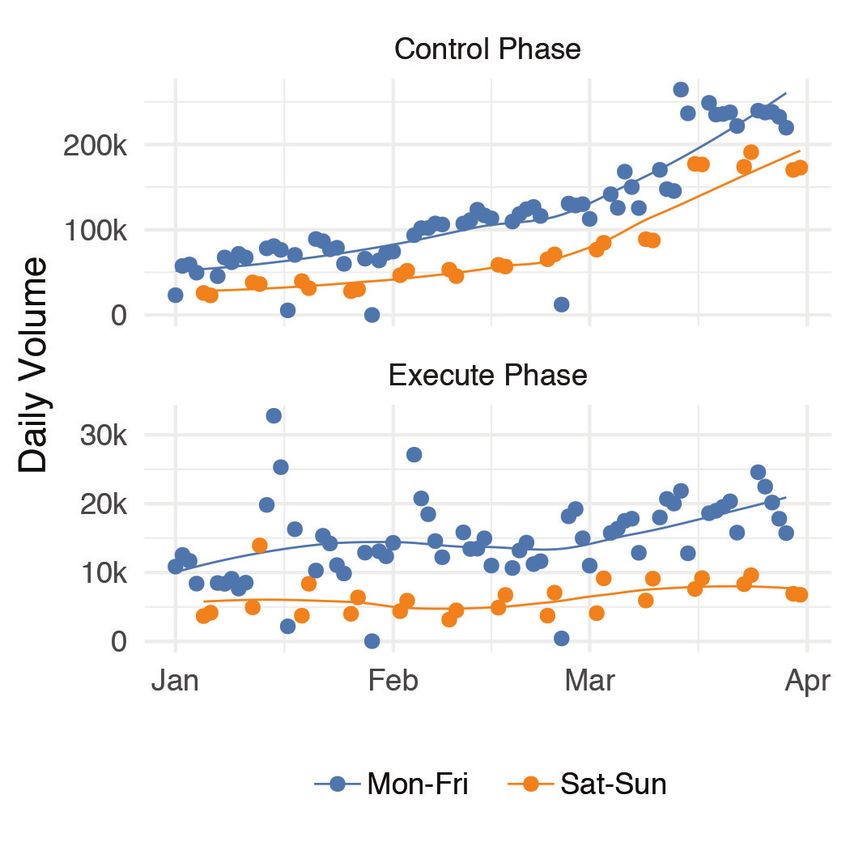
Q1 2019 Quarterly Threat Landscape Report

Threat Landscape Index
We developed the Fortinet Threat Landscape Index (TLI) in mid-2018 to answer the seemingly simple, yet deceptively difficult, question
of “Is it getting better or worse out there?” Generally speaking, the TLI is based on the premise that things are getting worse if more
of our sensors detect a wider variety of threats or a higher volume (doubly so if we see both). If the opposite is true, then the cyber
landscape is less threatening. Perhaps most importantly, it shows the rate of those changes over time and helps draw attention to the
forces driving them.

As seen in Figure 1, the TLI started its run at a value of 10002 and hit an early December peak of 1032 before diving to 1005 to end 2018.
Q1 2019 exhibits more volatility than previous quarters (especially for malware), but the extent of those shifts is not unprecedented. Overall,
the Index rose a little over 1% during the quarter to close at 1017.

                             Figure 1: Fortinet Threat Landscape Index (top) and subindices for Botnets, Exploits, and Malware (bottom).

If you’d like a more detailed view into the changing threats and events driving the Index each week, check out our Weekly Threat Briefs. For
this quarterly foray into the threat landscape, Figure 2 tallies the overall top 10 from our exploit, malware, and botnet sensors from Q1 2019.

                                                                                                                                                  4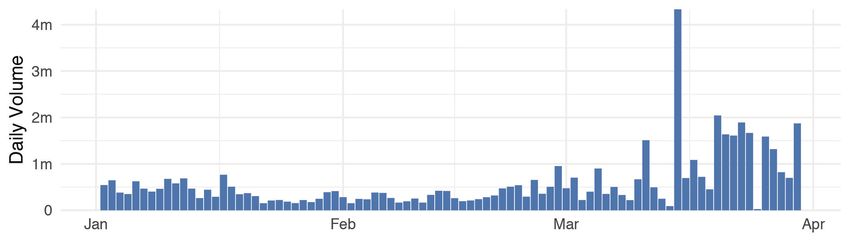
Q1 2019 Quarterly Threat Landscape Report

                 Exploit Targets                                 Malware Families                                              Botnets

 1.    MS IIS                                   1.       MSOffice/CVE_2017_11882                            1.     ZeroAccess

 2.    ThinkPHP                                 2.       W32/Agent                                          2.     Andromeda

 3.    Apache Struts                            3.       JS/ProxyChanger                                    3.     H-Worm

 4.    D-Link 2750B                             4.       W32/Kryptik                                        4.     Conficker

 5.    MS Windows                               5.       Riskware/Refresh                                   5.     Sora

 6.    Netcore Netis                            6.       Riskware/Coinhive                                  6.     Emotet

 7.    DASAN GPON                               7.       W32/STRAT_Gen                                      7.     XorDDoS

 8.    WebRTC                                   8.       Android/Hiddad                                     8.     Necurs

 9.    Apache Tomcat                            9.       Riskware/Generic                                   9.     AAEH

 10.   Linksys                                  10.      Android/Generic                                    10.    Torpig

                                            Figure 2: Most prevalent exploits, malware, and botnets for Q1 2019.

Let’s start with a couple of highlights from the most common targets for exploits. Due to their widespread use, Microsoft and Apache are
permanent fixtures on the list for as long as we can remember. Routers of various types—represented this quarter by D-Link, Netcore,
DASAN, and Linksys—have become staples as well over the last couple of years. But remote code execution attempts against the
ThinkPHP development framework did pique our interest. So much so, in fact, that we give it its own spotlight in this report.

As a testament to the aforementioned volatility in the malware index, 40 different malware families (not variants) made the weekly top five
list over the quarter when measured by volume per device. Most of them were routine offenders making the rounds during their latest
campaign. Coinhive was one of those—until it was shut down in early March. Will this go down as its swan song on the top 10 list? We
discuss Coinhive’s exit in a section below.

On the botnet side of the house, Emotet is the standout for the quarter. The Emotet malware has been around for years, but got more lively
in Q1 with several new campaigns leveraging its latest information-stealing, ransomware, and banking Trojan modules. We analyzed one of
these new variants in this blog post. It’s not shown above but worth calling out that Emotet was the most blocked threat in our web filtering
service for the quarter. You can find out more about that in our Exploratory Analysis section.

That should build a solid high-level view of the Q1 2019 threat landscape. Now let’s get into the details!

                                                                                                                                              5
Q1 2019 Quarterly Threat Landscape Report
Featured Q1 Updates
A lot happens across the cyber threat landscape in any given quarter, and downselecting what to feature in a review like this is no small
challenge. Our analysts selected the following as noteworthy updates for a variety of reasons. We hope they assist you in reflecting on and
perhaps recovering from whatever Q1 2019 brought your way.
Attackers Thinking More About ThinkPHP
Figure 2 ranked exploits targeting a remote code execution (RCE) vulnerability in the ThinkPHP development framework at the #2 spot.
Taken alone, that may not seem all that unusual; exploits come and go regularly. But those who monitor such things find this rather odd on
two counts: 1) ThinkPHP hasn’t landed that high on any of our lists in recent memory, and 2) its use is typically more concentrated in China.
It’s been said that if you really want to understand threat trends, it’s a good idea to closely follow prevailing technology trends. That saying
proves true in unraveling this case. Social media continues to boom, driving the need to make the creation of social-savvy websites easy
for the masses. Content management systems (CMS) and various development frameworks (like ThinkPHP) have sprung up to meet that
demand. Internet miscreants have, in turn, taken advantage of what has become a regular drumbeat of vulnerabilities affecting these tools.
Proof-of-concept code for this particular ThinkPHP exploit was released in December 2018, and attacks started almost immediately
thereafter. Though TopThink quickly issued a patch for the vulnerability (CVE-2018-20062), Figure 3 shows that attackers continued to
actively scan for vulnerable systems throughout Q1.
Figure 3: Volume of RCE attempts against ThinkPHP for Q1 2019.
Successful exploitation of this vulnerability often leads to installation of a PHP backdoor and abuse of the system for DDoS attacks,
malware distribution, and fueling botnets. BuleHero is one such botnet we observed aggressively leveraging compromised ThinkPHP hosts
for cryptomining schemes. A Mirai offshoot, Miori, is another botnet using the ThinkPHP RCE bug to download code to compromised
devices and launch DDoS attacks.
Takeaway: ThinkPHP’s rise to the top is yet another example of attackers swarming to take advantage of even
lesser-known technologies to accomplish their goals on a global scale. It’s good to remember that we set ourselves
up to become collateral damage when we don’t collectively practice sound public hygiene for the greater good.
6Q1 2019 Quarterly Threat Landscape Report
Content Management Needs Constant Management
While we’re on the topic of exploits against development frameworks like ThinkPHP, it’s worth giving special attention to CMS. WordPress
receives regular attention in this report and continues to be the most targeted CMS, according to Figure 4. It was the only CMS for which
we registered attacks on more than 100,000 devices globally. But that doesn’t mean organizations running other platforms should assume
they are safe from attack.
Joomla is the second most popular CMS after WordPress, currently powering around 9% of known business websites. Like any platform,
Joomla has its share of vulnerabilities—six disclosed this year alone. Attackers are paying attention to such flaws. We recently detected a
massive volume of activity targeting an RCE vulnerability affecting multiple versions of Joomla. In March, there were reports of a Russian
threat group compromising hundreds of WordPress and Joomla websites and using the sites to distribute ransomware and phishing pages.
Figure 4: Five most targeted content management systems in Q1 2019.
During Q1 2019, we observed a relatively high volume of exploits targeting Ektron and DataLife. Total triggers detected for the Ektron RCE
vulnerability peaked briefly in late January, dropped substantially in February, and climbed back up again in March, indicating a low but
persistent level of interest in the platform. Attack activity targeting the DataLife PHP Code Injection flaw showed a similar pattern except that
exploit volume topped out in March.
We also saw a substantial volume of attacks in January targeting Magento’s ecommerce platform and CMS. The rest of the quarter brought
a small but steady stream of attempts to take advantage of a handful of additional Magento vulnerabilities. The volume of activity targeting
Magento and others not shown in Figure 4 pale in comparison to the leading CMS, but they cannot be ignored.
Takeaway: It goes without saying that CMS are leading targets and demand rigorous protection if your
organization uses them. But don’t let minor CMS or the myriad third-party plugins be the Achilles heel in your
otherwise sound defenses.
7Q1 2019 Quarterly Threat Landscape Report
Tools and Tricks for Living Off the Land
From the previous section, we saw that the most widely adopted and widely attacked CMS are one and the same. This cat-and-mouse
game between technology and threats isn’t restricted to how attackers choose their targets. The game continues even after attackers gain
initial victory.
Threat actors increasingly leverage dual-use tools and tools that are already pre-installed on targeted systems to carry out cyberattacks.
This “living-off-the-land” tactic allows hackers to hide their activities in legitimate processes and makes it harder for defenders to detect
them. Such tools also make attack attribution much harder for investigators—another reason why adversaries like using them.
PowerShell is arguably one of the most popular among these tools for many reasons. It comes pre-installed on Windows machines and can
interact directly with the .NET Framework that comes with all Windows 10 systems. PowerShell can be directly executed from memory, is
easy to obfuscate, and is trusted, enabling it to bypass whitelisting defenses. Adding to the lure for cyber criminals is a bagful of free, readily
available malicious tools for PowerShell such as PowerSploit, PowerShell Empire, and Nishang.
During Q1, we saw a substantial volume of attacks attempting to leverage PowerShell to run a variety of malicious code. A large proportion
of the attacks we detected involved the use of PowerShell to try and deploy PowerShell/Agent.DV!tr.dldr and W32/Hmir.BCX!tr.dldr, two
malware downloader Trojans that we have been tracking for some time.
We’ve tracked adversaries using PowerShell in campaigns to deploy numerous malware including TrickBot and Emotet banking Trojans and
the Cobalt Strike penetration testing tool on targeted systems. In April, for example, we released a playbook on the Silence Group, a threat
actor that has been leveraging PowerShell, VBS, and other legitimate tools in a long-running campaign targeting banks.
PowerShell, of course, is not the only threat. PsExec and Mimikatz are popular utilities for moving laterally within an environment and
installing payloads on other systems. Last year, for example, we observed the SamSam threat group using a combination of custom
malware and publicly available tools including PsExec and Mimikatz to deploy ransomware on enterprise systems. We have seen Thrip,
an advanced persistent threat actor, use PowerShell, PsExec, Mimikatz, open source FTP client WinSCP, and remote access software
LogMeIn in campaigns against organizations in the U.S. and Southeast Asia.
Microsoft in recent years has hardened PowerShell against misuse via measures that restrict the ability to invoke arbitrary Windows APIs, by
script block logging, code signing, and support for role-based access administration. But the reality is that attackers can use any language
that interacts with .NET, including C#, C++, IronPython, and VB, to accomplish a lot of the same things they can with PowerShell. The
highly sophisticated NanoCore remote access Trojan that we wrote about earlier this year is a good example. It was developed in the .NET
Framework and is widely used for keylogging, password stealing, file transfers, and other malicious actions like registry edits and privilege
escalation. And if coding up your own is out of reach, there’s a growing body of open-source tools developed by/for penetration testers
(e.g., SilentTrinity) that will do the trick just fine.
Takeaway: Smart attackers use a wide range of legitimate tools—including but not limited to PowerShell—to
accomplish their goals and hide in plain sight. Smart defenders limit access to sanctioned administrative tools and
log their use.
8Q1 2019 Quarterly Threat Landscape Report
Coinhive Becomes Victim of Its Own “Success”
Coinhive launched in 2017 with the idea that its JavaScript file could be installed on websites to generate income for the site owners without
resorting to traditional advertisements. Coinhive mines the cryptocurrency Monero, and unlike Bitcoin, Monero transactions between two
parties are untraceable. This feature made it an attractive option for cyber criminals who took to installing it on compromised websites—
without consent, of course. This “success” in the black market drove Coinhive to the top of the threat charts and caused it to be blacklisted
in many security products.
Despite purported revenues of $250K per month3 and a majority ownership of the browser-based cryptomining market, Coinhive
announced in February that the service “isn’t economically viable anymore” and that it would be shutting down. This is partly due to Monero
crashing in value as well as the fact that Monero released an algorithm update that made the mining process slower.
The effects of this announcement and subsequent shutdown in early March are plain to see in Figure 5. Detections of the two predominant
Coinhive signatures across FortiGuard IPS trend downward over the quarter. Coinhive said the JavaScript variant would cease working on
March 8. True to their word, virtually none of the JS/Coinhive variants appear in the data beyond that date. The Riskware/Coinhive version,
however, still shows some signs of life. We suspect this reflects a lag in remediating the many compromised servers that exist in the wild.
Based on prior shutdowns, we suspect it may be quite some time before these malicious Coinhive disappear completely. But it’s still good
to acknowledge each victory as it comes.
Figure 5: Decline in Coinhive detections during Q1 2019.
Takeaway: Similar to administrative tools like PowerShell, legitimate services can fall into illicit use.
This means recognizing misappropriation is just as important to a comprehensive defense as recognizing
overtly malicious threats.
9Q1 2019 Quarterly Threat Landscape Report
Ransomware Becoming More Tailored and Targeted
Our latest data suggests that threat actors continue to move away from indiscriminate ransomware attacks to more targeted and potentially
more lucrative campaigns. Multiple attacks reported in Q1 2019, including those against a major Norwegian aluminum manufacturer, two
American chemical companies, and a French engineering firm, support this premise.
Figure 6: Volume of LockerGoga, Anatova, and GandCrab by country in Q1 2019.
10Q1 2019 Quarterly Threat Landscape Report
One such ransomware variant, LockerGoga, surfaced in early 2019 and has garnered some attention for how severely it disrupted
operations at the previously mentioned aluminum manufacturer. The attack degraded operations at multiple plants in Europe and the U.S.
and took weeks to remediate. Our analysis of the malware shows there’s little about LockerGoga that sets it apart from other ransomware in
terms of functional sophistication.
There is evidence, however, to support reports that the LockerGoga attack on the aluminum manufacturer was targeted. Malware execution
required administrative rights that would have necessitated an attacker to have already gained some sort of privileged access to the
network. Furthermore, while most ransomware tools use some level of obfuscation to avoid detection, there was very little of that in the
LockerGoga sample we analyzed. This again suggests that the attacker had already analyzed the victim’s network defenses and determined
the malware would not be detected. It’s also curious that LockerGoga appears to lock victims out of their systems, thereby preventing them
from even seeing or responding to a ransom note. This behavior seems to indicate that extortion may not have been the primary goal.
Anatova was another ransomware variant that grabbed our attention last quarter. It first surfaced (and peaked) in early January and is one
of the few pure 64-bit ransomware samples we have seen in the wild. The actors behind Anatova appear to have taken a cue from the
operators of last year’s prolific GandCrab in demanding ransom payments in Dash cryptocurrency instead of the usual bitcoins.
Like most other ransomware, the main goal of Anatova is to encrypt as many files as possible on the victim system. It then does a pretty
thorough job preventing file restoration by overwriting volume shadow copies a total of 10 times in quick succession. Anatova systematically
avoids encrypting anything that can impact the stability of the system it is infecting. It also avoids infecting computers that look like they are
being used for malware analysis or as honeypots.
Figure 6 shows global detections of these targeted variants of LockerGoga, Anatova, and GandGrab ransomware. Those who follow such
things will note that this is not your typical opportunistic threat geographic distribution. The pattern here suggests targets of choice rather
than targets of chance. We will certainly continue monitoring this trend as it develops.
Takeaway: Ransomware attacks continue to decline in number but remain a potent threat to enterprise security.
Patching and backups remain no-brainers against commodity ransomware, but more tailored and targeted
threats require more tailored and targeted defenses.
11Q1 2019 Quarterly Threat Landscape Report
Playbook Preview: Silence Group
Silence Group is a threat actor that has been active since 2016, and we recently added them to our new Playbook Viewer. The group most
commonly targets financial institutions in Russia and eastern Europe, but they have also been known to target firms in Australia, Canada,
France, Ireland, Spain, Sweden, and the U.S. Silence Group’s initial attacks showed all the signs of a new and untested threat actor, but
they’ve grown increasingly sophisticated and successful over time.
Silence Group typically executes attacks by using publicly available tools and utilities that exist on the target machine (such as PowerShell).
Choosing to “live off the land” rather than introducing foreign tools improves evasiveness and gives the group a stronger foothold inside the
victim machine.
When necessary, Silence Group has been known to write their own tools. These tend to be highly modular in nature and designed to fit the
needs of a specific attack. A few of the more commonly used modules include a proxy module, monitor module, and an ATM module. The
proxy module allows for large-scale penetration into the target network. The monitor module gives the capability to take screenshots and
transfer data back to the main module for exfiltration. The ATM module, Atmosphere, allows operators to remotely withdraw currency from
ATM machines (aka “jackpotting”). Silence Group then pays individuals to collect the stolen funds from the infected ATMs while the group
moves on to its next target.
As the different timelines in the Playbook suggest, Silence Group continues to add to their repertoire. If their growth in capability and
effectiveness continues, the potential threat the group poses justifies continued vigilant observation of future Silence Group campaigns.
Figure 7: Most recent intrusion set from Silence Group.
12Q1 2019 Quarterly Threat Landscape Report
Exploratory Analysis: A Web of (Filtered) Connections
This section gives analysts free reign to roam and share some stories of interest from our cyber threat data that do not necessarily relate to
the topics or flow of the main report. This quarter, we chose to dig into data from our FortiGuard Web Filtering Service because it has not
received as much attention in previous reports.
In short, this service blocks and logs attempted access to malicious, hacked, or inappropriate websites. Our analysts apply various
categorizations to this activity, such as the type of website and the phase of the Cyber Kill Chain in which it occurs. The overwhelming
majority of blocks in Q1 occurred in the exploit and control phases. This makes sense because devices visiting these malicious URLs are
often directed there (e.g., via phishing) for the purpose of exploitation and/or for ongoing command-and-control (C2) instructions after
successful exploitation.
This distinction creates a useful contrast between pre- and post-compromise activity over the quarter in Figure 8. The blue dots signify
weekdays and the orange dots weekends. We make that distinction because it seems to suggest that pre-compromise activity is roughly
3x more likely to occur during the workweek, while post-compromise traffic shows less differentiation in that regard. That may be because
exploitation often requires employees to click on something, whereas C2 activity doesn’t have that requirement.
Figure 8: Comparison of web filtering volume for two Cyber Kill Chain phases during weekdays (blue) and weekends (orange).
That little tidbit may seem rather spurious or mundane, but every bit of knowledge we gain on how attackers work offers at least some
improvement over the baseline. In this case, it may make sense to consider differentiating weekday and weekend filtering practices.
Another aspect of the web filtering data that caught our attention was the degree to which different threats shared infrastructure (URLs). Figure
9 displays this overlapping infrastructure in a circular network diagram. Each node represents malware or botnet communication activity
generated by the threat during the control stages of the Kill Chain. The thickness of lines represents the number of domains shared between
threats at each stage. The size of each node corresponds to the total volume detected in Q1. It fuels several interesting observations.
13Q1 2019 Quarterly Threat Landscape Report
Figure 9: Infrastructure sharing among web filtering detections in Q1 2019.
Nearly 60% of threats shared at least one domain in the web filter data, indicating the majority of botnets leverage established infrastructure.
Interestingly, some threats appear to leverage this community-use infrastructure to a greater degree than unique or dedicated infrastructure.
IcedID, the #9 threat by volume in the web filter data this quarter, offers a good example of this “why buy/build when you can borrow”
behavior, sharing 60% of the domains it contacted with other threats. Last and perhaps most intriguing is that when threats share
infrastructure they tend to do so within the same stage in the Kill Chain. In other words, it would be unusual for a threat to leverage a
domain for exploitation and then later leverage it for C2 traffic. This suggests infrastructure typically plays a particular role or function when
suborned for malicious campaigns. Only six threats—Emotet, GandCrab, Hancitor, LokiBot, Sofacy, and TrickBot—share domains between
stages and they only share nine domains among them.
Maybe crossing Kill Chain stages is like crossing proton streams—it would be bad. With that, we’ll sign off for this quarter. May there be
no giant Cyber Stay Puft Marshmallow Men wreaking havoc across your Q2 landscape. But if that does happen, no need to wonder who
you’re gonna call. We’ve got you covered.
14Q1 2019 Quarterly Threat Landscape Report
References
1
IDC Worldwide Security Appliances Tracker, March 2019 (based on annual unit shipments).
2
1000 was arbitrarily chosen as the initial starting point for the Index. That value has no inherent meaning other than establishing a scaling factor for
subsequent calculations.
3
Rüth, J., et al., Digging into Browser-based Crypto Mining, IMC ’18, October 31–November 2, 2018, Boston, MA, USA.
Downloaded from: https://arxiv.org/pdf/1808.00811.pdf
15www.fortinet.com Copyright © 2019 Fortinet, Inc. All rights reserved. Fortinet®, FortiGate®, FortiCare® and FortiGuard®, and certain other marks are registered trademarks of Fortinet, Inc., and other Fortinet names herein may also be registered and/or common law trademarks of Fortinet. All other product or company names may be trademarks of their respective owners. Performance and other metrics contained herein were attained in internal lab tests under ideal conditions, and actual performance and other results may vary. Network variables, different network environments and other conditions may affect performance results. Nothing herein represents any binding commitment by Fortinet, and Fortinet disclaims all warranties, whether express or implied, except to the extent Fortinet enters a binding written contract, signed by Fortinet’s General Counsel, with a purchaser that expressly warrants that the identified product will perform according to certain expressly-identified performance metrics and, in such event, only the specific performance metrics expressly identified in such binding written contract shall be binding on Fortinet. For absolute clarity, any such warranty will be limited to performance in the same ideal conditions as in Fortinet’s internal lab tests. Fortinet disclaims in full any covenants, representations, and guarantees pursuant hereto, whether express or implied. Fortinet reserves the right to change, modify, transfer, or otherwise revise this publication without notice, and the most current version of the publication shall be applicable. Fortinet disclaims in full any covenants, representations, and guarantees pursuant hereto, whether express or implied. Fortinet reserves the right to change, modify, transfer, or otherwise revise this publication without notice, and the most current version of the publication shall be applicable. 411659-0-0-EN Threat-Report-Q1-2019
You can also read