TRANSIT DEVELOPMENT PLAN UPDATE - APPENDIX B: SERVICE GUIDELINES MARCH 2018
←
→
Page content transcription
If your browser does not render page correctly, please read the page content below
SOUTH CENTRAL TRANSIT AUTHORITY

TRANSIT DEVELOPMENT PLAN UPDATE

APPENDIX B: SERVICE GUIDELINES
MARCH 2018

TABLE OF CONTENTS
1   INTRODUCTION....................................................................................................... 2
2   SCTA SERVICES ....................................................................................................... 3
    Major Local Routes ................................................................................................... 3
    Local Routes .............................................................................................................. 3
    Regional Routes ........................................................................................................ 3
    Express Routes............................................................................................................ 3
    Demand-Response Service ..................................................................................... 4
3   SERVICE DESIGN PRINCIPLES ................................................................................. 5
    Service Should be Simple ......................................................................................... 5
    Routes Should Operate Along a Direct Path ........................................................ 5
    Route Deviations Should be Minimized.................................................................. 5
    Fixed Routes Should Operate Along Arterials Where Possible ............................ 7
    Routes Should be Symmetrical ............................................................................... 7
    Service Should Serve Well-Defined Markets .......................................................... 8
    Services Should be Well Coordinated ................................................................... 8
    Service Should Operate with Consistent Schedules ............................................ 8
    Stops Should be Spaced Appropriately ................................................................ 8
    Service Design Should Maximize Service ............................................................... 9
4   SERVICE LEVEL GUIDELINES .................................................................................. 10
    Service Guidelines Basis ......................................................................................... 10
    Service Coverage ................................................................................................... 10
    Minimum Spans of Service ..................................................................................... 11
    Minimum Service Frequencies .............................................................................. 12
    On-Time Performance ............................................................................................ 13
    Passenger Loading ................................................................................................. 13
5   PERFORMANCE AND PRODUCTIVITY GUIDELINES ............................................... 14
    Applying Performance and Productivity Guidelines ......................................... 14
    Targets for Passengers per Revenue Vehicle Hour............................................. 15
    Targets for Operating Cost per Passenger .......................................................... 17
    Targets for Operating Cost per Revenue Vehicle Hour..................................... 19
    Targets for Operating Revenue per Revenue Vehicle Hour ............................. 21
6   SCTA Route Classifications .................................................................................. 23
    BARTA ........................................................................................................................ 23
    Inter-County ............................................................................................................. 23
    RRTA .......................................................................................................................... 23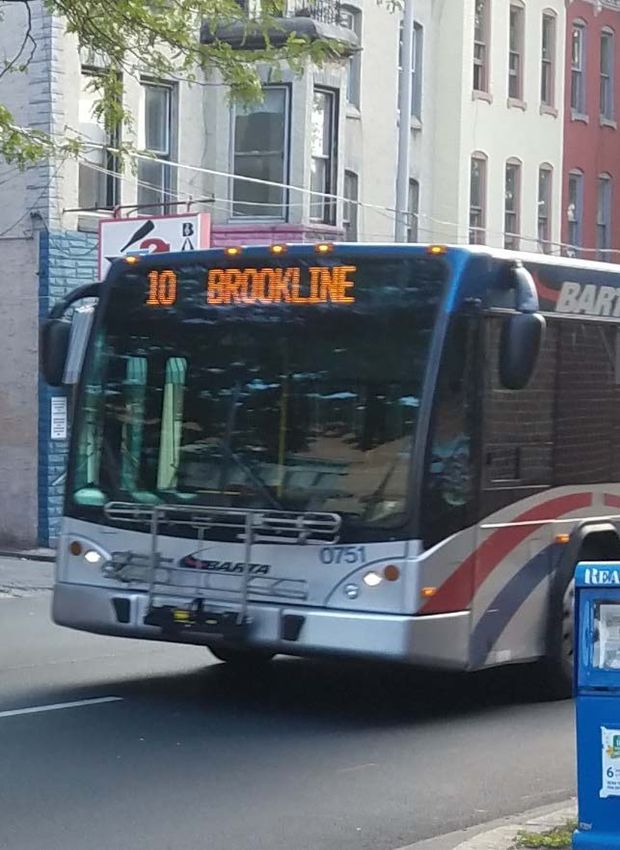
1 INTRODUCTION
The South Central Transit Authority (SCTA) strives to provide quality transit service in a cost-
effective manner that is consistent and equitable. To do so, SCTA must make a number of
competing decisions based on where demand is greatest, which types of services would work
best and be most appropriate, and where limited resources can and should be used. This set of
service guidelines defines how SCTA will:
Determine where service should be provided
Design service
Determine appropriate service levels
Ensure that service is productive
The service guidelines will be applied to the entire family of services provided by SCTA—
including Berks Area Regional Transportation Authority (BARTA) and Red Rose Transit Authority
(RRTA) services—and are intended to bring clarity and consistency to the process of continually
adjusting and improving transit services to meet varied and changing customer needs. In most
cases, the service guidelines define minimum thresholds that SCTA service must meet, and most
services would exceed the minimum thresholds. However, the guidelines are also designed to—
within limits—provide flexibility to respond to varied customer needs and community
expectations in an accountable, equitable, and efficient manner.
Finally, it should be noted that adherence to these service guidelines is dependent upon
resource availability, and in particular, funding availability. In the event of constrained resources,
SCTA will meet these guidelines as closely as possible and will work to achieve consistency as
resources permit.
SCTA Transportation Development Plan Update | 2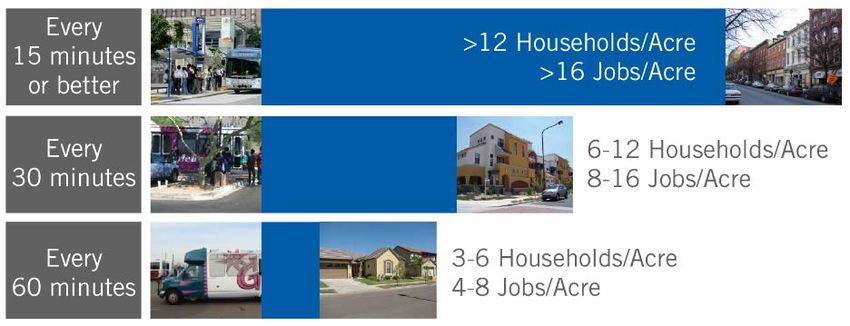
2 SCTA SERVICES
SCTA provides a family of services that are designed to meet a wide array of travel needs. These
services consist of the following types of routes:
Major Local Routes
Local Routes
Regional Routes
Express Routes
Demand-Response Service
Major Local Routes
Major Local routes are SCTA’s highest ridership and/or most productive routes and form the
“backbone” of the SCTA’s system. These routes operate along major arterials and offer simple,
straight, and direct service and connections to network hubs. Bus stops will be spaced father
apart as compared to other services. Major Local routes provide frequent service throughout
the day. All Major Local Routes provide fixed-route service, which means that they operate
along a designated route and serve designated stops.
Local Routes
Local routes also operate along primary arterials, but in areas of less dense development
patterns. They also typically are anchored at a transit hub, either in downtown or at the end of a
frequent route. These routes offer relatively simple and direct service, with slightly closer stop
spacing. All Local Routes provide fixed-route service.
Regional Routes
Regional routes provide longer-distance service connecting the major activity centers across
jurisdictions on weekdays and weekends. They have limited stops in low-density areas to provide
fast travel times, and use freeways and expressways where appropriate. In the urban core,
Regional routes have similar stop spacing as Local Routes. All Regional routes provide fixed-route
service.
Express Routes
Express routes are designed primarily to provide fast and direct service between the region’s key
downtown cores and major activity centers. Regional connector routes provide high-speed
service, use freeways or major arterials, and make limited stops to provide more predictable,
faster trips. These routes generally operate on weekdays only and operate a limited number of
trips, but depending upon demand, some routes may operate for longer hours and/or on
weekends.
SCTA Transportation Development Plan Update | 3Demand-Response Service
Demand-response service offers curb-to-curb or door-to-door service upon request. Services are
well suited for serving low-density areas and can be provided by a range of providers, from
traditional transit agencies to app-based ride-hailing providers. Demand-response service
typically operates within a geographically limited area, and provides pick-up and drop-off
services within a defined zone. Demand-response service includes ADA paratransit service,
which operates under specific FTA guidelines, serving individuals with disabilities and older adults.
Demand-response service also includes emerging mobility options such as ride-hailing
companies.
SCTA Transportation Development Plan Update | 43 SERVICE DESIGN PRINCIPLES
SCTA works to serve as many residents, workers, and visitors as it can within its available
resources. This involves many trade-offs as some service attributes that attract one type of rider
will deter other riders – for example, meandering services designed to minimize walk distances
are attractive to those who are not time-sensitive, but unattractive to those who are. SCTA’s
family of services attempts to balance these competing demands to develop a network that
meets the greatest public good. At the same time, there are also certain service design
principles that will improve service for nearly all riders.
Service Should be Simple
To encourage people to use transit, service should be designed so that it is easy to understand.
In this way, current and potential riders can grasp and use the transportation options available
to take them where and when they want to go with ease. Most of the guidelines in this section
are aimed at making service intuitive, logical, and easy to understand.
Routes Should Operate Along a Direct Path
Passengers and potential passengers alike prefer faster, more direct transit services. In order to
remain competitive with the automobile, special attention should be placed on designing
routes to operate as directly as possible to maximize average speed for the bus and minimize
travel time for passengers while maintaining access to service. Routes should not deviate from
the most direct alignment unless there is a compelling reason to do so.
Most riders prefer straighter and more direct service to circuitous service
Route Deviations Should be Minimized
As described above, service should be relatively direct. The use of route deviations—travelling
off the most direct route—should be minimized.
SCTA Transportation Development Plan Update | 5Serving different locations on different trips makes service complicated and inconveniences
most riders
Main Route
8:43 AM Trip
2:23 PM Trip
There are instances when the deviation of service off of the most direct route is appropriate, for
example to avoid a bottleneck or to provide service to major shopping centers, employment
sites, schools, etc. In these cases, the benefits of operating the route off of the main route must
be weighed against the inconvenience caused to passengers already on board. Route
deviations should be considered only under the following conditions:
1. The deviation will result in an increase in overall route productivity
2. The number of new passengers that would be served is equal to or greater than 25% of
the number of passengers who would be inconvenienced by the additional travel time
on any particular deviated trip
SCTA Transportation Development Plan Update | 63. The deviation would not interfere with the provision of regular frequencies and/or the
provision of coordinated service with other routes operating in the same corridor
In most cases where route deviations are provided, they should be provided on an all-day basis.
Exceptions are during times when the sites that the route deviations serve have no activity—for
example, route deviations to shopping centers do not need to serve those locations early in the
morning before employees start commuting to work.
Fixed Routes Should Operate Along Arterials Where Possible
Major Local, Local, and Regional routes should operate on major roadways and should avoid
deviations to provide local circulation. Riders and potential transit users typically have a general
knowledge of an area’s arterial road system and use that knowledge for geographic points of
reference. The operation of bus service along arterials makes transit service faster and easier for
riders to understand and use.
Routes Should be Symmetrical
Routes should operate along the same alignment in both directions to make it easy for riders to
know how to make their return trip. When a route operates in a one-way loop, offering service in
only one direction, passengers are forced to travel out of their way on at least one segment of
their round trip. Exceptions can be made in cases where such operation is not possible due to
one-way streets or turn restrictions. In those cases, routes should be designed so that the
opposite directions parallel each other as closely as possible.
Operating service along the same alignment in both directions makes it easier for riders to
understand service and find their return trip
Symmetrical
Non-Symmetrical
SCTA Transportation Development Plan Update | 7Service Should Serve Well-Defined Markets
To make service easy to understand and to eliminate service duplication, service should be
developed to serve well-defined markets. Ideally, major corridors should be served by only one
route of each route type—for example, one Regional route and one Local route, and not by
multiple Regional routes and multiple Local routes. However, exceptions should be made when
multiple routes should logically operate through the same corridor to unique destinations.
Services Should be Well Coordinated
Where routes connect, schedules should be coordinated to the greatest extent possible to
minimize connection times for the predominant transfer flows.
Service Should Operate with Consistent Schedules
Routes should be scheduled to operate at regular intervals (headways). People can easily
remember repeating patterns but have difficulty remembering irregular ones. For example,
routes that provide four trips an hour should depart from their terminals every 15 minutes. Limited
exceptions can be made in cases where demand spikes during a short period in order to
eliminate or reduce crowding on individual trips.
People can remember repeating patterns much more easily than non-repeating ones
Departures with Clockface Headways: 8:00, 8:15, 8:30, 8:45, 9:00, 9:15, 9:30, etc.
Departures with Inconsistent Frequencies: 8:00, 8:17, 8:32, 8:44, 9:01, 9:13, 9:30, etc.
Stops Should be Spaced Appropriately
The distance between stops significantly impacts travel times. More closely spaced stops provide
customers with more convenient access, as they are likely to experience a shorter walk to the
nearest bus stop. However, they also increase travel times and are the major reason that transit is
slower than automobile travel. Each additional stop requires the bus to decelerate, come to a
complete stop, load and unload riders, and then accelerate and re-merge into traffic. Most
riders want service that balances convenience and speed, and the number and location of
stops is a key component of determining that balance.
Too many stops can make a service unacceptably slow for many potential riders
SCTA Transportation Development Plan Update | 8SCTA’s family of services is tailored toward serving different types of trips and needs, and
therefore fixed-route services have different stop spacing guidelines. In general, Major Local
services, designed to serve a dense areas with relatively high frequency, should have fewer
stops. Local services, which emphasize accessibility, should have more frequent stops. Regional
services should have one to two stops per mile in the low-density regions they serve outside of
urban core areas, but increase stop frequency closer to downtowns. Express services should only
have stops at the major transfer centers they connect.
Guidelines for minimum stop spacing and maximum stops per mile are shown in Table 1.
Exceptions to these guidelines can and should be made in locations where walking conditions
are poor (which is the case along many rural routes) or there are other significant considerations.
Table 1 | Bus Stop Spacing Guidelines
Demand-
Major Local Local Regional Express Response
1,300 (within
urban areas)
Minimum Stop
1,300 800 2,000 (outside 2,600 —
Spacing (feet)
of urban
areas)
4 (within
Maximum Stops urban areas
4 4-6 1 —
per Mile 1-2 (outside of
urban areas)
Service Design Should Maximize Service
The distance and travel time of a route determine how efficiently a bus can operate. The length
of the route and the time it takes to make each trip impact how long of a layover is required at
each end and how many buses are needed to provide the service. Service should be designed
to maximize the time a vehicle is in service and minimize the amount of time it is out of service.
Often, it may be more efficient to extend a route to pick up a few more passengers and limit the
amount of layover time.
SCTA Transportation Development Plan Update | 94 SERVICE LEVEL GUIDELINES
Service level guidelines define when service should be provided and how often it should be
provided. There are five service level guidelines:
1. Service Coverage
2. Minimum Spans of Service
3. Minimum Service Frequencies/Trips
4. On-Time Performance
5. Passenger Loadings
In combination with the Performance and Productivity Guidelines presented in Section 5, the
Service Level Guidelines help to determine appropriate service levels for each route. On an
ongoing basis, each bus service type should operate based on these span of service guidelines
and service frequency guidelines. If minimum productivity guidelines can be met, service spans
may be expanded to earlier in the morning and later at night. In addition, service should be
added when ridership increases to levels that exceed maximum loading guidelines. Conversely,
service should be evaluated and potentially reduced when ridership falls below the minimum
productivity guidelines.
Service Guidelines Basis
In order to ensure delivery of equitable, reliable, and productive transit service, SCTA should
establish Minimum Spans of Service, Minimum Service Frequencies/Trips, On-Time Performance,
and Passenger Loadings guidelines similar to those required of large transit service operators by
the Federal Transit Administration. The additional Performance and Productivity Guidelines
presented in Section 5 are metrics used by the Pennsylvania Department of Transportation to
ensure that SCTA is performing in accordance with the commonwealth’s Act 44 productivity
requirements.
Service Coverage
Public transit is designed to be mass transportation rather than personalized transportation.
Accordingly, it is most effective in areas where sufficient numbers of people live and work in
close proximity. Population density and employment density are the best indicators of whether
there will be underlying demand for productive transit service. At minimum, local fixed-route
service requires densities of at least three households per acre, four jobs per acre, or a
combination thereof. More frequent service is appropriate for areas with higher population and
job densities (see Figure 1). SCTA will endeavor to provide local service in all areas where
population and employment densities exceed these thresholds.
SCTA Transportation Development Plan Update | 10Figure 1 | Transit Supportive Population and Employment Densities
Source: Composite data compiled from various sources by Nelson\Nygaard
SCTA will also consider other factors when examining demand for service. Socioeconomic
characteristics can increase or decrease underlying demand; for example, income levels or the
number of households without automobiles or fewer automobiles than workers.
Minimum Spans of Service
The number of hours per day when transit service is provided along a route, a segment of a
route, or between two locations plays a role in determining the attractiveness of transit service to
potential users. Transit service must be available near the time a trip needs to be made in order
for transit to be a travel option. Passenger needs and SCTA’s financial capacity are key
considerations in setting weekday service spans and in deciding which routes are operated on
Saturdays and Sundays. Weekday routes should permit workers and students to make their
morning start times, and they should end late enough to provide return trips home for second
shift workers. Service oriented to non-work travel can start later and end sooner.
The guidelines for minimum spans of service define the minimum periods of time during which
each service type should operate. Minimum span of service guidelines are presented in Table 2.
Express services have an AM and PM peak service span on weekdays. Note that service can
start earlier and end later if demand warrants, but the extra service would be subject to the
minimum Performance and Productivity Guidelines presented in Section 5.
Table 2 | Minimum Span of Service Guidelines
Major Local Local Regional Express Demand-Response
Weekdays
Begin 6 AM 6 AM 6 AM 6 AM 4 PM 6 AM
End 10 PM 7 PM 6 PM 8 AM 6 PM 6 PM
Saturdays
Begin 7 AM 7 AM As needed As needed As needed
End 10 PM 7 PM
Sundays
Begin 8 AM 11 AM As needed As needed As needed
End 8 PM 6 PM
Note: The beginning span of service refers to the departure of the first inbound trip. The ending span of service refers to
the departure time of the last outbound direction trip.
SCTA Transportation Development Plan Update | 11Minimum Service Frequencies
Service frequency is measured as either the time interval between two vehicles traveling in the
same direction on the same route, or the number of one-way trips per time period for Regional
and Express service. It has a major influence on transit ridership: high frequency service is
considered a key characteristic of attractive service. At the same time, frequency has a
significant impact on operating costs, and vehicle and service hour requirements increase with
improvements in service frequency.
Because of the expense of high frequency service, transit service frequency is normally based
upon existing or potential demand. This often translates into variations in service frequency
throughout the day, with higher frequency in peak periods and less frequent service outside of
the peak.
In general, frequencies are established to provide enough vehicles past the maximum load
point(s) on a route to accommodate the passenger volume and stay within recommended
loading guidelines. Minimum service frequency guidelines are presented in Table 3. When not
specified, there is no respective frequency standard. Frequencies for these services are set
based on demand. When a corridor is served by multiple routes, effective service frequencies in
the corridor would be more frequent than those of individual routes.
Table 3 | Minimum Service Frequency Guidelines (in minutes or trips per period)
Demand-
Major Local Local Regional Express Response
Weekdays
Early AM (before 6 AM) 30 min. 60 min. — —
AM Peak (6 AM – 8 AM) 15 min. 30 min. 6 trips 6 trips
N/A
Midday (8 AM – 4 PM) 15 min. 60 min. 4 trips —
PM Peak (4 PM – 6 PM) 15 min. 30 min. 6 trips 6 trips
Evening (after 6 PM) 30 min. 60 min. — —
Saturdays
Day (before 6 PM) 30 min. 60 min. 8 trips — N/A
Evening (after 6 PM) 60 min. 60 min. — —
Sundays
N/A
All Day 60 min. 60 min. 8 trips —
Note: “—“ indicates that the guideline does not apply. The guidelines apply to services that SCTA provides during the
given periods; they do not imply that all services will be provided at all times.
Clockface service intervals (e.g. every 10, 15, 20, 30, or 60 minutes) are easier for passengers to
remember and can help facilitate better transfer connections between routes. Whenever
possible, frequencies should be set at regular clockface intervals. However, there are two key
exceptions:
1. Where individual trips must be adjusted away from clock-face intervals to meet shift
times, work times, transfer connections, or other special circumstances
2. Where the desired frequency of service causes round trip recovery time to exceed 20%
of the total round-trip vehicle time, leading to inefficient service
SCTA Transportation Development Plan Update | 12On-Time Performance
SCTA may consider a bus serving a fixed-route “on-time” within a window of zero minutes early
to five minutes late. An exception to this definition is for a bus that arrives early at its final
timepoint, as no passengers will be boarding there. The on-time performance considers the
percentage of time that a route performs within this window. The percentage allowed for on-
time performance for fixed-route service should not be less than 85 percent.
SCTA may consider a demand-response vehicle “on time” within 15 minutes before or after the
scheduled pickup and dropoff time. The percentage allowed for on-time performance for
demand-response service should not be less than 90 percent.
Passenger Loading
SCTA will design its services to keep the number of passengers on its vehicles at a comfortable
level, always within the limits of safety. During peak periods, some passengers may have to stand
for part of the trip. During off-peak periods and for service that operates long distances, service
will be designed to try to provide a seat to all customers. To keep passenger loads within
acceptable levels, SCTA will provide more frequent service, with service frequencies set to keep
passenger loads within the limits presented in Table 4.
The vehicle load standard is calculated on the basis of an average for both the peak and off-
peak periods, at the busiest point on the route. For instance, if a route operates every 15
minutes, then four buses would pass the busiest point in an hour. The average number of
passengers for those four buses must fall within the service standards, even though any one of
those buses may be more crowded than the average. If the average number exceeds the
passenger load standard, SCTA will consider more frequent service to improve the situation.
Table 4 | Average Vehicle Load Maximums
Major Demand-
Local Local Regional Express Response
Average Maximum Passenger Loading (as a percentage of seating capacity)
Peak (7-9 AM and 4-6 PM) 120% 120% 100% 100% 100%
Off-Peak (all other times) 100% 100% 100% 100% 100%
Note: Maximums are averages over one-hour periods; individual trips may exceed averages.
SCTA Transportation Development Plan Update | 135 PERFORMANCE AND
PRODUCTIVITY GUIDELINES
SCTA must use its resources effectively, and all routes should achieve a minimum level of
productivity and performance. To assess route productivity and to ensure compliance with the
Commonwealth of Pennsylvania’s Act 44-mandated five-year performance targets, SCTA
applies four performance and productivity guidelines to all routes: 1
1. Passengers per Revenue Vehicle Hour
2. Operating Cost per Passenger
3. Operating Revenue per Revenue Vehicle Hour
4. Operating Cost per Passenger
Applying Performance and Productivity Guidelines
In accordance with Act 44, each of the four target measures increase annually at a consistent
rate for fixed-route services. All service should achieve at minimum 60% of each target measure
for the year operated. Changes should be made to improve route performance in cases where
routes do not meet the 60% of target performance guideline. These changes can include a
variety of measures, including reconfiguring the route alignment to attract more passengers,
targeted marketing, eliminating particularly unproductive segments, and reducing service levels.
If no changes that improve performance can be identified, steps may be taken to discontinue
the route unless it serves a demonstrable critical need that is not served by other routes or
services (including paratransit service).
Routes whose performance and productivity measures fall between 60% and 80% of the target
need improvement. To increase productivity levels on routes that need improvement, SCTA
should consider minor service design changes, schedule adjustments, and targeted marketing.
Routes attaining a productivity level of at least 80% of the target are operating at a satisfactory
level. In cases where a route’s performance and productivity measures are higher than the
Target measure, SCTA may consider service expansion. In cases where service expansion is
considered, SCTA should develop performance and productivity estimates that indicate that
there is a reasonable certainty that the new service will perform above 60% of the Target
measure within 12 months of implementation.
1These performance targets are required to comply with Act 44 performance criteria and represent the
minimum performance levels that SCTA should work to achieve during the next review cycle in 2021. These
performance measures were established by the Pennsylvania Department of Transportation using a
comparison of the historical operating data of peer transit systems. SCTA’s performance and productivity
guidelines must be updated following the release of every PennDOT Act 44 Performance Review Report.
SCTA Transportation Development Plan Update | 14Targets for Passengers per Revenue Vehicle Hour
Ridership targets are expressed in terms of Passengers per Revenue Vehicle Hour, or in simpler
terms, the average number of passengers that a bus should serve for each hour it is in service. As
established by PennDOT for SCTA, these targets for Passengers per Revenue Vehicle Hour
increase at a rate of 2% per year. The “Satisfactory” target for Major Local routes reflects
PennDOT’s year-by-year targets for Passengers per Revenue Vehicle Hour. Tables 1 – 5 present
these target measures by service type.
Table 1 | Major Local Routes Targets for Passengers per Revenue Vehicle Hour
Passengers per Revenue Vehicle
Hour 2018 2019 2020 2021
Weekdays and Weekends
Good (Target) 29.0 29.5 30.0 30.5
Satisfactory (80% of Target) 23.0 23.5 24.0 24.5
Needs Improvement (60% of Target) 17.0 17.5 18.0 18.5
Table 2 | Local Routes Targets for Passengers per Revenue Vehicle Hour
Passengers per Revenue Vehicle
Hour 2018 2019 2020 2021
Weekdays and Weekends
Good (Target) 19.0 19.4 19.8 20.2
Satisfactory (80% of Target) 15.0 15.3 15.7 16.0
Needs Improvement (60% of Target) 12.0 12.3 12.5 12.8
SCTA Transportation Development Plan Update | 15Table 3 | Regional Routes Targets for Passengers per Revenue Vehicle Hour
Passengers per
Revenue Vehicle
Hour 2018 2019 2020 2021
Weekdays and
Weekends 12.75
Good (Target) 10.25
Satisfactory (80% 12.0 12.25 12.5
7.75
of Target) 9.5 9.75 10.0
Needs 7.0 7.25 7.5
Improvement
(60% of Target)
Table 4 | Express Routes Targets for Passengers per Revenue Vehicle Hour
Passengers per Revenue Vehicle
Hour 2018 2019 2020 2021
Weekdays and Weekends
Good (Target) 11.0 11.2 11.4 11.7
Satisfactory (80% of Target) 9.0 9.2 9.4 9.6
Needs Improvement (60% of Target) 6.0 6.1 6.2 6.4
Table 5 | Demand-Response Targets for Passengers per Revenue Vehicle Hour
Passengers per Revenue Vehicle Hour Demand-Response
Weekdays and Weekends
Good (Target) 2.5
Satisfactory (80% of Target) 2.0
Needs Improvement (60% of Target) 1.5
SCTA Transportation Development Plan Update | 16Targets for Operating Cost per Passenger
Cost effectiveness targets are expressed in terms of Operating Cost per Passenger, or in simpler
terms, the average amount that it costs to provide service per passenger. As established by
PennDOT for SCTA, these targets for Operating Cost per Passenger increase at a rate of 1% per
year for every fixed-route service type. The “Satisfactory” target for Major Local routes reflects
PennDOT’s year-by-year targets for Operating Cost per Passenger. Tables 6 – 10 present these
target measures for Operating Cost per Passenger by service type.
Table 6 | Major Local Routes Targets for Cost per Passenger
Cost per Passenger 2018 2019 2020 2021
Weekdays and Weekends
Good (Target) $3.20 $3.25 $3.30 $3.35
Satisfactory (80% of Target) $4.00 $4.10 $4.20 $4.25
Needs Improvement (60% of Target) $4.80 $4.90 $5.00 $5.10
Table 7 | Local Routes Targets for Cost per Passenger
Cost per Passenger 2018 2019 2020 2021
Weekdays and Weekends
Good (Target) $3.60 $3.65 $3.70 $3.75
Satisfactory (80% of Target) $4.50 $4.55 $4.60 $4.65
Needs Improvement (60% of Target) $5.40 $5.45 $5.50 $5.55
Table 8 | Regional Routes Targets for Cost per Passenger
Cost per Passenger 2018 2019 2020 2021
Weekdays and Weekends
Good (Target) $6.00 $6.05 $6.10 $6.15
Satisfactory (80% of Target) $7.50 $7.60 $7.70 $7.80
Needs Improvement (60% of Target) $9.00 $9.10 $9.20 $9.30
Table 9 | Express Routes Targets for Cost per Passenger
Cost per Passenger 2018 2019 2020 2021
Weekdays and Weekends
Good (Target) $6.40 $6.45 $6.55 $7.00
Satisfactory (80% of Target) $7.90 $8.00 $8.10 $8.15
Needs Improvement (60% of Target) $9.40 $9.50 $9.60 $9.70
SCTA Transportation Development Plan Update | 17Table 10 | Demand-Response Targets for Cost per Passenger
Cost per Passenger Demand-Response
Weekdays and Weekends
Good (Target) $8.00
Satisfactory (80% of Target) $9.60
Needs Improvement (60% of Target) $11.10
SCTA Transportation Development Plan Update | 18Targets for Operating Cost per Revenue Vehicle Hour
The efficiency of service delivery may also be quantified with a measure of Operating Cost per
Revenue Vehicle Hour. As established by PennDOT for SCTA, these targets for Cost per Revenue
Vehicle Hour are set to increase at a rate of no more than 3% per year for all fixed-route services.
The “Satisfactory” target for Regional Routes reflects PennDOT’s year-by-year targets for
Operating Cost per Revenue Vehicle Hour. Tables 11 – 15 present the target measures for
Operating Cost per Revenue Vehicle Hour by service type.
Table 11 | Major Local Routes Targets for Cost per Revenue Vehicle Hour
Cost per RVH 2018 2019 2020 2021
Weekdays and Weekends
Good (Target) $64.00 $66.00 $68.00 $70.00
Satisfactory (80% of Target) $74.00 $76.25 $78.50 $80.75
Needs Improvement (60% of Target) $84.00 $86.50 $89.00 $92.00
Table 12 | Local Routes Targets for Cost per Revenue Vehicle Hour
Cost per RVH 2018 2019 2020 2021
Weekdays and Weekends
Good (Target) $64.00 $66.00 $68.00 $70.00
Satisfactory (80% of Target) $74.00 $76.25 $78.50 $80.75
Needs Improvement (60% of Target) $84.00 $86.50 $89.00 $92.00
Table 13 | Regional Routes Targets for Cost per Revenue Vehicle Hour
Cost per RVH 2018 2019 2020 2021
Weekdays and Weekends
Good (Target) $84.00 $86.50 $89.00 $92.00
Satisfactory (80% of Target) $94.00 $97.00 $100.00 $103.00
Needs Improvement (60% of Target) $104.00 $107.00 $110.00 $113.50
Table 14 | Express Routes Targets for Cost per Revenue Vehicle Hour
Cost per RVH 2018 2019 2020 2021
Weekdays and Weekends
Good (Target) $88.70 $91.40 $94.10 $96.60
Satisfactory (80% of Target) $98.70 $101.70 $104.70 $107.90
Needs Improvement (60% of Target) $108.70 $112.00 $115.30 $118.80
SCTA Transportation Development Plan Update | 19Table 15 | Demand-Response Targets for Cost per Revenue Vehicle Hour
Cost per RVH Demand-Response
Weekdays and Weekends
Good (Target) $55.00
Satisfactory (80% of Target) $66.00
Needs Improvement (60% of Target) $77.00
SCTA Transportation Development Plan Update | 20Targets for Operating Revenue per Revenue Vehicle Hour
The cost-efficiency of service delivery may also be quantified with a measure of Operating
Revenue per Revenue Vehicle Hour. Operating revenue is composed of fares and other non-
subsidy revenues. As established by PennDOT for SCTA, these targets for Revenue per Revenue
Vehicle Hour are set to increase at a rate of 2% per year for all fixed-route services. The
“Satisfactory” target for Local Routes reflects PennDOT’s year-by year targets for Operating Cost
per Revenue Vehicle Hour. Tables 16 – 20 present the target measures for Operating Revenue
per Revenue Vehicle Hour by service type.
Table 16 | Major Local Routes Targets for Revenue per Revenue Vehicle Hour
Revenue per RVH 2018 2019 2020 2021
Weekdays and Weekends
Good (Target) $46.00 $47.00 $48.00 $49.00
Satisfactory (80% of Target) $37.00 $37.75 $38.50 $39.25
Needs Improvement (60% of Target) $28.00 $28.50 $29.00 $29.50
Table 17 | Local Routes Targets for Revenue per Revenue Vehicle Hour
Revenue per RVH 2018 2019 2020 2021
Weekdays and Weekends
Good (Target) $37.00 $37.75 $38.50 $39.25
Satisfactory (80% of Target) $30.00 $30.50 $31.00 $31.75
Needs Improvement (60% of Target) $22.50 $23.00 $23.50 $24.00
Table 18 | Regional Routes Targets for Revenue per Revenue Vehicle Hour
Revenue per RVH 2018 2019 2020 2021
Weekdays and Weekends
Good (Target) $25.00 $25.50 $26.00 $26.50
Satisfactory (80% of Target) $20.00 $20.50 $21.00 $21.50
Needs Improvement (60% of Target) $15.00 $15.30 $15.60 $16.00
Table 19 | Express Routes Targets for Revenue per Revenue Vehicle Hour
Revenue per RVH 2018 2019 2020 2021
Weekdays and Weekends
Good (Target) $24.00 $24.50 $25.00 $25.50
Satisfactory (80% of Target) $19.00 $19.50 $20.00 $20.50
Needs Improvement (60% of Target) $14.00 $14.30 $14.60 $15.00
SCTA Transportation Development Plan Update | 21Table 20 | Demand-Response Targets for Revenue per Revenue Vehicle Hour
Revenue per RVH Demand-Response
Weekdays and Weekends
Good (Target) $5.50
Satisfactory (80% of Target) $4.25
Needs Improvement (60% of Target) $3.00
SCTA Transportation Development Plan Update | 226 SCTA Route Classifications
BARTA RRTA
Major Local Routes Major Local Routes
1 – Temple via 5th Street 14 – Rockvale Square
4– 10th/11th Street
15 – Berkshire Mall Local Routes
16 – Broadcasting Square 1 – Park City A – Southeast
2 – Manor Ave – 6th Ward
Local Routes 3 – Park City C – 8th Ward
5 – Albright College 5 – Grandview / Rossmere
7 – Pennside 16 – Millersville
8 – Reifftown / Exeter Square 20 – Greenfield
9 – Grill via Kenhorst
10 – Brookline Regional Routes
11 – Mohnton via Shillington 10 – Lititz
12 – Lincoln Park via Reading Hospital 11 – Ephrata
17 – Glenside / Airport / Berks Heim 12 – New Holland
18 – Schuylkill Avenue 13 – White Horse
19 – Riverside / First Energy / Cotton Street 15 – Willow Street
17 – Columbia
Regional Routes 18 – Elizabethtown
14 – Wernersville via Sinking Spring 19 – Manheim
20 – Route 61 / Hamburg 30 – Columbia / Park City / Lititz Pike
23 – Sinking Spring / Temple via Berkshire Mall
Express Routes
Express Routes 14X – Gap via Rockvale Square
8X – Birdsboro via Exeter Square
Other Services
MU Xpress
MU Park City Xpress
Inter-County
Express Routes
RLX – Reading-Lancaster Express via Ephrata
SCTA Transportation Development Plan Update | 23You can also read