Tuition and Fees 2022-23 - State Council of Higher Education for Virginia - at Virginia State-Supported Colleges
←
→
Page content transcription
If your browser does not render page correctly, please read the page content below

State Council of2022-23
                    Higher          Education
                          Tuition and Fees Report for Virginia

           2022-23
      Tuition and Fees
at Virginia State-Supported Colleges and
                Universities
                August 2022    1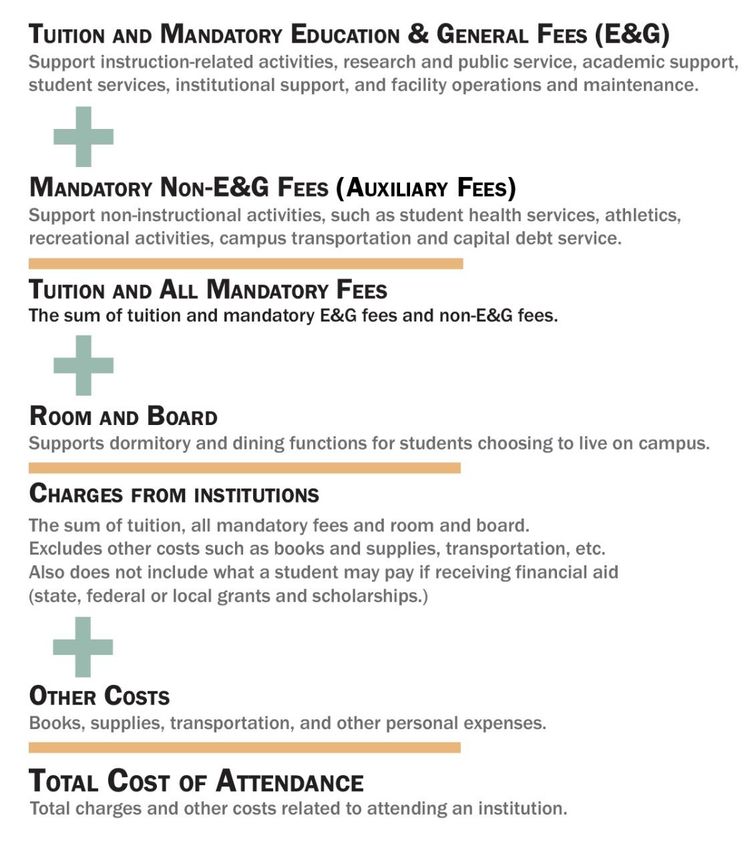
2022-23 Tuition and Fees Report

                                                   Table of Contents
Summary ................................................................................................................................... 1
Introduction .............................................................................................................................. 3
Tuition and Fees for the 2022-23 Academic Year ................................................................. 5
State Funding and Tuition and Fee Trends .......................................................................... 12
Tuition and Fee Comparisons To Other States..................................................................... 16
Pathways To Increase Affordability Beyond Tuition and Fees ............................................ 21
Appendix A: Higher education Funding Policies .................................................................. 27
Appendix B: 2022-23 Full-Time In-State Undergraduate Student Charges ....................... 31
Appendix C: 2022-23 Variable Tuition and Mandatory E&G fees to In-State
Undergraduate Students by School and Program ............................................................... 32
Appendix D-1: 2021-23 Full-Time In-State Undergraduate Student Charges .................... 33
Appendix D-2: 2021-23 Full-Time Out-of-State Undergraduate Student Charges ............. 34
Appendix D-3: 2021-23 Full-Time In-State Graduate Student Charges ............................. 35
Appendix D-4: 2021-23 Full-Time Out-of-State Graduate Student Charges ...................... 36
Appendix D-5: 2021-23 In-State First Professional Student Charges ................................ 37
Appendix D-6: 2021-23 Out-of-State First Professional Student Charges ......................... 38
Appendix E-1: Full-Time Undergraduate Mandatory Non-educational and General Fees by
Program .................................................................................................................................. 39
Appendix E-2: Full-Time Undergraduate Mandatory Non-Educational and General Fees by
Fee Item (Cont.)1 .................................................................................................................... 41
Appendix E-3: Explanation of Increases in Mandatory Non-E&G Fees over the Limit of 3%
in 2022-23 compared to 2021-22 rates* ............................................................................ 42
Appendix F-1: In-State Undergraduate Tuition and Total Mandatory Fees in Selected
States (Public Doctoral/ Research Universities) ................................................................. 43
Appendix F-2: In-State Undergraduate Tuition and Total Mandatory Fees in Selected
States (Public Comprehensive Colleges and Universities) ................................................. 44
Appendix F-3: In-State Undergraduate Tuition and Total Mandatory Fees in Selected
States (Public Associate-degree-granting Colleges) ........................................................... 45
Appendix G: The Relationship Between Tuition and Fee Increases and State Funding ... 46
Appendix H: Tuition and Fees Public Comment ................................................................... 49
2022-23 Tuition and Fees Report
SUMMARY
Each year, the State Council of Higher Education for Virginia (SCHEV) provides a
tuition and fees report based on charges approved by boards of visitors at Virginia
pubic institutions. The report includes a list of tuition and fee charges to in-state and
out-of-state students and for undergraduate and graduate programs. It also provides
trends over time and comparisons to other states and highlights affordable options
students can choose to reduce costs.
The requirements for the report are outlined in the Appropriation Act and are provided
to the Governor and the chairs of the House Appropriations and Senate Finance and
Appropriations Committees (Item 4-2.01.b.4.b).
The following are key findings from the 2022-23 Tuition and Fees Report.
Tuition and mandatory educational and general (E&G) fees (those fees related to instruction
and supported by the state) increased by $229 (2.6%) for in-state undergraduate students at
the system level. Four institutions (Norfolk State University, Virginia Military Institute,
William & Mary and Virginia Community College System) did not increase tuition and
mandatory E&G fees in 2022-23.
Mandatory non-educational and general (those fees related to non-instructional or
“auxiliary” activities) increased by $137 (3.3%).
The average tuition and all mandatory fees for in-state undergraduates is $13,554, a $366
(2.8%) increase from the prior year.
Room and board charges averaged $11,981 at baccalaureate institutions, an increase of $478
(4.2%).
Total charges at baccalaureate institutions — the average sum of tuition, all mandatory fees
and room and board — are $26,484 for the 2022-23 academic year, an increase of $887
(3.5%) for in-state undergraduate students.
While charges have increased, Virginia undergraduate students on average will pay 46% of
the costs related to education, while the state will provide 54%. This is a four-percentage
point increase, in state support, as a result of increased state investment in higher education
in the 2022-24 biennium. This percentage is still below Virginia’s cost-share policy of
covering 67% of costs. SCHEV staff estimates that if the state funded institutions at the level
of the cost-share policy (67%), tuition could be as much as $2,700 (34%) lower than current
levels.
1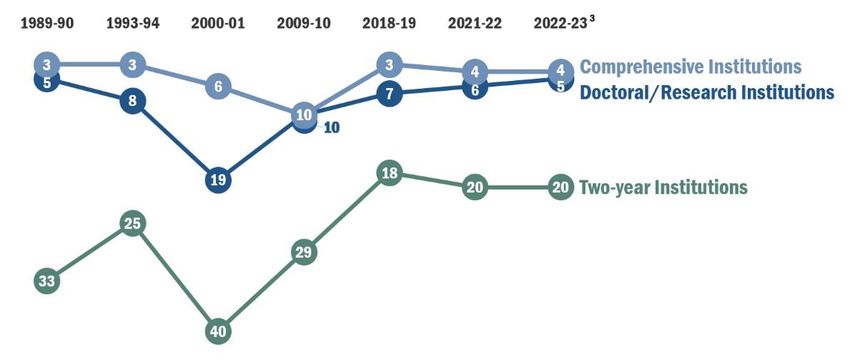
2022-23 Tuition and Fees Report
The total charges for in-state undergraduates as a percentage of per-capita disposable income
remains higher than the national average at 44.9%.
Students who complete an associate degree at a community college and transfer to a
baccalaureate institution can save an average of $20,065 of the cost of a bachelor’s degree.
While reported tuition and E&G fees increased, most institutions used one-time funding or
deferred costs to hold these increases to zero for in-state undergraduate students in 2022-23.
Chart 1: 2022-23 Full-Time In-State Undergraduate Total Charges
Institution Type Charges Amt Increase % Increase
Baccalaureate Institution Average
Tuition and Mandatory E&G Fees $9,731 $258 2.7%
Mandatory Non-E&G Fees $4,773 $151 3.3%
Tuition and All Mandatory Fees $14,504 $409 2.9%
Room and Board $11,981 $478 4.2%
Total Charges $26,484 $887 3.5%
Virginia Community College System
Tuition and Mandatory E&G Fees $4,606 $0 0.0%
Mandatory Non-E&G Fees $14 $0 0.0%
Total Charges $4,620 $0 0.0%
1
All Public Institutions' Average
Tuition and Mandatory E&G Fees $9,212 $229 2.6%
Mandatory Non-E&G Fees $4,343 $137 3.3%
Tuition and All Mandatory Fees $13,554 $366 2.8%
Room and Board $11,988 $449 3.9%
2
Total Charges $24,838 $788 3.3%
Notes:
(1) Includes Richard Bland College -- a selective, residential, two-year college to prepare students for transfer to four-
year colleges.
(2) Average charge for the majority of students at each institution, excluding tuition differentials..
2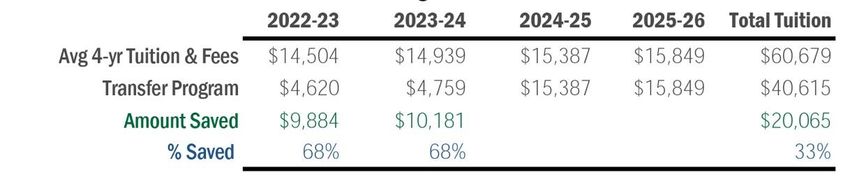
2022-23 Tuition and Fees Report
INTRODUCTION
The Appropriation Act directs the State Council Introduction At a Glance
of Higher Education for Virginia (SCHEV) to
Virginia’s Appropriation Act directs
submit an annual report to the Governor and SCHEV to issue an annual Tuition &
Fees Report by August 1 (Item 4-
the chairs of the House Appropriations and 2.01.b.4.b).
Senate Finance and Appropriations
Higher education is increasingly
Committees documenting the annual change in important to ensure a strong labor
market and quality of life.
total charges for tuition and fees approved by
the boards of visitors at Virginia public In 2022-23, the total charges for in-
state undergraduates as a percentage
institutions of higher education. The Act states: of per-capita disposable income at
Virginia institutions decreased slightly
“b) The State Council of Higher Education for from the historical high.
Virginia shall report to the Governor and the Affordable access is an important
Chairmen of the House Appropriations and component of Pathways to Opportunity:
The Virginia Plan for Higher Education.
Senate Finance and Appropriations Committees
See the appendices for detailed charts
no later than August 1 of each year the annual and comparisons.
change in total charges for tuition and all
required fees approved and allotted by the Board of Visitors. As it deems appropriate, the
State Council of Higher Education for Virginia shall provide comparative national, peer,
and market data with respect to charges assessed students for tuition and required fees at
institutions outside of the Commonwealth.”
~Item 4-2.01.b.4.b, 2022 Virginia Acts of Assembly, Chapter 2.
Education beyond high school, in all forms, has transformative powers. It is both a
public and a private good. The growing importance of higher education as a
requirement for sustainable employment and prosperity imposes an ever-greater
responsibility on the Commonwealth to ensure that Virginia’s public higher-education
system remains not only viable but also vibrant.
Since 2002, Virginia’s public system of higher education has experienced a steady shift
in how it is funded with students and their families contributing a larger share of the
cost through higher tuition and fees. Higher tuition and fees are impacted by the
amount of state funding provided to institutions. Due to large state investments in
higher education in the last two biennia (2020-22 and 2022-24), tuition and fee increases
at Virginia public institutions have remained low for the last three years. As a result, the
32022-23 Tuition and Fees Report
total in-state undergraduate charges as a percentage of per-capita disposable income
continued decreasing slightly from the historical peak of 2019-20.
While Virginia’s tuition and fee charges are high
compared to the nation, affordable options are Virginia undergraduate students
will pay, on average, 46% of the
available for students to attain a degree or
cost of education, four
credential to advance their future. These options percentage point lower than last
include community college transfer programs, year. The state share will increase
financial aid programs offered by the state and to 54% -- demonstrating an
institutions, and other alternative credential increase in state funding support.
opportunities.
Pathways to Opportunity: The Virginia Plan for Higher Education is the statewide
strategic plan for higher education. The plan was revised in 2021 and includes three
goals. One of the goals focuses on making college affordable by lowering costs to
students with a strategy to align state appropriations, financial aid, and tuition and fees.
This report focuses on tuition and fees for in-state undergraduates and provides a
summary of the following four items:
Tuition and fees for the 2022-23 academic year;
State funding and tuition and fee trends;
Tuition and fee comparisons to other states; and
Pathways to increase affordability beyond tuition and fees.
The appendices compare changes in tuition and fees for in-state undergraduate, out-of-
state undergraduate, in-state graduate, out-of-state graduate, in-state first professional
and out-of-state first professional students.
42022-23 Tuition and Fees Report
TUITION AND FEES FOR THE 2022-23 ACADEMIC YEAR
The boards of visitors at each institution set tuition and fees for an academic year
annually. A portion of the cost of education at public institutions in Virginia is funded
by the state. The remaining cost is reflected in the
Tuition and Fees for the 2022-23
tuition and fee charges to students. This section Academic Year At a Glance
provides the definitions of tuition and fees and a
Tuition and mandatory E&G fees
breakout of charges for the 2022-23 academic increased by $229 (2.6%).
year along with comparisons to the prior year.
Mandatory non-E&G fees increased by
$137 (3.3%).
Tuition and fees include several components.
State funding offsets tuition and fees for students The average tuition and all mandatory
fees for in-state undergraduates is
who qualify for in-state tuition. (The graphic on $13,554, a $366 (2.8%) increase from
the following page contains definitions of the the prior year.
various terms used in this report.) Room and board charges average
$11,981 at baccalaureate institutions,
The Commonwealth had a quick economic an increase of $478 (4.2%).
recovery from the COVID-19 pandemic. As of Total charges at baccalaureate
institutions — the average sum of
June 30, 2022, the state reported $1.9 billion in tuition, all mandatory fees and room
surplus revenues. It was the state’s second and board — are $26,484 for the 2022-
23 academic year, an increase of $887
consecutive multibillion-dollar revenue surplus. (3.5%) for in-state undergraduate
In the 2022 session, the Governor and General students.
Assembly provided the largest state investment
to higher education in history with more than $1 billion in additional general fund for
the 2022-24 biennium. The large investment also included partial funding for annual
salary increases of five percent for employees. Institutions share the cost of the salary
increases (about 50% on average). To mitigate the need to raise tuition and fees to
support the salary increases and other costs, the state provided $143 million per year to
institutions affordable access funds and $245 million in additional aid to support
students.
52022-23 Tuition and Fees Report
Tuition and mandatory E&G fees increased by $229 (2.6%) in 2022-23.
Virginia public institutions limited tuition increases in 2022-23 academic year, largely
due to additional funding from the state. At the system level, in-state undergraduate
students, tuition and mandatory E&G fees increased by $229 (2.6%) over the 2021-22
level. Four institutions had a zero tuition increase in 2022-23, three of which have not
increased tuition for four years (Norfolk State University, William & Mary and the
Virginia Community College System).
62022-23 Tuition and Fees Report
Chart 2: 2022-23 Full-Time In-State Undergraduate Tuition and Mandatory E&G Fees1
Institution 2021-22 2022-23 % Increase
Christopher Newport University $9,100 $9,375 3.0%
George Mason University $9,510 $9,795 3.0%
James Madison University $7,460 $7,684 3.0%
Longwood University $8,180 $8,420 2.9%
Norfolk State University $5,752 $5,752 0.0%
Old Dominion University $7,047 $7,257 3.0%
Radford University $8,018 $8,252 2.9%
University of Mary Washington $8,738 $8,998 3.0%
University of Virginia $14,649 $15,339 4.7%
University of Virginia - Wise $6,042 $6,224 3.0%
Virginia Commonwealth University $12,549 $12,956 3.2%
Virginia Military Institute $9,782 $9,782 0.0%
2
Virginia State University $5,769 $6,269 8.7%
Virginia Tech $11,931 $12,289 3.0%
William & Mary $17,570 $17,570 0.0%
Richard Bland College2 $6,000 $6,030 0.5%
Virginia Community College System $4,606 $4,606 0.0%
Average Baccalaureate Institutions $9,473 $9,731 2.7%
Average All Public Institutions $8,983 $9,212 2.6%
Notes:
(1) Tuition and E&G Fees reflect charges for the majority of full-time in-state undergraduate students. JMU, UVA,
VCU,VT and some of VCCS colleges also have tuition differentials by year or by program in addition to tuition and
E&G fees (See Appendix C).
(2) No tuition increase but increased mandatory E&G fees in 2022-23.
While reported tuition and E&G fees increased, most institutions used one-time funding
or deferred costs to hold these increases to zero for in-state undergraduate students in
2022-23.
Appendix B provides the detailed breakout of in-state undergraduate student charges.
Detailed tuition and fee charges by student type and domicile (in-state/out-of-state) are
presented in Appendices D-1 through D-6.
Several baccalaureate institutions charge tuition differentials by student level (year 1,
year 2, etc.) and by program (engineering, business, etc.) in addition to the tuition rates
shown above to in-state and out-of-state students. Some colleges of the Virginia
Community College System (VCCS) have tuition differentials to address unique and
72022-23 Tuition and Fees Report
specific institutional priorities. Appendix C shows Virginia institutions that have tuition
differentials depending on a program or location and the annual 2022-23 increase for in-
state undergraduate students.
Mandatory non-E&G fees increased $137 (3.3%). Institutions exceeded the
3% annual increase cap, but met the allowed exceptions outlined in the
state budget.
Mandatory non-E&G fees support auxiliary activities such as athletics, student health
services, campus transportation and debt service. Unlike instruction, these non-
educational activities receive no state support and are funded almost entirely by the
revenue generated from student fees.
Beginning in 2019, institutions were expected to limit their fee increases to 3% annually.
However, the state gives exemptions for salary and fringe benefit increases authorized
by the General Assembly, student health services and debt service as stated below.
“8. a) Except as provided in Chapters 933 and 943 of the 2006 Acts of Assembly,
Chapters 594 and 616 of the 2008 Acts of Assembly, and Chapters 675 and 685 of the
2009 Acts of Assembly, mandatory fees for purposes other than educational and general
programs shall not be increased for Virginia undergraduates beyond 3% annually,
excluding requirements for wage, salary, and fringe benefit increases, authorized by the
General Assembly…
b) This restriction shall not apply in the following instances: fee increases directly related
to capital projects authorized by the General Assembly; fee increases to support student
health services; and other fee increases specifically authorized by the General Assembly.”
~Item 4-2.01.b.8 a and b, 2022 Virginia Acts of Assembly
Virginia authorized a salary increase of 5% for state employees, including higher
education faculty and staff in FY 2023. Based on the state’s cost-share policy, public
institutions must share the cost of salary increases by using their nongeneral fund
revenues. Institutions that exceeded the 3% increase limit submitted explanations to
meet the exceptions, which were verified by SCHEV.
Detailed lists of mandatory non-E&G fees by institution and program are presented in
Appendix E-1 (by program), E-2 (by fee item) and E-3 (explanation of increases in
mandatory non-E&G fees over the limit of 3% in 2022-23).
82022-23 Tuition and Fees Report
The average tuition and all mandatory fees for in-state undergraduates is
$13,554, a $366 (2.8%) increase from the prior year. These costs range
from $4,620 at the community colleges to $23,970 at William & Mary.
The amount includes tuition, E&G and non-E&G fees. This average is for all public
baccalaureate and associate-degree-granting institutions.
Chart 3: 2022-23 Full-Time In-State Undergraduate Tuition and All Mandatory Fees1
Tuition and All Amt Increase % Increase
Institutions Mandatory Fees Over 2021-22 Over 2021-22
Baccalaureate Institutions
Christopher Newport University $15,425 $501 3.4%
George Mason University $13,404 $285 2.2%
James Madison University $13,092 $454 3.6%
Longwood University $14,600 $510 3.6%
Norfolk State University $9,622 $0 0.0%
Old Dominion University $11,630 $470 4.2%
Radford University $11,916 $374 3.2%
University of Mary Washington $14,294 $464 3.4%
University of Virginia $18,228 $818 4.7%
University of Virginia - Wise $11,498 $337 3.0%
Virginia Commonwealth University $15,642 $524 3.5%
Virginia Military Institute $19,914 $244 1.2%
Virginia State University $9,654 $500 5.5%
Virginia Tech $14,666 $491 3.5%
William & Mary $23,970 $158 0.7%
Associate-Degree-Granting Institutions
Richard Bland College $8,250 $90 1.1%
2
VA Community College System $4,620 $0 0.0%
Average Baccalaureate Institutions $14,504 $409 2.9%
Average Public Institutions $13,554 $366 2.8%
Notes:
(1) Includes mandatory E&G fees and mandatory non-E&G fees, which are charges assessed against students
primarily for Auxiliary Enterprise activities.
(2) Other mandatory fees vary by college, ranging from $75 to $880.50 per academic year, and are not included in
this summary.
Room and board charges averaged $11,981 at baccalaureate institutions,
an increase of $478 (4.2%).
For a student living on campus, room and board charges account for about 45% of the
total cost of their college education.
92022-23 Tuition and Fees Report
Total charges — the average sum of tuition, all mandatory fees and room
and board — are $26,484 for the 2022-23 academic year, an increase of
$887 (3.5%) for in-state undergraduate students at baccalaureate
institutions.
Chart 4 details the average total charges for the next academic year and average increases
in these charges from the previous year at baccalaureate institutions and community
colleges. In the 2022-23 academic year, the total cost for an in-state undergraduate student
living on campus increased by 3.3% (including Richard Bland College). These
institutional charges do not include other expenses related to attendance, such as books,
transportation, supplies, etc.
Chart 4: 2021-22 Full-Time In-State Total Undergraduate Charges
Institution Type Charges Amt Increase % Increase
Baccalaureate Institution Average
Tuition and Mandatory E&G Fees $9,731 $258 2.7%
Mandatory Non-E&G Fees $4,773 $151 3.3%
Tuition and All Mandatory Fees $14,504 $409 2.9%
Room and Board $11,981 $478 4.2%
Total Charges $26,484 $887 3.5%
Virginia Community College System
Tuition and Mandatory E&G Fees $4,606 $0 0.0%
Mandatory Non-E&G Fees $14 $0 0.0%
Total Charges $4,620 $0 0.0%
1
All Public Institutions' Average
Tuition and Mandatory E&G Fees $9,212 $229 2.6%
Mandatory Non-E&G Fees $4,343 $137 3.3%
Tuition and All Mandatory Fees $13,554 $366 2.8%
Room and Board $11,988 $449 3.9%
2
Total Charges $24,838 $788 3.3%
Notes:
(1) Includes Richard Bland College, a selective, residential, two-year college to prepare students for transfer to
four-year colleges.
(2) Average charge for the majority of students at each institution, excluding tuition differentials.
Historical student charges by type, level and institution can be found at
http://research.schev.edu/apps/info/Reports.Guide-to-the-Tuition-and-Fees-Reports.ashx.
102022-23 Tuition and Fees Report
Tuition and Fees Public Comment and Comparison to Six-Year Plan
Proposals
Almost all institutions had a lower tuition and fee increase than originally planned prior to
the state budget process. The lower actual versus planned tuition increase is attributable to
the state support. Conversely, institutions had a larger non-E&G increase than planned.
This is largely a result of the five percent salary increase included in the state budget.
Institutions must fully fund salary increases for staff working in non-E&G positions. Most
institutions did not plan for a five percent salary increase.
Section § 23.1-307.G of the Code of Virginia, requires SCHEV to provide “a report on any
increase in undergraduate tuition and mandatory fees at a public institution of higher
education, the public comment relating to such increase in undergraduate tuition and
mandatory fees, and any deviation in the increase in undergraduate tuition and mandatory
fees from the increase projected in the institutional six-year plan provided pursuant to
§ 23.1-306." Chart 5 compares the planned increase and actual increase in in-state
undergraduate tuition and mandatory E&G fees, and mandatory non-E&G fees in 2022-23.
The report on Public Comments is included in Appendix H.
Chart 5: Comparison of Planned and Actual Increases in Tuition and Mandatory E&G Fees and
Mandatory Non-E&G Fees for In-State Total Undergraduate Students In 2022-23
Tuition and E&G Fees Non-E&G Fees
Institution Planned Incr.1 Actual Incr. Planned Incr.1 Actual Incr.
Christopher Newport University 13.2% 3.0% 1.7% 3.9%
George Mason University 3.0% 3.0% 3.0% 0.0%
James Madison University 4.9% 3.0% 3.0% 4.4%
Longwood University 2.9% 2.9% 3.0% 4.6%
Norfolk State University 5.0% 0.0% 3.0% 0.0%
Old Dominion University 6.0% 3.0% 3.0% 6.3%
Radford University 6.0% 2.9% 3.0% 4.0%
University of Mary Washington 2.0% 3.0% 2.0% 4.0%
University of Virginia 4.5% 4.7% 4.2% 4.6%
University of Virginia - Wise 3.0% 3.0% 3.0% 3.0%
Virginia Commonwealth University 5.0% 3.2% 5.0% 4.6%
Virginia Military Institute 3.0% 0.0% 2.5% 2.5%
2
Virginia State University 4.0% 8.7% 4.0% 0.0%
Virginia Tech 4.9% 3.0% 3.9% 5.9%
William & Mary 4.6% 0.0% 3.0% 2.5%
2
Richard Bland College 3.0% 0.5% 3.0% 2.8%
VA Community College System 11.6% 0.0% 0.0% 0.0%
Notes:
(1) Planned increases were provided by institutions in the six-year plans made in 2021.
(2) No increase tuition but increase mandatory E&G fees in 2022-23.
112022-23 Tuition and Fees Report
STATE FUNDING AND TUITION AND FEE TRENDS
The levels at which institutions set tuition and fees depend on institutional costs and
state support. The following section provides background information on the state’s
cost-share policy, the relationship between increases in tuition and E&G fees and state
funding, and trends in total charges.
State Funding and Tuition and
Virginia’s cost-share policy is a Fee Trends At a Glance
commitment by the Commonwealth to The Commonwealth’s cost-share policy
contribute to the costs of higher education establishes the means by which the
cost of education can be shared
for in-state students. between the student and the state.
The state’s goal is to cover 67% of the
cost of higher education for in-state
The Commonwealth’s cost-share policy is students. The remaining 33% is borne
premised on the belief that higher education by the student.
yields both public and private benefits. It The responsibility for paying for higher
education shifted from the state to the
establishes the means by which the cost of student beginning in 2001-02.
education can be shared between the student
In 2022-23, Virginia undergraduate
and the state. The cost-share policy is included in students will pay, on average, 46% of
the costs of education-related funding,
the Code of Virginia (Paragraph A of Section while the state pays for 54%.
23.1-303 of the Higher Education Opportunity
SCHEV staff estimates that if the state
Act) and is included in the Appropriation Act. funded at the level of the cost-share
policy (67%), tuition could be as much
“In determining the appropriate state share of as $2,700 (34%) lower than current
levels.
educational costs for resident students, the General
Assembly shall seek to cover at least 67% of
educational costs.”
~ Item 4-2.01.b 3b, Chapter 2, 2022 Acts of Assembly
The General Assembly established the cost-share policy in 1976 to create more
equitable tuition practices among institutions. Under the original policy, institutions
received appropriations based on the state providing 70% of the cost of education — a
budgetary estimate based on the per-student cost of instruction and support. Students
contributed the remaining 30%. For community colleges, the state funded 80% of the
cost, and students contributed the remaining 20% of costs.
122022-23 Tuition and Fees Report
A recession in 1992-1994 required institutions to increase tuition to offset general fund
budget reductions. By the end of the recession, in-state students contributed up to 40%
of the cost of education at some institutions.
During the 2000 legislative session, the Governor and General Assembly reaffirmed the
policy that in-state undergraduate students should pay a consistent percentage of the
cost of education. The General Assembly appropriated significant state general funding
and directed institutions to begin reducing in-state student tuition charges to 25% of the
average cost at public baccalaureate institutions and 20% at community colleges.
In the 2002-04 biennium, the cost-share relationship between the state and students
changed dramatically due to the reduction in state funding for higher education and
corresponding tuition increases. Between 2001-02 and 2003-04, the state’s share of
higher education costs decreased from 77% to 64%.
In 2004, the Joint Subcommittee on Higher Education Funding Policy developed a goal
to establish a 67%/33% state/student cost-share relationship to fund basic institutional
operations. Since then, the 67%/33% cost-share policy has been applied in various
budget development and policy decisions.
Chart 6 displays the average cost-shares between the Commonwealth and in-state
undergraduate students in 1993-94 (historical low state share of cost), 2001-02 (historical
high state share of cost) and selected recent five years of cost share in 2018-19, 2020-21
and 2022-23. (See Appendix F for a more detailed explanation of how the cost-share
ratio was developed.)
132022-23 Tuition and Fees Report
Chart 6: Cost-Share Relationship between the State and In-State Undergraduate Students
100%
23%
In-State
38%
46% Undergraduate
75% 51%
55% Student Share
50%
77%
62% State
25% 49% 54%
45%
0%
1993-94 2001-02 2018-19 2020-21 2022-23
Notes:
(1) Starting 1993-94, the tuition policy required out-of-state students to pay 100% of the cost, but had no cost-share
requirement for in-state undergraduate students. Calculation was based on the average appropriated cost of
education.
(2) In 2000, the state set the goal of the tuition policy for in-state undergraduate students to pay 25% of the cost. The
2001-02 calculation was based on the average appropriated cost of education.
(3) In 2004, the goal of the tuition policy was set for in-state students to pay 33% of the cost. Since then, the cost
share was calculated based on the average guideline cost of education.
Since 2001-02, the responsibility for paying for higher education has shifted from the
state to the student, but recent investments in higher education by the
Commonwealth have increased the proportion of the state’s share.
From 2018-19 to 2023-24, the General Assembly and Governor provided significant state
investment in higher education, and especially provided specific funding targeted to
contain tuition increases from FY 2020 to FY 2024. As a result, the state share percentage
has gradually increased. From FY 2019 to FY 2023, the state cost share increased from
45% to 54%. This means the in-state undergraduate cost share was reduced by 9%
during this period.
Despite the improvements in the state cost-share, the Commonwealth remains 13
percentage points below the policy goal of 67% as stated in the Code of Virginia.
142022-23 Tuition and Fees Report
SCHEV staff estimates that if the state met its cost-share policy goal of 67%, in-state
undergraduate tuition could be as much as $2,700 (34%) lower than current levels.
The annual increase in total charges from institutions has trended
downward in recent years.
While the state provides funding to help offset education-related costs, concerns remain
about the increase in non-education-related fees and room and board. Chart 7 provides
historical trends of annual increases by cost type. In the last 20 years, increases in non-
educational and general fees and room and board have trended lower and did not
fluctuate as much as annual tuition increases because institutions can control and
manage these non-tuition increases. In comparison, tuition increases were mostly a
result of state funding increases.
Chart 7: Annual Increases of In-State Undergraduate Cost by Type at Baccalaureate Institutions
152022-23 Tuition and Fees Report
TUITION AND FEE COMPARISONS TO OTHER STATES
Tuition and fee rates are affected by the institution’s costs and by the amount of
funding that each state provides to support institutions and students. Many states with
low tuition and fees have high rates of per-student state funding. This section provides
tuition and fee rates compared to other states and historical trends of total tuition and
fee charges as a percentage of per-capita income.
Tuition and Fee Comparisons to
Virginia’s tuition and fee rates are high Other States At a Glance
compared to other states. Virginia’s tuition and fee rates as a
Chart 8 depicts national rankings of Virginia public percentage of per-capita disposable
income are high compared to other
institutions’ tuition and fee charges for in-state states.
undergraduate students. The data came from the Estimated total charges at
tuition and fee survey of the Integrated Postsecondary baccalaureate public institutions as a
percentage of per-capita disposable
Education Data System (IPEDS), a division of the U.S. income decreased slightly to 44.9% in
2022-23 from the historical high of
Department of Education. Based on the 2000 Carnegie 2019-20.
classification of institutions of higher education, this
Virginia’s community colleges’ average
comparison groups national public institutions into charge as a percentage of per-capita
disposable income is estimated to
three categories: doctoral/research, comprehensive and
decrease slightly to 10.9% in 2022-23.
associate-degree-granting colleges.
Higher costs at doctoral/research institutions (William & Mary, George Mason
University, Old Dominion University, University of Virginia, Virginia Commonwealth
University and Virginia Tech) placed Virginia 6th highest in the nation in 2021-22,
whereas this group ranked 19th nationally in the 2000-01 academic year — a time when
tuition was frozen for several years, then reduced by 20% in 1999-2000. SCHEV staff
expects this ranking will rise one position higher in 2022-23.
For comprehensive institutions (Christopher Newport University, James Madison
University, Longwood University, Norfolk State University, Radford University,
University of Mary Washington, University of Virginia’s College at Wise, Virginia
Military Institute and Virginia State University), the 2021-22 national ranking was the 4th
highest. This ranking is expected to remain unchanged in 2022-23.
The total tuition and fees of Virginia’s associate-degree-granting colleges (the Virginia
Community College System and Richard Bland College) was 20th highest in 2021-22.
SCHEV staff expects the associate-degree-granting colleges ranking to remain unchanged
in 2022-23.
162022-23 Tuition and Fees Report
Detailed national comparisons by institution type are presented in Appendices F-1
through F-3.
Chart 8: Virginia’s in-state undergraduate tuition and fee charges rank among the highest for
Doctoral/Research and compared to the nation.
Notes:
(1) Based on full-time in-state undergraduate 2021-22 tuition and fees in the Integrated Postseconday Education
Data System (IPEDS).
(2) Ranking is from highest cost to least cost.
(3) Virginia charges are actual tuition and fees in FY 2023. Charges in other states are estimated by applying 2021-
22 national increase rates of 1.9% for doctoral, 1.5% for comprehensive institutions, and 1.2% for public associate-
degree-granting colleges published in "Trends in College Pricing 2021" by the College Board.
Sources: IPEDS Institutional Characteristics and College Board
These increases can be traced to state budget reductions during the economic recessions
of 2002-04 and 2008-12. Based on 2021 state-funding data from the State Higher
Education Executive Officers association, total state support in Virginia (of all types,
including student financial aid) increased 69% from 2000 to 2021. The average increase
nationally over this period was 82%. Virginia state support per full-time equivalent
(FTE) for education, excluding funding for research, medical education and financial
aid increased from $5,473 in 2000 to $7,213 in 2021. Virginia ranked 31st nationally in
2000 and raised one rank to 30th in 2021. (National comparisons of per-student funding
include all students, not just in-state students.)
172022-23 Tuition and Fees Report
Virginia’s undergraduate total charges as a percentage of per-capita
disposable income are higher than the national average.
One commonly cited indicator of college
affordability is the relationship between total One commonly cited indicator of
charges (tuition, all mandatory fees and room and college affordability is the
board) and per-capita disposable income. relationship between total
charges (tuition, all mandatory
The Bureau of Economic Analysis at the U.S. fees, room and board) and
Department of Commerce defines “per-capita per-capita disposable income.
disposable income” as income available to persons
for spending and saving. It is calculated as personal income less the sum of personal
income tax payments and personal non-tax payments (donations, fees, fines and
forfeitures) to the government.
Virginia’s total charges at baccalaureate public institutions as a percentage of per-
capita disposable income have exceeded the national average every year since 1990,
with the exception of the years between 2004-05 and 2009-10. Chart 9A shows
Virginia’s average in-state undergraduate charges at public baccalaureate institutions as
a percentage of per-capita disposable income over the past 30 years.
In 1994-95, Virginia’s cost-share of per-capita disposable income (38.8%) was 7.2
percentage points higher than the national average (31.6%). Since reaching the low
point (most affordable) of 32.6% in 1999-00 — after several years of state-mandated
tuition controls — this measure of affordability has crept steadily higher.
For 2022-23, the estimated total charges at Virginia’s baccalaureate public institutions
as a percentage of per-capita disposable income is 44.9%, lower than the historical
high of 47.1% in 2019-20.
182022-23 Tuition and Fees Report
Chart 9A: Virginia’s average total in-state undergraduate charges at public baccalaureate institutions
as a percentage of per-capita disposable income are higher than the national average.
47.1%
46.0% 46.5%
45.2% 44.9%
44.7% VIRGINIA
39.6% 42.6% 42.2% NATIONAL
38.8% 40.8%
Virgini 40.1%
33.6% 34.1%
32.6%
34.7%
31.6% 31.6%
N
A
27.8%
1989-90 1994-95 1999-00 2004-05 2009-10 2014-15 2019-20 2020-21 2021-22 2022-23
Note: Cost includes tuition, mandatory fees and room and board.
Sources: College Board, U.S. Bureau of Economic Analysis, SCHEV.
Virginia’s associate-degree-granting institutions’ average charge as a percentage of
per-capita disposable income has declined from its peak of 12.5% in 2019-20. It is
estimated to be 10.9% in 2022-23.
Until the late 1990s, Virginia’s associate-degree-granting institutions’ average charge as
a percentage of disposable income was higher than the national average. As a result of
the tuition rollback in 1999-2000, this percentage dropped below the national average.
Since 2010, Virginia’s associate-degree-granting institutions’ average charge as a
percentage of per-capita disposable income has increased, reaching a historical high of
12.5% in 2019-20. Thanks to the freeze in tuition during the past four years, the average
charge as a percentage of per-capita disposable income has declined and is estimated to
be 10.9% in 2022-23.
Chart 9B shows Virginia’s average in-state undergraduate charges at associate-degree-
granting institutions as a percentage of per-capita disposable income over the past
30 years.
192022-23 Tuition and Fees Report
Chart 9B: Virginia’s average total in-state undergraduate charges at public associate-degree-granting
institutions as a percentage of per-capita disposable income has declined due to a freeze in tuition for
four years at the Virginia Community College System. 12.3%
0.12
12.5%
11.8% 10.6%
10.9%
11.2%
10.3%
10.9%
0.1 10.4% 9.3%
9.3% 8.6% 8.5% VIRGINIA
8.4% 8.4% 8.3%
8.3% 8.2%
7.9% 7.8% 7.8% 8.1%
0.08 7.5%
Virgini7.5% 7.5%
7.2% 7.3% 7.5% 7.3% 7.9% 8.2%
8.3%
7.8% 6.7% 6.8% 6.8% 7.0% 7.1% 7.0% 7.1%
7.7%
6.6% 6.5% 6.5% 6.5% 6.4% 7.5%
6.7% 8.5%
6.4% 6.5% 7.1%
5.9% 6.2%
6.4% 6.2% 6.2% 6.4% 8.2%
5.9% 5.4%
7.6% 7.7%
0.06 7.3% 5.4% 7.4%
6.1%
6.4%
5.1%
5.5%
6.4% 6.5% 6.2%
4.9%
NATIONAL
0.04 5.4%
N 5.2%
A
0.02
1989-90 1994-95 1999-00 2004-05 2009-10 2014-15 2019-20 2020-21 2021-22 2022-23
Notes:
(1) Cost includes tuition and mandatory fees.
(2) The chart includes data from Richard Bland College, commuter-student charges and Virginia Community College
System charges.
Sources: College Board, U.S. Board of Economic Analysis, SCHEV.
202022-23 Tuition and Fees Report
PATHWAYS TO INCREASE AFFORDABILITY BEYOND TUITION AND
FEES
Rising tuition and fees are a concern for students, parents, institutions and
policymakers. While this report highlights an approach to keeping tuition and fees low
through increased state support, additional options available to students, parents and
policymakers offer affordable pathways to a
Pathways to Increase Affordability
credential or degree. The Commonwealth
Beyond Tuition and Fees At a Glance
and its higher education institutions can
State and institutional financial aid
work together to devise plans to make the assistance programs can reduce
cost of education more predictable and student costs.
affordable. For the 2022-24 biennium, Virginia
appropriated $165 million in additional
support for undergraduate need-based
State and institutional financial student aid.
assistance programs can reduce costs
Financial assistance programs include
for students. need-based state aid, the Two-year
Recognizing the need to mitigate relatively College Transfer Grant, Va529 savings
plans, Workforce Credential Grants and
high tuition and fees, the Commonwealth’s G3.
approach increases financial aid for students Net price, the amount students pay if
with demonstrated need. For example, in they receive financial aid, can be much
lower than the total price an institution
2020-21 Virginia undergraduate students at charges.
public institutions received about $1.1
billion in federal, state, institutional and private financial aid grants and scholarships,
most of which was awarded based on financial need. For the 2022-24 biennium, Virginia
appropriated $165 million in additional support for undergraduate need-based student
aid, which includes both statewide and targeted financial aid programs to help ensure
access and affordability for students.
Two-year College Transfer Grant: This transfer grant, established by the General
Assembly in 2007, allows students to obtain an associate degree at a community college in
two years and then transfer to a public baccalaureate institution for the remaining two
years to get a bachelor’s degree. This is the least expensive pathway to obtain a
baccalaureate degree in four years. (This is explained more in Chart 11 and in the two-year
transfer grant section.) On average, an in-state student can save $20,065 (33%) of tuition
and fees in total. In addition, the Transfer Grant provides an incentive for eligible students
to use this pathway. The annual award for an eligible student is $1,000. An additional
212022-23 Tuition and Fees Report
$1,000 per year bonus award is provided to students pursuing undergraduate degrees in
engineering, mathematics, nursing, teaching or science. Also, students transferring to
Norfolk State University, Old Dominion University, Radford University, University of
Virginia at Wise, Virginia Commonwealth University or Virginia State University can
receive an additional $1,000 per year for their junior and senior years. As a result, through
the transfer grant program, eligible students can receive as much as $3,000 in grants as
they pursue a baccalaureate degree.
Virginia 529 Plans: The program was established by the General Assembly in 1995 and
named for Section 529 of the Internal Revenue Code. A 529 plan is a tax-advantaged
investment vehicle designed to encourage saving for future higher-education expenses.
Benefits are not limited to public higher-education institutions in Virginia.
Workforce Credential Grant Program: During the 2016 legislative session, the
Governor and General Assembly created the workforce credential grant program. It allows
students to obtain an industry certification by discounting the cost of noncredit training
required for certification. The program, the first of its kind, focuses on training needed in
high-demand occupations and qualifies individuals for well-paid work. Upon completion,
students can receive a discount of as much as 70% of the cost of training. The program is
currently offered at community colleges across Virginia, where it is known as FastForward,
and through the Southern Virginia Higher Education Center.
G3 at Virginia’s Community Colleges: Launched in 2021-22, this program provides
last dollar funding for students enrolled in in-demand occupations who also meet other
need-based requirements. For those eligible, students pay no tuition and fees.
Programs at colleges and universities offer additional aid, tuition predictability and
affordability. As mentioned, institutions can provide varying amounts of aid to
students to offset the total cost, often based on the resources available to them. In
addition, some institutions have implemented programs that offer more predictability
in tuition for in-state students and a greater commitment to providing financial aid.
William & Mary: Part of the William & Mary Promise, this program offers increased aid to
students with financial need and promises to keep student debt low.
222022-23 Tuition and Fees Report
University of Virginia: The Affordable Excellence program commits the university to help
students with financial need and keep their debt low. It provides 100% of need through
scholarships, grants, work-study and need-based loans. In addition, the University pledges to
fully cover tuition and fees for Virginia families who earn less than $80,000 per year and
cover tuition, fees and room and board for students from Virginia families earning less than
$30,000 per year.
While these programs offer promising practices for
tuition predictability and affordability, institutions
Recognizing the need to mitigate
are able to provide these types of commitments relatively high tuition and fees,
because they are less dependent on the state to the Commonwealth has
provide funding support. They are able to use embraced an approach to
other funding sources to offset potential decreases increase financial aid for
students with demonstrated
in state funding that may impact tuition.
need in order to lower their
Net price, the amount students pay if they overall costs.
receive financial aid, can be much lower
than the total price an institution charges.
While the total charges for students are a significant factor to access and
affordability, just as important for many students is what they pay after receiving
financial aid, a term referred to as “net price.” Net price, is the total cost of attendance
including all tuition and fees, room and board, books and supplies and other expenses
to attend an institution after subtracting scholarships and grants the student receives.
Scholarships and grants are forms of financial aid that a student does not have to pay
back. (The U.S. Department of Education provides information and videos to explain
how net price works.)
The majority of aid is awarded based on financial need. Need-based aid considers
factors such as the student or family income status, assets and other benefits. Therefore,
average net price is best viewed by estimated income level.
Students with high financial need can pay significantly less than the total cost to
attend an institution, but the net price varies by institution. Chart 10 shows the
average net price and average net price by family income at Virginia public
baccalaureate institutions in 2020-21.
232022-23 Tuition and Fees Report
For example, at Radford University, the total cost
While the total charges for to attend (all tuition and fees, room and board,
students are a significant factor books and supplies and other expenses) was
to access and affordability, just
$25,334 in 2020-21, but a student/family with an
as important for many students
is what they pay after receiving estimated income of up to $30,000 could expect to
financial aid, a term referred to pay less than half that amount ($12,335).
as ’net price.’ These rates vary by institution and by income level
and primarily depend on the additional resources
available to an institution (endowments, scholarships and institutional reserves). Often
institutions with high proportions of students demonstrating financial need have fewer
resources available per student than institutions with relatively low proportions of
students who demonstrate financial need.
Chart 10: Cost of Attendance on Campus and Average Net Price by Family Income for Virginia Public
Baccalaureate Institutions in 2020-21
Note: Total cost is the sum of all tuition and required fees, books and supplies, and room and board for a full-time
in-state student.
living on-campus. Average aid includes all federal, state/local government or institutional grant or scholarship aid.
The net prices are estimates and do not represent a final award amount. The cost to attend college and availability
of financial aid may change.
Explore all colleges’ costs and net price at https://nces.ed.gov/collegenavigator/.
Source: IPEDS 2021 COA and net price.
242022-23 Tuition and Fees Report
In general, students and their families should consider their eligibility for financial
aid to determine whether they can afford the cost of the intended college. The U.S.
Department of Education’s College Navigator website provides information to help
students and parents in their college search, including net price and general information
for each college regarding admissions, enrollments, programs and majors, athletics,
campus security, accreditation and loan default rates.
In addition, each institution provides a net-price calculator to help estimate the cost to
attend a college. Links to each college’s net-price calculator are available on the U.S.
Department of Education’s Net Price Calculator website. These estimates do not
represent a final decision, and costs to attend and financial aid award availability can
change; however, these tools can help students better plan for college.
An in-state student can save $20,065, or 33%, of the average cost to attain
a baccalaureate degree by first getting an associate degree at a community
college and then transferring to a public baccalaureate institution.
In addition to assessing net price, students and parents also may consider obtaining an
associate degree before transferring to a baccalaureate institution. Virginia’s community
colleges and Richard Bland College have agreements in place with public baccalaureate
institutions and some private institutions in Virginia that allow students to transfer to a
baccalaureate university as a junior if the student a) first obtains an associate degree at a
community college, and b) meets certain GPA and course requirements. Chart 11
provides the estimated cost savings.
As previously mentioned, low- and middle-income students taking this approach also can
be considered for the Virginia Two-year College Transfer Grant, which further reduces the
costs for students meeting program criteria at a participating baccalaureate institution.
Chart 11: Potential Tuition Savings of the Transfer Program for Students Completing a Baccalaureate
Degree in Four Years
Note: Assuming tuition increases by 3% per year over the base year of 2022-23.
252022-23 Tuition and Fees Report
While transfer is a viable path to an affordable baccalaureate degree, students are
advised to research the appropriate courses needed and expected course grades
required of any baccalaureate institution to ensure that their completed courses can
be transferred from the tw-year institution. Transfer agreement information is
available for associate-degree-granting institutions at the Virginia Wizard website for
Virginia’s community colleges or at Richard Bland College.
Another approach to addressing affordability is for students to complete a
college degree or certificate on time (e.g., associate degree in two years,
baccalaureate degree in four years).
Students who do not complete a college degree often leave with debt and usually end
up with a job with less pay, making it harder to pay the debt.
If students enroll in an institution and do not return, they may incur student debt. A
SCHEV analysis of 2016-17 student dropouts shows that 10% of students who enroll for
the first time in a public or private non-profit college in Virginia do not return after the
first year. Forty percent of these students carry loans with an average debt amount of
$10,204.
In addition, not all students who enroll in a baccalaureate degree program complete it
in four years. Based on SCHEV’s analysis, the average time to complete a degree for a
full-time student upon entry is 4.5 years at a public baccalaureate institution and 3.7
years at an associate-degree-granting institution.
There are many reasons for delays in completing a degree, such as changing personal or
financial circumstances or switching from full-time to part-time status. However,
students will incur more costs through additional tuition and fees and lost earnings for
each additional semester they remain in college.
To complete a degree on time, students should take 30 credits each year. Some
students may not be aware of the number of credits needed to complete a degree. This
can occur because a student is considered full time at an institution if they take 12 or
more credits (the federal financial aid definition of full time). By taking only 12 credits a
semester, a student may not complete a degree on time. Many institutions have
implemented “15-to-finish” or “12 does not equal 4” campaigns. The programs help
build awareness that enrolling in courses that total 15 credits per semester will help
ensure that degree requirements will be met in four years. Institutions also have
developed other strategies to increase completion rates.
262022-23 Tuition and Fees Report
APPENDIX A: HIGHER EDUCATION FUNDING POLICIES
Item 4-2.01.b, Chapter 2, 2022 Acts of Assembly
1. Except as provided in Chapters 933 and 943 of the 2006 Acts of Assembly,
Chapters 594 and 616 of the 2008 Acts of Assembly, and Chapters 675 and 685 of
the 2009 Acts of Assembly, all nongeneral fund collections by public institutions
of higher education, including collections from the sale of dairy and farm
products, shall be deposited in the state treasury in accordance with § 2.2-1802,
Code of Virginia, and expended by the institutions of higher education in
accordance with the appropriations and provisions of this act, provided,
however, that this requirement shall not apply to private gifts, endowment
funds, or income derived from endowments and gifts.
2. a) The Boards of Visitors or other governing bodies of institutions of higher
education may set tuition and fee charges at levels they deem to be appropriate
for all resident student groups based on, but not limited to, competitive market
rates, provided that the total revenue generated by the collection of tuition and
fees from all students is within the nongeneral fund appropriation for
educational and general programs provided in this act.
b) The Boards of Visitors or other governing bodies of institutions of higher
education may set tuition and fee charges at levels they deem to be appropriate
for all nonresident student groups based on, but not limited to, competitive
market rates, provided that: i) the tuition and mandatory educational and
general fee rates for nonresident undergraduate and graduate students cover at
least 100% of the average cost of their education, as calculated through base
adequacy guidelines adopted, and periodically amended, by the Joint
Subcommittee Studying Higher Education Funding Policies, and ii) the total
revenue generated by the collection of tuition and fees from all students is within
the nongeneral fund appropriation for educational and general programs
provided in this act.
c) For institutions charging nonresident students less than 100% of the cost of
education, the State Council of Higher Education for Virginia may authorize a
phased approach to meeting this requirement, when in its judgment, it would
result in annual tuition and fee increases for nonresident students that would
discourage their enrollment.
27You can also read