U.S. Credit Update - February 8, 2021 - Arbor Data Science
←
→
Page content transcription
If your browser does not render page correctly, please read the page content below
U.S. Credit Update – February 8, 2021

•   Industrials Starting to Lose Their Edge
•   Auto Demand Takes a Step Back
•   The Rent Narrative May Get Messy
•   Bank Loans, Munis and TIPS on the March
•   Total Return & Issuance Recap
                                              A Division of

                                              Benjamin Breitholtz and Peter Forbes
                                              datascience.arborresearch.com

                                                                                     1
Industrials Starting to Lose Their Edge

The standout industries in the investment grade
credit space over the past three months have largely
fit into one of three themes.

The hardest hit energy industries, refining, oil field
services and independent shale producers, stormed
ahead of the pack.

Travel industries including airlines, gaming and
lodging dominated among industries with shorter-
duration profiles.

The third theme has been manufacturing and
materials, especially those tied to housing. There are
signs that theme may be running out of gas.

The chart shows three-month excess returns versus
weighted-average duration for each industry index.

© 2021 Arbor Research & Trading, LLC. All Rights Reserved   02-08-2021   2
Industrials Starting to Lose Their Edge

Spread performance over the past month has seen
sustained outperformance in energy. But a new mix of
industries is beginning to overtake materials and
manufacturing.

Real estate, paper, transportation, health care,
communications and insurance were among the top
performers on a spread basis.

The chart one-month change in index option adjusted
spread versus weighted-average duration for each
industry index.

© 2021 Arbor Research & Trading, LLC. All Rights Reserved   02-08-2021   3
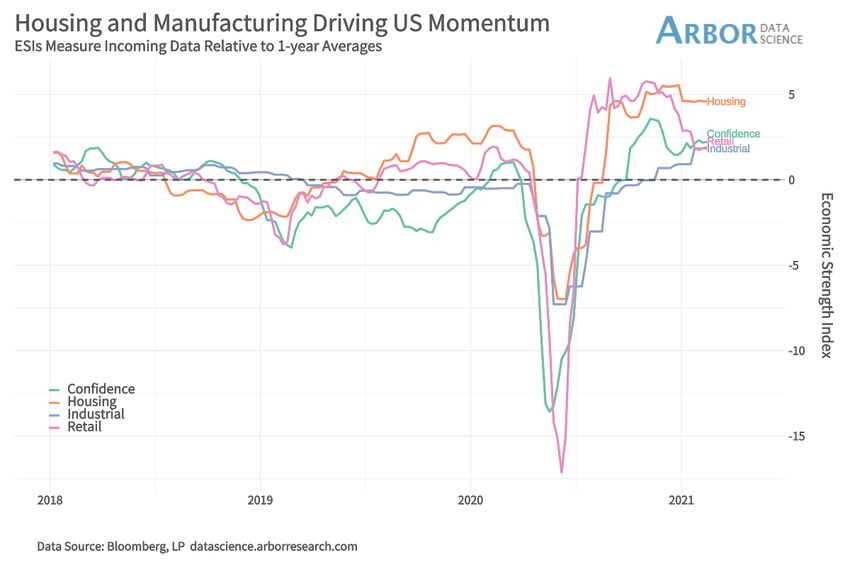
Industrials Starting to Lose Their Edge

As far as reported economic data,
manufacturing and housing remain the two
pillars of economic momentum in the US.

Retail has lost considerable momentum with
consumer goods demand much more muted
that during the spring lockdown.

The latest Google search activity is pointing
to some bumps in the road ahead for
industrial activity, however.

The chart shows our Economic Strength
Indices, which measure income incoming data
relative to one-year averages for each
category of economic data.

© 2021 Arbor Research & Trading, LLC. All Rights Reserved   02-08-2021   4
Industrials Starting to Lose Their Edge

  Google search activity in both industrial and
  services categories turned sharply lower
  relative to forecasts over the past two weeks.

  Search activity is failing to keep up with
  expectations as the US economy tries to
  power through to the post-vaccine era.

  Monday’s post and subsequent posts this
  week will dive into the details of the
  slowdown and the implications for markets.
  Stay tuned!

  The chart aggregates Google searches across
  several dozen categories, showing the four-
  week average of search activity relative to
  forecasts in five key sectors.

© 2021 Arbor Research & Trading, LLC. All Rights Reserved   02-08-2021   5
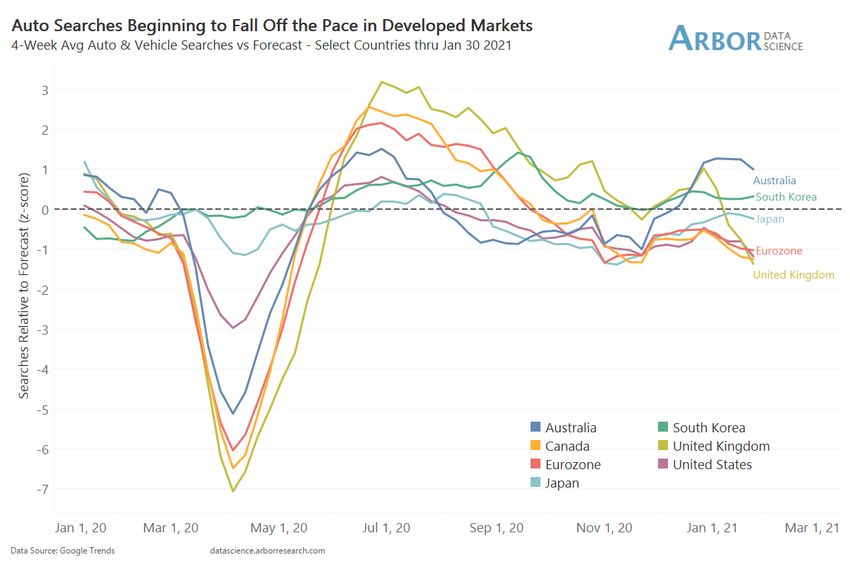
Auto Demand Takes a Step Back

 We track Google search activity for a range
 of auto shopping categories in the world’s
 largest 25 auto markets. Only a month ago,
 auto shopping searches were holding steady
 or improving in most major developed
 markets. Search activity has failed to keep
 pace with the usual seasonal pickup in
 activity and fallen further below forecasts in
 the US, Canada, and the largest eurozone
 auto markets.

 We highlighted the particularly bleak
 downturn in auto & vehicle searches in
 eurozone economies as part of a broader
 retreat by consumers.

 The next series of charts shows four-week
 moving averages of search activity relative to
 our three-month forecasts.

© 2021 Arbor Research & Trading, LLC. All Rights Reserved   02-08-2021   6
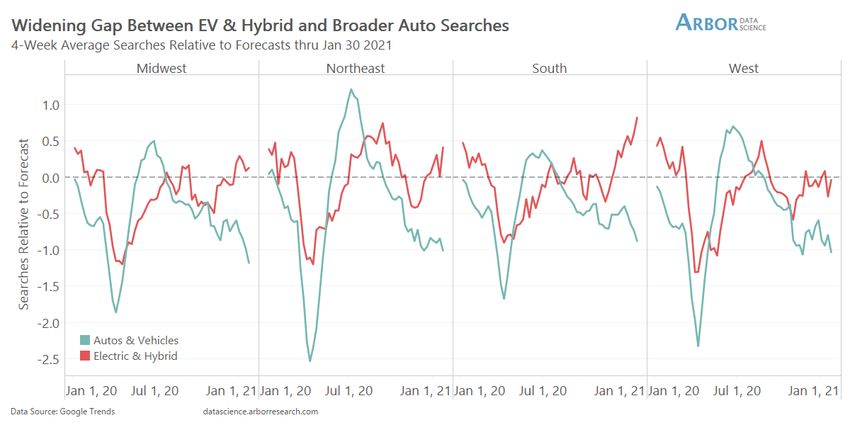
Auto Demand Takes a Step Back

 There is a widening gap between growing
 enthusiasm for hybrid & electric vehicles and
 the deteriorating search activity for autos &
 vehicles more broadly. Looking across US
 states by census region, all four are seeing
 searches tied to hybrid and electric vehicles
 strengthen. Critical markets in the South and
 Northeast are seeing search activity rise
 above forecasts.

 GM made headlines with a long-term target
 for an all-electric fleet by 2035. Consumer
 interests may spur a faster transition still. A
 nimble transition away from ICE and toward
 lower-emission vehicles looks increasingly
 critical to automakers near term future. The
 backdrop of a global boom in renewable
 energy may be another accelerant.

© 2021 Arbor Research & Trading, LLC. All Rights Reserved   02-08-2021   7
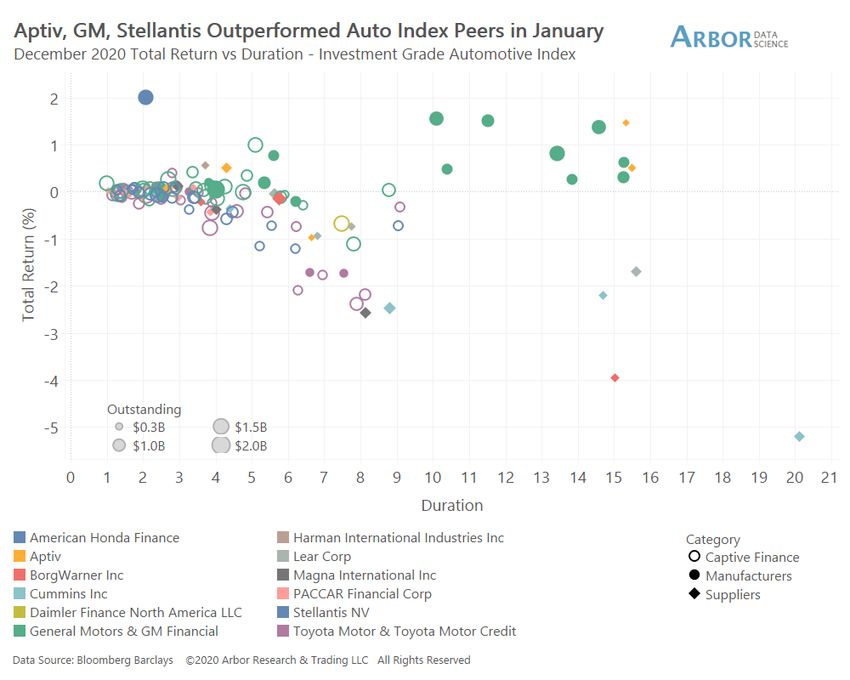
Auto Demand Takes a Step Back

     Past credit updates regularly highlighted
     autos as one of the industries outperforming
     in the investment grade space.

     A blend of short duration resilience and
     strong spread performance for longer-dated
     GM and Aptiv paper helped the index deliver
     a strong first month of 2021.

© 2021 Arbor Research & Trading, LLC. All Rights Reserved   02-08-2021   8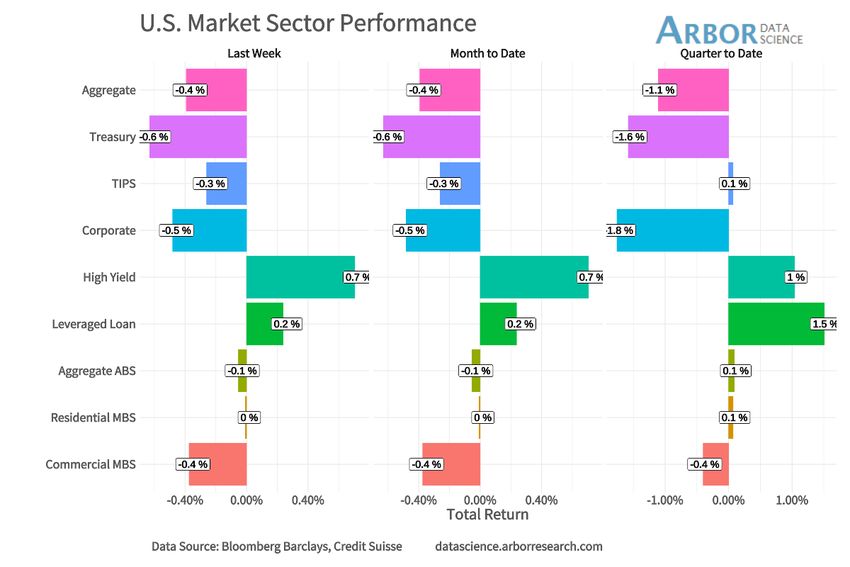
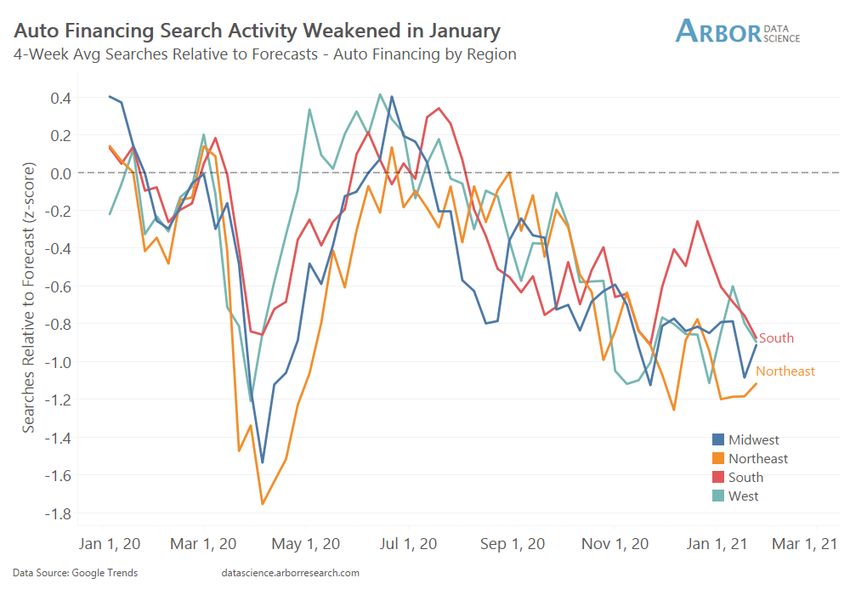
Auto Demand Takes a Step Back

   We ended the January update with an eye on
   auto financing search activity. The optimistic
   case at the time was that rising activity in the
   South would be followed by similar strength
   in other regions. That scenario has not
   unfolded.

   Instead, we’ve seen auto financing searches
   converge further below forecasts. Sharp
   weakness in the Northeast has moderated.
   Demand looks to have taken a step back
   after the hot start to the year.

   For more on auto and parts manufacturing
   on the equity side, see last week’s post.

© 2021 Arbor Research & Trading, LLC. All Rights Reserved   02-08-2021   9
The Rent Narrative May Get Messy

  Investors and potential tenants could be forgiven for
  getting lost in the swirling narratives about rents,
  zoom towns are the latest hot take on the future of
  work from home. The reality on the ground is a
  divergence between a handful of large, highly visible
  cities and most of the rest of the country.

  The latest data from Zillow’s Observed Rent Index
  across the top 100 metros in the US reflect this and
  even show rents accelerating into the end of 2020.

  The chart shows the median along with 25th and
  75th percentiles for the year-over-year change in
  Zillow’s Observed Rent Index (ORI) for each city.

  The median recovered nearly linearly from a March
  2020 low to end the year at +4.2%. The top 25% of
  metros saw their ORI increase by 5.5% or more. Yet
  the bottom 25% of metros have seen year-over-year
  rent growth continue to wane.

© 2021 Arbor Research & Trading, LLC. All Rights Reserved   02-08-2021   10
The Rent Narrative May Get Messy

 The list of highly visible cities with lower ORIs
 compared to December 2019 is short. New York, San
 Francisco, Boston, San Jose, Seattle, Austin, Chicago
 and Washington DC are the only metros with
 materially negative YoY changes.

 More than three-quarters of these metros are still
 seeing positive YoY rent growth. This runs the
 spectrum from larger metros including Atlanta,
 Phoenix, Dallas Fort Worth and even Detroit. It also
 includes so-called zoom towns including Memphis,
 Providence, Tucson and Boise City.

© 2021 Arbor Research & Trading, LLC. All Rights Reserved   02-08-2021   11
The Rent Narrative May Get Messy

Whether that narrative sounds compelling probably
has a lot to do with the stage of life, age of children,
current school circumstances and how the pandemic
has affected local public goods broadly in each
instance. Even if it sounds compelling, there is some
evidence that potential tenants are not yet acting on
the opportunity.

Nationwide, Google search activity for apartments &
residential rentals is falling sharply relative to our
three-month forecasts. The week ending January
30th saw apartment searches fall to their lowest
relative to forecasts since the reopening. Real estate
searches broadly have also deteriorated.

For a deeper dive into the regional search activity
around apartment rentals, as well as the implications
for inflation via OER, see last week’s post.

© 2021 Arbor Research & Trading, LLC. All Rights Reserved   02-08-2021   12
Bank Loans, Munis and TIPS on the March

We continue to watch a divergence in risk-adjusted
return performance across fixed income sectors in
the US. Leveraged loan funds remain in the spotlight
as long end yields head higher and expectations of
rising rates firm up.

Three-month reward/risk ratios for munis, TIPS and
leveraged loans are still on the rise.

Mortgage backed securities ETFs delivered their best
3-month risk adjusted return since July.

Corporate bond ETF performance improved.

The chart shows average three-month reward/risk
ratios for US domiciled fixed-income ETFs by strategy.

© 2021 Arbor Research & Trading, LLC. All Rights Reserved   02-08-2021   13
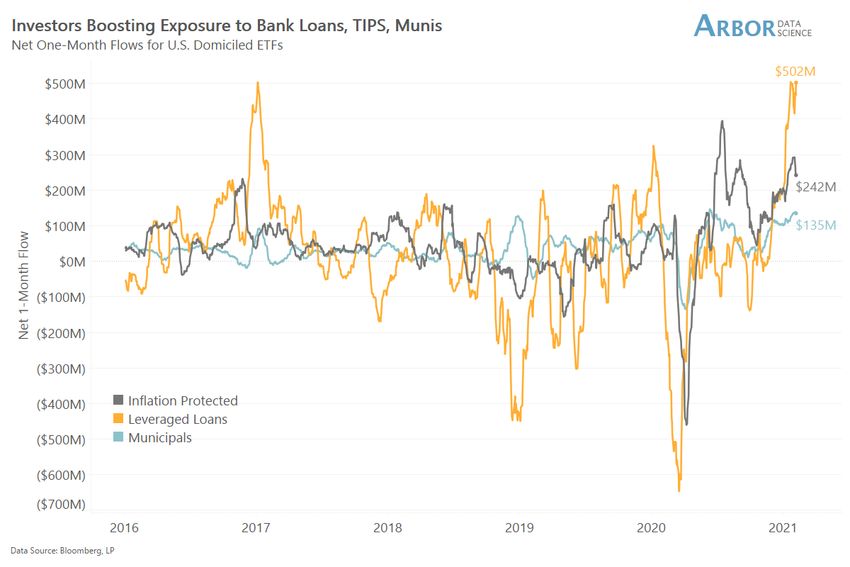
Bank Loans, Munis and TIPS on the March

Net inflows continue to follow performance in the
three best performing categories (Leveraged Loans,
TIPS, Munis).

Rolling monthly net flows for bank loan funds set a
new high above $500 million.

TIPS funds saw net monthly inflows dip to $242
million.

For a comprehensive break down of US fixed
income ETF flows, see our latest update.

© 2021 Arbor Research & Trading, LLC. All Rights Reserved   02-08-2021   14
Sector Total Returns

  Risk On Flows Fueling High Yield, Leveraged Loans

  Safe assets underperformed and the riskier sectors of
  the US fixed income markets extended gains.

  High yield gained 0.7% on the week, extending its Q1
  return to +1%. Leveraged loans inched higher by
  0.2% and continue to lead for Q1 at +1.5%.

  The Treasury index lost 60 bps, extending the Q1 loss
  to -1.6%. TIPS continue to outperform but did slide
  30 bps on the week and are clinging to a positive Q1
  return of +0.1%.

© 2021 Arbor Research & Trading, LLC. All Rights Reserved   02-08-2021   15
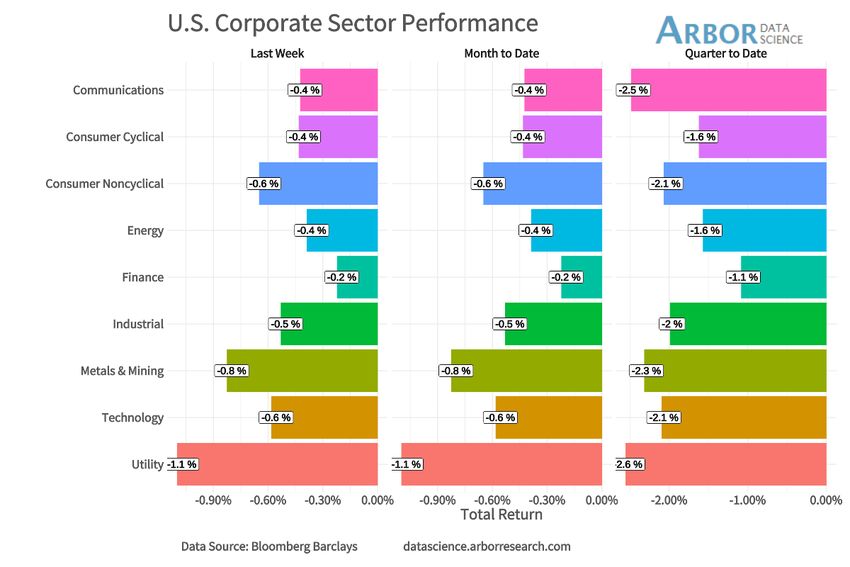
Sector Total Returns

  Investment Grade Retreat Persists

  Rising yields dominated modest spread
  tightening on the week in the investment
  grade space. All sectors lost ground with
  longer-duration utilities faring worst.
  Utilities were -1.1% on the week and now -
  2.6% for Q1.

  Shorter duration financials were spared
  some of the pain from higher yields. The
  financial index lost 0.2% and leads for the
  quarter at -1.1%.

© 2021 Arbor Research & Trading, LLC. All Rights Reserved   02-08-2021   16
Issuance Recap

  Primary market activity remains robust. Last
  week’s dose of new supply was the largest
  so far in 2021, approaching $75 billion.

  Still-low rates, tight spreads and increasing
  confidence about both fiscal stimulus and a
  vaccine-driven recovery all continue to fuel
  investors’ risk appetites.

  We expect issuers to remain active as they
  prepare for the surge of economic activity
  later in the year.

© 2021 Arbor Research & Trading, LLC. All Rights Reserved   02-08-2021   17
Issuance Recap

  A series of large deals dominated new
  issuance in the first week of February. Apple
  ($14 billion), Boeing ($9.8 billion), Alibaba ($5
  billion) and Altria Group ($5.5 billion) all
  combined for almost $35 billion.

  The wave of new supply may have contributed
  to pressure on Treasury yields. Swaption
  volatility is beginning to show more anxiety
  over rising long-end yields. That may prove to
  be a catalyst for more opportunistic issuance
  in the weeks ahead.

© 2021 Arbor Research & Trading, LLC. All Rights Reserved   02-08-2021   18
Contact Us
Give us a call for more information about our services and products

Ben Breitholtz – Data Scientist
ben.breitholtz@arborresearch.com

Pete Forbes – Data Scientist
peter.forbes@arborresearch.com

Arbor Research & Trading, LLC
1000 Hart Road Suite 260
Barrington, IL 60010
847 756 3575

datascience.arborresearch.com

Copyright 2021 Arbor Research & Trading, LLC. This message is intended only for the
personal and confidential use of the designated recipient(s) named above. If you are not the
intended recipient of this message you are hereby notified that any review, dissemination,
distribution or copying of this message is strictly prohibited. This communication is for
information purposes only and should not be regarded as an offer to sell or as a solicitation
of an offer to buy any financial product, an official confirmation of any transaction, or as an
official statement of Broadstone Insights. Email transmission cannot be guaranteed to be
secure or error-free. Therefore, we do not represent that this information is complete or
accurate and it should not be relied upon as such. All information is subject to change
without notice.

                                                                                                  19
You can also read