U.S. Dollar ICE Bank Yield Index Update - July 2019
←
→
Page content transcription
If your browser does not render page correctly, please read the page content below

U.S. Dollar
                                 ICE Bank Yield Index
                                 Update
                                 July 2019

© Copyright 2019 ICE Benchmark Administration Limited   U.S. Dollar ICE Bank Yield Index   1
Contents
Executive Summary                                                                              3

Feedback on U.S. Dollar ICE Bank Yield Index to date                                           5

Constructing the U.S. Dollar ICE Bank Yield Index as a                                         12
Supplement to SOFR

Testing Results to end of June, 2019                                                           20

Appendix 1 - The U.S. Dollar ICE Bank Yield Index as a                                         24
Supplement to SOFR Test results

Appendix 2 - Disclaimers                                                                       25

© Copyright 2019 ICE Benchmark Administration Limited   U.S. Dollar ICE Bank Yield Index   2

Executive Summary
On January 24, 2019, ICE Benchmark Administration (IBA), a leading provider of global interest rate and other
financial benchmarks, introduced a preliminary methodology in a white paper for a new interest rate index, the U.S.
Dollar ICE Bank Yield Index. The fully transaction-based index is designed to measure the average yields at which
investors are willing to invest U.S. dollar funds over one-month, three-month and six-month periods on a wholesale,
senior, unsecured basis in large, internationally active banks. It has been developed to meet the potential
benchmark needs of lenders, borrowers and other users of non-derivative (or “cash”) products that have typically
sought term interest rate benchmarks linked to the average funding rates of a broad group of large banks.

IBA’s preliminary index methodology uses two types of wholly transactional input data representing wholesale,
senior, unsecured bank investment yields: primary market funding transactions and secondary market bond
transactions. These transactions are filtered by reference to specified eligibility criteria, then appropriately adjusted
and weighted, before being used to generate a yield curve from which one-month, three-month and six-month term
settings can be obtained.

Alongside the white paper, IBA published the results of a period of testing the preliminary U.S. Dollar ICE Bank
Yield Index methodology during the course of 2018, and asked market participants and stakeholders for their
feedback and suggestions.

IBA published an update to the white paper on April 10, 2019, to provide greater detail regarding the preliminary
index methodology based on the initial feedback received, and to provide incremental testing results to the end of
March, 2019. IBA also extended the comment period to May 31, 2019.

IBA is now publishing this second update for the following purposes:

1. To provide a summary of the feedback IBA has received on the U.S. Dollar ICE Bank Yield Index during
   the comment period.

    IBA is pleased to have received a significant amount of direct feedback from market participants on the
    preliminary index methodology and from individual and group discussions, alongside analysis and comment
    from market commentators contained in research papers and other publications. The vast majority of this
    feedback and analysis has supported IBA’s efforts to build a credit-sensitive term benchmark in U.S. dollars
    with the potential to be used as a reference rate in lending commitments. Some market commentators have
    expressed the view that these efforts are unnecessary, as they believe the new overnight risk-free rate for U.S.
    dollars, the Secured Overnight Financing Rate (SOFR), could be adopted as a suitable interest rate benchmark
    for U.S. dollar lending commitments.

    The feedback in relation to the proposed construction of the index has generally focused on the following key
    points:

    •    the eligibility criteria for the identification of transactions used in determination of the index;
    •    the curve-fitting methodology which generates the daily yield curve from which the term settings are
         obtained; and
    •    contingencies in case that insufficient transactions are available to generate one-month, three-month and
         six-month settings using the index methodology.

2. To present a potential update to the methodology whereby the U.S. Dollar ICE Bank Yield Index is
   determined by combining a term SOFR yield curve and a bank credit-spread curve based upon
   transactional data.

    Some feedback has supported determining the index as the combination of a credit-spread curve, derived from
    bank funding and secondary market bond transaction data, and an implied term SOFR yield curve. This would
    allow the index’s construction to be anchored in daily implied term risk-free SOFR rates and supplemented by
    a credit-spread curve representing, on average, the prevailing credit-risk premiums associated with the
    wholesale, senior, unsecured debt obligations of large, internationally active banks. By constructing the credit-
    spread curve using transaction data observed over a multiple-day period (e.g. over a rolling five-day window)

© Copyright 2019 ICE Benchmark Administration Limited                          U.S. Dollar ICE Bank Yield Index   3
the quantity and diversity of credit-sensitive inputs utilized in the index’s calculation would be greater,
    potentially providing a more robust basis for the index.

3. To provide updated testing results of the preliminary methodology for the U.S. Dollar ICE Bank Yield
   Index during the period from January 2018 to the end of June 2019.

    The updated test results for the period ending June 2019 are set out in the Testing Results to end of June 2019
    section of this update and are also available on IBA's website. The index continues to exhibit a close
    correlation to widely-used wholesale, senior, unsecured U.S. dollar interest rate benchmarks.

Next Steps
IBA now intends to take account of the feedback received and continue to test and develop the U.S. Dollar ICE
Bank Yield Index and its methodology. This will include:

    •    working with large, internationally active banks to seek commitments to provide funding transaction data to
         enable the index to be constructed reliably on an on-going basis;
    •    conducting further outreach to corporate borrowers to obtain their comments and feedback on the index;
         and
    •    engaging with stakeholders to obtain feedback on the proposal to construct the index as a supplement to
         term SOFR, i.e. as a combination of a transaction-based credit-spread curve and a term SOFR curve that
         is able to generate implied term SOFR rates on a sustainable and representative basis.

IBA will keep market participants informed of its progress through further updates over the course of the coming
quarters.

As an authorized administrator under the EU Benchmarks Regulation (BMR), and provided that the outcome of
testing is satisfactory, IBA will administer the U.S. Dollar ICE Bank Yield Index in compliance with the BMR and
other relevant regulations.

There is no guarantee that IBA will continue to test the U.S. Dollar ICE Bank Yield Index, be able to source data to
derive the index or publish the index in the future. Users of LIBOR should not rely on the potential publication of the
U.S. Dollar ICE Bank Yield Index when developing and executing transition or fallback plans.

© Copyright 2019 ICE Benchmark Administration Limited                          U.S. Dollar ICE Bank Yield Index   4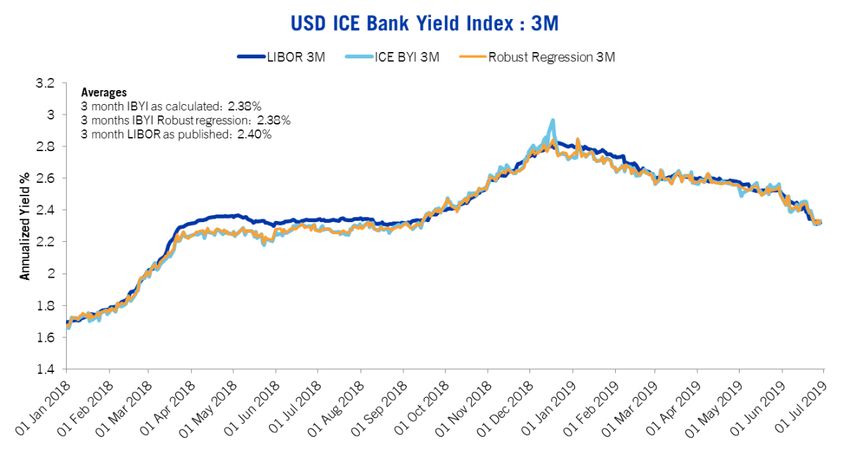
Feedback on U.S. Dollar ICE Bank Yield Index to date
Feedback responses
To date, IBA has received 15 direct feedback responses from banks and industry groups on the U.S. Dollar ICE
Bank Yield Index (the “Index”) and the questions in the white paper and the first update soliciting feedback and
suggestions. Additionally, a number of financial institutions and associations have referred to or commented on the
U.S. Dollar ICE Bank Yield Index in research reports and other publications 1. IBA has also obtained feedback from
market participants via group and individual meetings and discussions.

The vast majority of feedback and analysis has been supportive of the Index and of IBA’s efforts to build a
transaction-based, credit-sensitive term benchmark in U.S. dollars with the potential to meet the needs of lenders,
borrowers and other users of non-derivative (or “cash”) products.

Summary of the general feedback received on the Index
General supportive feedback on the Index has included:
   • recognition that the development of a new forward-looking credit-sensitive interest rate benchmark could
       aid benchmark transition;
   • comment highlighting the need for a multi-rate approach to aid the transition of cash products away from
       U.S. dollar LIBOR;
   • acknowledgement that LIBOR has many attractive attributes as a lending benchmark which any new rate,
       such as the U.S. Dollar Bank Yield Index, should look to include to the extent possible;
   • noting the importance of developing a rate which is easy for end-users to understand;
   • comment that the Index methodology appears to be more transparent than LIBOR which, together with its
       transaction only-based methodology, could enable users to better understand day-on-day moves and
       trends;
   • comment that producing an index without any element of expert judgement in the methodology increases
       its robustness and credibility; and
   • comment that the Index could potentially serve as replacement for U.S. dollar LIBOR in loans and other
       cash products.

General feedback on the Index that has raised questions and concerns has included:
   • the potential for a new benchmark, such as the Index, to distract from and potentially slow the overall
       transition to SOFR;
   • questions as to the potential for the Index to be compliant with the IOSCO Principles for Financial
       Benchmarks2 (the “IOSCO Principles”);
   • comment that, even with the inclusion of bond transaction data from the Financial Industry Regulatory
       Authority’sTM (FINRATM) Trade Reporting and Compliance EngineTM (TRACETM)3, unsecured term bank
       funding activity in the money markets has reduced significantly and has considerably lower volumes than
       the volumes represented by outstanding financial products referencing U.S. dollar LIBOR;
   • questions as to the ability to use the Index for fair-value hedge accounting; and
   • concern over the provision of funding transaction data by banks beyond year-end 2021.

1
  For example, see: Andreas Schrimpf and Vladyslav Sushko, Beyond LIBOR: a primer on the new reference rates, Bank for International
Settlements (BIS) Quarterly Review, March 2019, https://www.bis.org/publ/qtrpdf/r_qt1903e.htm.
2
  The International Organization of Securities Commission’s ‘Principles for Financial Benchmarks: Final Report’,
https://www.iosco.org/library/pubdocs/pdf/IOSCOPD415.pdf.
3
  Financial Industry Regulatory Authority, FINRA, Trade Reporting and Compliance Engine, and TRACE are trademarks of Financial Industry
Regulatory Authority, Inc. (FINRA), in the US and/or other countries. All rights reserved. See http://www.finra.org/industry/trace for further details
regarding TRACE. The U.S. Dollar ICE Bank Yield Index is not associated with, or endorsed or sponsored by, FINRA.
© Copyright 2019 ICE Benchmark Administration Limited                                           U.S. Dollar ICE Bank Yield Index        5
Summary of responses to the specific feedback questions in the white paper and the first update

1. Do you agree that the U.S. Dollar ICE Bank Yield Index will be representative of the average yields at
   which investors are willing to invest U.S. dollar funds on a senior, unsecured basis in large
   internationally active banks operating in the wholesale U.S. dollar markets?
   • The vast majority of responses agreed that the Index would be representative of the average yields at
       which investors are willing to invest U.S. dollar funds on a senior, unsecured basis in large internationally
       active banks operating in the wholesale U.S. dollar markets.
            o Many responses noted the importance of having sufficient input data to produce the Index reliably
                on an ongoing basis, and suggested that IBA should look to increase the amount of input data
                where possible.
            o Some concerns were raised about the potential volatility of the published rate during periods of
                illiquidity, such as that seen over year-end December 2018.
   • Some responses considered that constructing the Index explicitly as a combination of term SOFR and a
       credit-spread would be more transparent, possibly aiding the desired wider market transition to SOFR.
   • One response included concerns that the current preliminary methodology might not represent an average
       bank’s credit risk, because the weighting of the transactional input data used in respect of each bank is not
       constant across days; and recommended instead calculating separate credit spreads for each bank and
       then averaging these.

2. Do you agree that the U.S. Dollar ICE Bank Yield Index should be published for one-month, three-
   month and six-month tenors, or should other tenors be included? Is a shorter tenor required for stub
   calculations, or could a different overnight rate be used for this purpose?
   • There was widespread agreement amongst respondents that one-month, three-month and six-month
       would be the most widely-used tenors.
   • There were also sub-sets of responses requesting that a shorter tenor be published (e.g. one-week) to
       allow for stub calculations, and that there should also be a 12-month tenor.

3. Curve fitting methodology
   a. Do you agree with the curve-fitting methodology described in the U.S. Dollar ICE Bank Yield Index
      white paper (i.e. a least squares best fit of all eligible data points to a third order polynomial), or
      would a different curve-fitting model (such as a spline-based approach) be more appropriate?
           • The majority of responses were supportive of a least squares best fit of all eligible data points to a
               third order polynomial.
           • Support for constructing the Index as a credit-spread curve supplement to term SOFR.
           • A sub-set of responses either did not answer this question or expressed no preference, with one
               noting that the curve should be selected to exhibit the least volatility.
           • One response did not consider curve-fitting to be an appropriate element of the methodology. This
               was because transaction data in the 12-month maturity range (for example) should not contribute
               to the published rate in the one-month term setting.

    b. Should IBA seek to address or exclude outlier transaction yields when constructing the yield curve,
       either through the use of a robust regression model or by imposing a +/- 100bps (or other size)
       sensitivity test relative to the calculated curve?
           • There was strong support for the exclusion of outliers. Responses included a basic
               acknowledgment that an outlier process should be in place, an outright agreement with a +/- 100bp
               threshold or some other spread threshold to be determined by IBA, a requirement for quantitative
               work to assess the appropriate spread, and one preference for a robust regression curve.
           • Some responses queried how IBA would assess eligible transactions (as opposed to outliers) for
               representativeness, and suggested that quantitative work would be required to assess the
               appropriate threshold spread and that any rule-based data screening should be supplemented with
               governance and analytics, including periodic re-evaluation for appropriateness.
           • There were also questions regarding how outliers would be managed in periods of stress.
           • There was a suggestion that any outlier exclusion process might constitute expert judgement.
           • Another response proposed that all transactions should be retained for use in the calculation in
               order to support the credit component of the Index, noting that outlier exclusion algorithms could
               potentially hide signs of market stress.
© Copyright 2019 ICE Benchmark Administration Limited                       U.S. Dollar ICE Bank Yield Index   6
c. Should IBA seek to construct a separate credit curve from the input data points and add this back
       to a notional “risk-free” rate curve to generate a composite curve for the index?
           • One respondent had concerns about using such a methodology in the event that there was no
               eligible transaction data available to build the credit curve, as then the Index would be driven only
               by the risk-free rate curve and would not reflect credit quality (particularly in times of stress).
           • Another respondent considered that this methodology could provide a more robust and
               representative credit component if transactions executed during a longer input data window were
               incorporated so as to anchor the Index in more credit-sensitive information.

4. Do you agree with a target of ten (10) transactions per maturity range, or should this target be
   increased for some/all maturity ranges? When responding to this question please consider the curve-
   fitting methodology, which incorporates all eligible data points across the curve on any given day to
   construct a “best fit” yield curve. Note also that if the requirement for multiple funding transactions
   with multiple counterparties is removed from the methodology, then the total number of eligible
   transactions for each calculation day might be expected to increase.
        • Responses to this question were split between those that considered 10 transactions to be sufficient
            and others that thought this minimum value should be increased.
        • Some respondents highlighted that the most important consideration was to have a fully transaction-
            based methodology that catered for scenarios where the minimum target could not be achieved.
        • Some feedback included concerns that the USD 2 million minimum threshold for secondary market
            bond transactions was too small, and highlighted the need to address potential concentration risk.
        • There was some support for relaxing the requirement to use multiple funding transactions from multiple
            counterparties in order to increase the number of eligible funding transactions.

5. a. Do you agree with using eligible transactions from input windows for up to five (5) previous
   calculation days where the target number of transactions for a particular maturity range is not achieved
   using only the input window for the current calculation day?
   b. Would it be more appropriate to use transactions from a greater/smaller number of previous days’
   input windows for any or all of the maturity ranges where the target is not achieved using the current
   day’s window?
   c. Would it be more appropriate to use transactions from previous days’ input windows irrespective of
   whether the target is reached using the current day’s window?
       • Many responses agreed that a five-day look-back period was reasonable.
       • There were also suggestions to use a longer look-back period, to use consistent look-back periods at
           all times, and to conduct further analysis to determine the appropriate input data window.
       • One respondent suggested eligibility windows similar to those used in EURIBOR’s hybrid
           methodology4 (i.e. 1w +/- 2 d, 1m +/- 1w, 3m +/- 2w, 6m +/- 3w, 12m +/- 3w).
       • One respondent noted that if IBA was to build the Index from separate term SOFR and credit-spread
           curves, then the credit-spread curve construction would potentially benefit from a longer look-back in
           times of stress.
       • There was some feedback suggesting that previous days’ transactions should not be used if sufficient
           same-day transactions were available, as satisfying the perceived need for more transactions could
           widen the input data window unnecessarily and potentially result in the Index being unrepresentative
           (for example, in times of stress).

4
 See Section 7.1.3 of https://www.emmi-benchmarks.eu/assets/files/D0373B-2018%20Second%20Consultation%20Hybrid%20Euribor_full.pdf
© Copyright 2019 ICE Benchmark Administration Limited                                U.S. Dollar ICE Bank Yield Index 7
6. Do you agree that primary market funding transactions should be assigned an initial weighting of 100
   percent and that secondary market bond transactions should be assigned an initial weighting of 50
   percent, because funding transactions tend to be of a larger size than secondary market transactions
   in bank bonds? Would an alternative weighting (e.g. a greater range of weightings of the types of input
   data used in the construction of the Index to better reflect variations in volumes seen in respect of the
   different types of input data) or no weighting be more appropriate?
       • A majority of respondents thought the proposed weightings were appropriate when combined with the
           ability to modify these going forward (but only infrequently, and with consultation) as the market
           evolves.
       • Some respondents considered that secondary market bond transactions were likely to reflect greater
           credit volatility in a stressed market, and could also reflect other time-dependent idiosyncratic factors of
           issuing banks such as individual balance sheet pressures over particular reporting periods.
       • There was a request for further explanation as to how the weightings were determined and a
           suggestion that further testing could be published with and without the weightings being applied.
       • There was a suggestion that weightings should be assigned to individual banks and that the banks'
           weightings should be kept constant over time.
       • One respondent suggested that weightings could be chosen so as to most closely approximate the
           past behavior of U.S. dollar LIBOR.

7. Do you agree that transactions from input windows for previous calculation days should be given a
   lower weighting than transactions from the current day’s input window? Do you have any comments
   on the weightings suggested?
       • There was general support for the weightings for transactions from previous days to be lower than for
          transactions from the current day’s input data window. Other responses noted that the correct
          weighting was hard to quantify and may need consideration and debate, and that the weightings
          should not be adjusted without careful consideration.
       • One respondent suggested that transactions from more than five days before the current calculation
          day should not have a weighting of greater that 50%.
       • One respondent considered that a time-related weighting was not required in light of the market data
          adjustment to previous days’ transactions.
       • There was one preference for assigned weights for each bank to be applied consistently to various
          inputs.

8. Where transactions from input windows for previous calculation days are allocated to a maturity range,
   is an OIS-based adjustment sufficient or should other factors be taken into consideration?
       • Many responses were supportive of a market data-based adjustment being applied to previous days’
           transactions (or the Index itself, if there was need to apply a contingency) to reflect any changes in
           market rate expectations.
       • One respondent thought the use of OIS was reasonable if the OIS market was sufficiently liquid.
       • A sub-set of responses noted that an additional credit-spread adjustment would be desirable because
           OIS would only adjust for (risk-free) interest rate expectations, and that this could be an issue during a
           period of stress.
       • Some respondents raised concerns regarding how to manage adjustments over quarter- or year-ends,
           with one respondent questioning whether adjustments were required to specifically address the turn
           effect.
       • There were also suggestions to consider whether there is a need for any liquidity spread adjustment.
       • Some respondents sought greater clarity on the source and timing of the OIS data that IBA proposed
           to use and the timing of when that would be gathered. Others suggested that the OIS source should be
           compliant with the IOSCO Principles and that the US Treasury Bill rate could also be considered for
           the purposes of market-based adjustments.

© Copyright 2019 ICE Benchmark Administration Limited                        U.S. Dollar ICE Bank Yield Index   8
9. Do you agree that no single bond issuer should be able to represent more than ten (10) percent of the
   number of bond transactions used to construct the U.S. Dollar ICE Bank Yield Index for any given
   calculation day?
       • 10% was thought to be a reasonable maximum threshold weighting by a majority of respondents.
           There was strong consensus that the Index should not be unreasonably skewed due to the credit
           conditions of a single issuer.
       • One respondent queried how the transactions would be adjusted when bonds from one issuer
           represented more than 10% of the number of bond transactions, and suggested aggregating multiple
           transactions from the same issuance to calculate a weighted average.
       • It was proposed to have a similar threshold for primary funding transactions.
       • One respondent suggested that the maximum weighting should be increased in preference to looking
           back further in time to use previous days’ transactions, potentially in a waterfall in order for the
           published rate to be reflective of the prevailing market funding levels.

10. Should IBA include transactions for bank holding companies in any circumstances (e.g. one which has
    consistent pricing levels with the operating company level issuance)? For example, should the
    methodology include the holding company debt of Goldman Sachs Group Inc. and Morgan Stanley or
    The Bank of New York Mellon Corporation, given their business profiles and the minimal amount of
    bond issuance at the bank operating company level for each of these institutions? What criteria might
    distinguish the eligibility of bank holding company obligations from operating company obligations
    (e.g. different business/credit profile or different pricing)?
        • Many respondents did not express a view on this question.
        • A number of respondents considered that financial or bank holding companies should be included and
             made various suggestions as to how to treat these (e.g. capping inclusion at some percentage of
             overall issuance volumes, or comparing the credit rating of the holding company to that of the
             operating company at each bank to assess eligibility, together with other relevant criteria to assess the
             inclusion of holding company issuers).
        • Other respondents considered that bank holding companies had fundamentally different business
             models from other banking entities, noting that these and other differentials could affect funding levels,
             balance sheets, risk appetite, sources of income and other factors related to debt pricing.

11. Please provide feedback on any of the eligibility criteria for:
    a. Primary market funding transactions (i.e. transaction type, counterparty type, funding location,
        transaction size, minimum number of transactions, minimum number of counterparties). Should
        the requirement for multiple funding transactions with multiple counterparties be removed from the
        criteria and, if so, should the minimum transaction size for individual transactions be varied?
        • A majority of responses either expressed no opinion or supported using the current primary market
            funding transaction eligibility criteria, with specific support for using the current LIBOR “waterfall”
            methodology criteria.
        • Other respondents recommended relaxing the current requirements, such as transaction size and
            product type, so as to include all transactions that represented the cost of funding at the relevant
            capital level of the identified institutions.
        • There were suggestions both to increase and also decrease the minimum transaction size.
        • The inclusion of data for floating rate transactions was also recommended by one respondent.

    b. Secondary market bond transactions (i.e. bond type (coupon type and call eligibility), coupon
       range, bond issuance size, transaction size, days to maturity of bond). Should floating rate bonds
       be considered for inclusion in the Index? Please also provide feedback on the process for varying
       any eligibility criteria in the future to reflect developments in the market. This would be subject to
       an appropriate consultation process.
       • A number of respondents expressed no opinion on this question.
       • Many responses were supportive of a coupon range requirement, with some recommending analysis to
           determine the correct range. Other respondents suggested including all coupons.

© Copyright 2019 ICE Benchmark Administration Limited                         U.S. Dollar ICE Bank Yield Index   9
•    One respondent recommended the inclusion of corporate deposits and certificate of deposits within the
               secondary market bond data.5
          •    Another respondent suggested that secondary market bond transactions in floating rate notes should
               be included, with the floating rate being appropriately converted to a prevailing fixed rate. It was noted
               that any potential future floating rate note issuances referencing the U.S. Dollar ICE Bank Yield Index
               would not be eligible for inclusion.
          •    There were suggestions both to increase and decrease the minimum transaction size. These included
               both a concern that USD 2 million was too high and excluded too many transactions and a
               recommendation to increase the minimum transaction size to USD 5 million.
          •    One respondent’s preference was for all secondary market bond transactions to be included, except for
               convertible bonds.
          •    Concerns were also noted over the potential for regulatory change to impact the eligibility criteria (e.g.
               if this were to result in an increase in the prevalence of call features).

12. Please provide any comments on IBA’s contingency proposals regarding how the Index would be
    published in the event that insufficient transaction data points are available to produce the yield curve
    and generate the one-month, three-month and six-month settings on a given day.
        • Respondents noted that a contingency policy was important to ensure a rate would be able to be
           published every day.
        • Some respondents had concerns around publications that did not utilize actual transactions and any
           potential resulting volatility
        • One respondent questioned how a contingency policy could be effectively managed in periods of
           stress to ensure any move in the credit risk premium was reflected in the published rate.
        • There was also a recommendation that IBA develop a contingency plan for the event that the number
           of banks providing primary market funding transaction data decreases.

13. Should IBA use evaluated prices and associated yields for bonds that otherwise satisfy the input data
    eligibility criteria for the Index but in respect of which there are no secondary market transactions that
    are eligible for the purposes of constructing the yield curve for a particular calculation day? The
    purpose of incorporating evaluated prices would be to expand the input data set that is used to
    calculate the Index on any given day (note that evaluated prices are widely used in the calculation of
    fixed income benchmarks incorporating corporate bonds given the liquidity characteristics of the
    corporate bond market).
        • A number of respondents considered that IBA could include evaluated prices for bonds as eligible input
              data, and that this could offer a practical market solution in the absence of secondary market
              transactions.
        • Some concerns were raised that these prices would not be based on transactional data and, as a
              result, might not comply with the IOSCO Principles, which would need to be explored further.
        • There was a recommendation for certain minimum eligibility criteria to apply to evaluated price data
              and for this to be sourced via regulated electronic platforms only.

14. Should any other sources of/types of data be considered for inclusion in the Index?
       • There was a suggestion that IBA consider including primary issuance data sourced from DTCC.
       • As noted above, respondents also recommended that IBA seek to include floating rate primary market
           funding and secondary market bond transaction data (appropriately converted into a fixed rate).

15. Do you agree with publishing the U.S. Dollar ICE Bank Yield Index daily in the morning New York time
    on the day following the day in respect of which the yield curve is calculated?
        • Many respondents approved of this proposal, particularly if the Index were to be administered in the
            United States.
        • One response suggested retaining as many similarities as possible with LIBOR’s publication times in
            order to minimize operational issues.
        • One respondent expressed a preference for an 8:00 am New York time publication.

5
  Corporate deposits are included in the U.S. Dollar ICE Bank Yield Index from funding transactions if they meet the overall eligibility criteria and
are of a duration of 35 days and over. Fixed rate certificates of deposit are also part of the eligible transactions included from the LIBOR
“waterfall” methodology.
© Copyright 2019 ICE Benchmark Administration Limited                                               U.S. Dollar ICE Bank Yield Index 10
• Clarity was requested as to timing of calculation and publication.
16. Should the administration and calculation of the U.S. Dollar ICE Bank Yield Index be undertaken in the
United Kingdom, in the United States or in another jurisdiction?
• Most respondents did not express any preference.
• One respondent noted that the EU Benchmarks Regulation and the current uncertainty around Brexit
could impact the preferred jurisdiction.
17. Please provide any other feedback you have on the U.S. Dollar ICE Bank Yield Index or its
methodology.
In response to this question, market participants provided feedback including:
• A suggestion to explore publishing the Index as a rolling average to minimize day-on-day volatility.
• Receptiveness to the creation of an index to aid transition particularly for those with asset and liability
management needs.
• A comment noting the importance of data sufficiency and the management of removing outliers,
including how any threshold would be assessed or adjusted.
• Questions as to the potential to use the Index as part of the U.S. dollar LIBOR calculation or as a
fallback for U.S. dollar LIBOR.
• Questions as to whether an equivalent bank yield index could be developed for other currencies.
• A query as to how IBA intends to manage cancelled and corrected TRACE TM transactions.
• A comment that the methodology was too complex.
• A suggestion that IBA should look to also include primary issuances sourced from DTCC.
• A suggestion that communications to users regarding the Index should highlight the differences from
U.S. dollar LIBOR.
• A request that consideration be given to the calculation of the Index over holidays.
• Encouragement to continue to look to increase inputs and relevant markets to make the Index more
robust.
• A recommendation that IBA develop a contingency plan if the number of banks providing primary
market funding data decreases.
• A proposal that a framework to maintain the stability of the Index should be developed in line with the
IOSCO Principles.
• One respondent noted the importance of users’ developing appropriate fallback clauses where the
Index is used in contracts.
• Another recommended that IBA undertake outreach with borrowers and corporates (not just large
banks) to promote the Index.
18. Please provide any feedback you have on IBA’s proposed timeline and next steps for the launch of the
U.S. Dollar ICE Bank Yield Index.
• Many respondents considered the timeline to be reasonable.
• There was a suggestion to publish the Index as soon as possible to provide a longer data analysis
period, but also that the operational readiness of users should be considered.
• There was a request for continued regular testing updates, in particular so that stakeholders can see
how the Index behaves over seasonal market events.
• There were also requests for the Index to be back-tested for the period of the financial crisis.
• One respondent considered that introducing the Index by Q1 2020 would be very challenging due to its
potential dependence on term market data rates that are compliant with the IOSCO Principles.
© Copyright 2019 ICE Benchmark Administration Limited U.S. Dollar ICE Bank Yield Index 11Constructing the U.S. Dollar ICE Bank Yield Index as a Supplement to
SOFR
The U.S. Dollar ICE Bank Yield Index, as described in the white paper and the first update, is designed to measure
the average yields at which investors are willing to invest U.S. dollar funds over one-month, three-month and six-
month periods on a wholesale, senior, unsecured basis in large, internationally active banks. The rates generated
by the preliminary Index methodology implicitly incorporate a number of distinct elements, including: an underlying
U.S. dollar risk-free rate of return; a term structure for this risk-free rate to generate the various derived settings
(i.e. the difference between the overnight risk-free rate and the expected average of that risk-free rate over a set
time horizon); and an average credit risk premium that investors expect to earn for accepting wholesale, senior,
unsecured bank credit risk over various time horizons.
In the context of the transition to SOFR as the preferred U.S. dollar risk-free rate benchmark, a number of market
participants have suggested that IBA should construct the U.S. Dollar ICE Bank Yield Index from a combination of
a term SOFR curve and a credit spread adjustment curve (i.e. as a credit-spread supplement to term SOFR).
The rationale for this approach is that the methodology would provide market participants with greater transparency
as to the constituent elements of the Index and greater clarity regarding the different attributes of SOFR (an
overnight risk-free rate in U.S. dollars) and the U.S. Dollar ICE Bank Yield Index (a credit risk-sensitive rate over
multiple time horizons in U.S. dollars). Stakeholders have also suggested that building the Index as a credit-spread
supplement to term SOFR would create an obvious connection between the two rates that could help inform and
facilitate a more efficient transition away from U.S dollar LIBOR.
IBA believes there is a strong analytical argument for separating the credit premium element of the U.S. Dollar ICE
Bank Yield Index from underlying term risk-free rates. This approach acknowledges the different underlying
dynamics of the credit and rates markets: credit trends generally evolve over longer time periods while interest rate
expectations can change more rapidly based upon either realized rate changes or changes in expectations
regarding monetary policy. It also allows separate curves to be constructed for each element using different data
and methodologies to match these dynamics. Hence, the credit-spread curve methodology could incorporate
multiple days' worth of credit-sensitive transaction data, which will likely lead to a more representative assessment
of senior, unsecured bank credit risk in the wholesale funding markets over time. It also retains a nexus to U.S.
dollar term risk-free rates, with a curve that could be updated daily based on realized SOFR data and transactional
data relating to expected future SOFR settings.
Constructing the U.S. Dollar ICE Bank Yield Index as a Supplement to SOFR - A Potential Approach
In order to calculate the U.S. Dollar ICE Bank Yield Index as a credit-spread supplement to term SOFR, two key
data inputs are necessary on a daily basis:
• An implied term SOFR yield curve that can generate implied term SOFR rates on a sustainable and
representative basis for terms within the transaction collection range (currently up to one year); and
• Underlying transactional data representative of the yields available to investors in the wholesale market for
senior, unsecured U.S. dollar bank debt obligations.
Once these inputs are available, credit spreads can be calculated by subtracting implied term SOFR rates from the
underlying wholesale, senior, unsecured bank transaction yield data. If this process is repeated over a series of
days (e.g. a rolling five-day period), a robust credit-spread curve can be created that would represent an average
credit premium that investors would expect to earn above term risk-free rates for investing in the wholesale, senior,
unsecured U.S. dollar debt obligations of large, internationally active banks.
This credit-spread curve can then be added back to the current implied term SOFR yield curve in order to produce
settings that are representative of the average yields at which investors are willing to invest U.S. dollar funds on a
senior, unsecured basis in large internationally active banks operating in the wholesale U.S. dollar markets for set
time horizons.
© Copyright 2019 ICE Benchmark Administration Limited U.S. Dollar ICE Bank Yield Index 12Calculating the Implied Term SOFR Yield Curve For the purposes of this analysis, IBA has constructed an implied term SOFR6 yield curve and associated settings based on the methodology outlined in the recent Finance and Economics Discussion Series paper produced by the Board of Governors of the Federal Reserve System entitled “Inferring Term Rates from SOFR Futures Prices”7. In connection with the term SOFR rates it references, the paper includes a statement that, “These rates are presented for informational purposes only and are not appropriate for use as reference rates in financial contracts. The rates and the process by which they were calculated do not comply with the data quality, methodology, governance and other principles for financial benchmarks established by the International Organization of Securities Commissions. These rates may differ materially from any forward-looking term rates or averages of SOFR that may be produced in the future by any administrator, including any such rate that may be endorsed by the Alternative Reference Rates Committee”. For this exercise, IBA has used settlement prices for both one-month and three-month SOFR futures contracts8. An example of the implied term SOFR yield curve produced using this methodology is shown below: Figure 1: Term SOFR calculation effective May 13, 2019 Calculating the Credit-Spread Curve Primary market funding transaction and secondary market bond transaction data points are sourced, filtered and adjusted as per the preliminary Index methodology described in the white paper, with the following changes to the transaction eligibility criteria: 6 SOFR is published by the Federal Reserve Bank of New York (The New York Fed) and is used subject to The New York Fed’s Term of Use (https://www.newyorkfed.org/markets/reference-rates-terms-of-use) for Select Rate Data. The New York Fed has no liability for your use of the data. The U.S. Dollar ICE Bank Yield Index is not associated with, endorsed or sponsored by The New York Fed. 7 Heitfield, Erik, and Yang-Ho Park (2019). “Inferring Term Rates from SOFR Futures Prices," Finance and Economics Discussion Series 2019- 014. Washington: Board of Governors of the Federal Reserve System. 8 ICE Futures Europe One Month SOFR Index Future (https://www.theice.com/products/70005423/ICE-Futures-Europe-One-Month-SOFR- Index-Future) and ICE Futures Europe Three Month SOFR Index Future (https://www.theice.com/products/70005442/ICE-Futures-Europe-Three-Month- SOFR-Index-Future) settlement prices, published daily by ICE Futures Europe. © Copyright 2019 ICE Benchmark Administration Limited U.S. Dollar ICE Bank Yield Index 13
•   The requirement for a funding transaction provider to have executed a minimum of two distinct transactions
    with a minimum of two distinct counterparties in order for any of that provider’s transactions in a tenor bucket to
    be eligible for inclusion in the Index has been removed. The remaining criteria relating to minimum transaction
    size, counterparty type, product type, maturity and funding location continue to apply;
•   Secondary market bond transactions may be included subject to a minimum size threshold of USD 5 million,
    rather than USD 2 million. The remaining criteria relating to issuance size, bond type, coupon range and
    maturity continue to apply, as do the weightings to ensure that no issuer represents more than 10% of the bond
    transactions involved in the construction of the Index; and
•   Transactions that are executed on the current day and any of the four previous days are utilized, with no
    reduced weighting based on the age of the transaction. This will effectively generate a "five-day rolling
    average" credit-spread curve.

Term SOFR rates in respect of each applicable effective day are subtracted from each of the yields associated with
the wholesale, senior, unsecured transaction data points for that day in order to produce implied credit spreads for
each transaction. Example calculations are below:

Figure 2: Calculating credit spreads from transactions vs. Term SOFR, May 15, 2019

The transactions for each day are color-coded to match the implied term SOFR yield curve for the same day.

The red arrow highlights an example calculation of the credit spread for a single transaction executed on the
previous day:
    • Transaction date: May 14, 2019
    • Maturity: September 18, 2019 (125 days to maturity)
    • Transaction yield (adjusted to money market basis): 2.5015%
    • 125 day term SOFR effective May 14, 2019: 2.3889%
    • Transaction Credit Spread = 2.5015% - 2.3889% = 0.1126% (11.26 bps)

The purple arrow highlights an example calculation of the credit spread for a single transaction executed on an
earlier day:
     • Transaction date: May 8, 2019

© Copyright 2019 ICE Benchmark Administration Limited                        U.S. Dollar ICE Bank Yield Index   14
• Maturity: March 5, 2020 (300 days to maturity)
• Transaction yield (adjusted to money market basis): 2.6704%
• 300 day term SOFR effective May 8, 2019: 2.3797%
• Transaction Credit Spread = 2.6704% - 2.3797% = 0.2907% (29.07 bps)
These credit spreads, taken together on a rolling five-day basis, are plotted and a robust regression algorithm is
applied to generate a credit-spread curve. The required one-month, three-month and six-month credit-spread
settings are then determined from this curve, as shown on the next chart: The arrows on the chart indicate the
credit spreads derived from the transactions highlighted in the same color on the previous chart.
Figure 3: Credit spread calculation for May 15, 2019
© Copyright 2019 ICE Benchmark Administration Limited U.S. Dollar ICE Bank Yield Index 15Calculating the Composite U.S. Dollar ICE Bank Yield Index Curve
This credit-spread curve can then be added to the current implied term SOFR yield curve (i.e. for SOFR effective
May 14, 2019) to produce the composite U.S. Dollar ICE Bank Yield Index curve.
Figure 4: U.S. Dollar ICE Bank Yield Index credit spread added to Term SOFR, May 15, 2019
Example Calculation Results
IBA has calculated the implied term SOFR yield and credit-spread curves, using the above-described method, for
the period from April 23, 2019, to June 28, 2019. The transaction counts and volumes used in the calculations are
summarized in the table below:
Figure 5: Transaction counts and volumes
Average Number of Average Individual Average Aggregate
Transaction Type Transactions (per Transaction Transaction Volume
day) Volume (per day)
Primary Market Funding
175.8 USD 102 Million USD 18.0 Billion
Transactions
Secondary Market Bond
45.7 (>USD 5 Million)* (Unknown)*
Transactions
Total Transactions (All Types) 221 (> USD 18.2 Billion)9
9
For bond trades in excess of USD 5m in size, the trade volume is reported in TRACE as ">5MM". Enhanced data containing actual trade
volumes is only published by FINRATM after a 6 month delay. Historical data from 2018 shows that, in the instruments eligible* for the U.S.
Dollar ICE Bank Yield Index, the average size of trades over USD 5m was approximately USD 14m.
© Copyright 2019 ICE Benchmark Administration Limited U.S. Dollar ICE Bank Yield Index 16The following charts illustrate the rates derived over the period from the combined curves obtained by adding the credit-spread curves to the implied term SOFR yield curves. They are shown together with the corresponding U.S. dollar LIBOR settings for the same time period.10 In Appendix 1, tables are provided with more granular detail on the test results by day. Figure 6: U.S. Dollar ICE Bank Yield Index based on credit spread from Term SOFR: 1 Month 10 Note that U.S. dollar LIBOR and the U.S. Dollar ICE Bank Yield Index are produced using different methodologies and different data sources. As a result, care should be taken when comparing U.S. dollar LIBOR and the U.S. Dollar ICE Bank Yield Index for any period, including the period of testing. © Copyright 2019 ICE Benchmark Administration Limited U.S. Dollar ICE Bank Yield Index 17
Figure 7: U.S. Dollar ICE Bank Yield Index based on credit spread from Term SOFR: 3 Month

Figure 8: U.S. Dollar ICE Bank Yield Index based on credit spread from Term SOFR: 6 Month

© Copyright 2019 ICE Benchmark Administration Limited              U.S. Dollar ICE Bank Yield Index   18
Conclusions
Based upon the positive preliminary calculation results, encouraging market feedback and the strong supporting
rationale (including the increased quantity of transactional data underpinning the credit-spread calculation), IBA
now proposes to further explore constructing the U.S. Dollar ICE Bank Yield Index as a credit-spread supplement
to term SOFR.

IBA expects the separation of the credit premium and risk-free rate elements of the curve construction process,
together with the use of a multi-day observation period to establish the credit-spread curve, to better reflect
evolving credit and rate market conditions. In addition, the use of five days’ worth of credit-sensitive transaction
data should increase the quantity and diversity of information that will be used to produce the Index. IBA believes
this approach should help to ensure the Index remains representative of underlying wholesale, senior, unsecured
bank funding market conditions in periods of volatility and in less liquid market conditions.

Feedback Questions
IBA is asking for stakeholder feedback on using this methodology to calculate the U.S. Dollar ICE Bank Yield Index
as a credit-spread supplement to term SOFR, in order to understand whether market participants would prefer IBA
to pursue this methodology rather than the preliminary methodology set out in the white paper.

Please see below the questions on which IBA is requesting feedback from market participants.

Respondents are requested to provide their feedback by email to IBA at IBA@theice.com on or before September
30, 2019.

1. Do you consider the calculation of a credit-spread curve as a supplement to term SOFR to be preferable to the
   U.S. Dollar ICE Bank Yield Index methodology as previously detailed in the white paper?

2. Do you agree with the proposed approach of including credit-spread information for all eligible transactions
   over a five-day period, rather than the approach previously described in the white paper of using up to five
   previous day’s transactions only so far as needed to achieve the target number of transactions for a maturity
   range? Do you agree with using a five-day transaction window, or should a shorter or longer period be used?

3. Should IBA establish a minimum volume and/or transaction count standard that needs to be met to construct
   the credit-spread curve over a five-day (or other appropriate) transaction window? If so, please provide
   feedback as to what the minimum volume and/or transaction count should be (e.g. a minimum volume target of
   $15 billion and/or 150 discrete transactions). If this standard is not met during the relevant transaction window,
   then should IBA use data from a longer time period until such point as the credit-spread curve can be
   constructed with enough data points to meet the standard (i.e. potentially use six, seven, eight, etc. days’ worth
   of data until the minimum standard is met)?

4. Do you agree with the approach of not weighting the credit-spreads for previous days' transactions by
   reference to their age in consideration of the less volatile nature of credit spreads over short periods of time,
   rather than the approach previously described of ascribing more recently-executed trades greater weight in the
   calculation?

5. Do you agree with the proposed methodology for deriving an implied term SOFR yield curve, based on futures
   settlement prices?

6. Do you consider that the calculation methodology should continue to use an input data window ending shortly
   before publication (such as the period between 11:00 am and 11:00 am UK time on consecutive business
   days), or should the input data window be aligned to calendar days (i.e. the period between 12:00 midnight and
   12:00 midnight Eastern Time on consecutive business days, as for SOFR)?

7. Please provide any other feedback you have on this proposed methodology.

© Copyright 2019 ICE Benchmark Administration Limited                        U.S. Dollar ICE Bank Yield Index   19
Testing Results to end of June, 2019
Since the previous update, IBA has continued to calculate the U.S. Dollar ICE Bank Yield Index using the
preliminary Index methodology described in the white paper.

Line charts showing one-month, three-month and six-month settings for the U.S. Dollar ICE Bank Yield Index,
during the period from January 1, 2018, to June 28, 2019, are shown in Figures 9, 10 and 11 below, together with
the corresponding U.S. dollar LIBOR settings for the same period11. The results are also available in CSV format
on IBA’s website.

Figure 9: U.S. Dollar ICE Bank Yield Index: 1 Month

11
  Note that U.S. dollar LIBOR and the U.S. Dollar ICE Bank Yield Index are produced using different methodologies and different data sources.
As a result, care should be taken when comparing U.S. dollar LIBOR and the U.S. Dollar ICE Bank Yield Index for any period, including the
period of testing.
© Copyright 2019 ICE Benchmark Administration Limited                                       U.S. Dollar ICE Bank Yield Index 20
Figure 10: U.S. Dollar ICE Bank Yield Index: 3 Month

Figure 11: U.S. Dollar ICE Bank Yield Index: 6 Month

The average daily quantity of input data transactions during the updated testing period, and volumes represented
by these, are consistent with those seen in respect of the previous testing periods as referred to in the white paper
and first update.

© Copyright 2019 ICE Benchmark Administration Limited                        U.S. Dollar ICE Bank Yield Index   21
Figure 12: U.S. Dollar ICE Bank Yield Index Count of Transactions used per day

IBA has also continued to perform the equivalent calculation using a robust regression algorithm, which is less
affected by outlier data points. The results are shown in the following three charts12.

Figure 13: U.S. Dollar ICE Bank Yield Index: 1 Month

12
  Note that U.S. dollar LIBOR and the U.S. Dollar ICE Bank Yield Index are produced using different methodologies and different data sources.
As a result, care should be taken when comparing U.S. dollar LIBOR and the U.S. Dollar ICE Bank Yield Index for any period, including the
period of testing.
© Copyright 2019 ICE Benchmark Administration Limited                                       U.S. Dollar ICE Bank Yield Index 22
Figure 14: U.S. Dollar ICE Bank Yield Index: 3 Month

Figure 15: U.S. Dollar ICE Bank Yield Index: 6 Month

© Copyright 2019 ICE Benchmark Administration Limited   U.S. Dollar ICE Bank Yield Index   23
Appendix 1 - The U.S. Dollar ICE Bank Yield Index as a Supplement to
Term SOFR Test Results
  Publication
     Date                       1 Month                             3 Months                              6 Months

                                ICE BYI                              ICE BYI                              ICE BYI
                                              Term                               Term                                    Term
                    Term        Credit       SOFR +                  Credit     SOFR +        Term         Credit       SOFR +
                    SOFR        Spread       Spread     Term SOFR    Spread     Spread        SOFR         Spread       Spread
Apr 23, 2019        2.452        0.5 bps       2.457      2.445      13.3 bps     2.577       2.432        21.5 bps      2.646
Apr 24, 2019        2.446        0.8 bps       2.454      2.438      13.5 bps     2.573       2.417        21.7 bps      2.634
Apr 25, 2019        2.447        0.7 bps       2.454      2.434      13.4 bps     2.568       2.403        20.9 bps      2.612
Apr 26, 2019        2.453        0.5 bps       2.458      2.442      13.4 bps     2.576       2.414        20.6 bps      2.619
Apr 29, 2019        2.449        1.1 bps       2.460      2.437      14.0 bps     2.577       2.401        20.8 bps      2.609
Apr 30, 2019        2.455        2.8 bps       2.483      2.438      13.2 bps     2.571       2.403        21.4 bps      2.617
May 01, 2019        2.451        3.2 bps       2.482      2.440      12.5 bps     2.565       2.401        20.8 bps      2.609
May 02, 2019        2.439        2.2 bps       2.462      2.429      12.0 bps     2.549       2.394        20.6 bps      2.599
May 03, 2019        2.448        2.1 bps       2.469      2.444      10.7 bps     2.551       2.423        19.0 bps      2.613
May 07, 2019        2.433        2.2 bps       2.456      2.430      10.2 bps     2.532       2.414        18.0 bps      2.594
May 08, 2019        2.436        1.8 bps       2.455      2.426      10.7 bps     2.533       2.401        17.7 bps      2.578
May 09, 2019        2.436        1.4 bps       2.451      2.425      10.5 bps     2.531       2.403        17.7 bps      2.580
May 10, 2019        2.437        1.7 bps       2.453      2.425      10.6 bps     2.531       2.402        17.0 bps      2.571
May 13, 2019        2.422        1.7 bps       2.439      2.407      11.6 bps     2.523       2.384        18.0 bps      2.564
May 14, 2019        2.415        1.5 bps       2.430      2.394      12.2 bps     2.516       2.356        19.4 bps      2.550
May 15, 2019        2.430        1.4 bps       2.444      2.400      11.6 bps     2.517       2.359        19.6 bps      2.555
May 16, 2019        2.445        1.1 bps       2.455      2.406      11.1 bps     2.517       2.357        19.1 bps      2.548
May 17, 2019        2.449        0.5 bps       2.455      2.414      10.4 bps     2.518       2.369        20.0 bps      2.570
May 20, 2019        2.443        0.3 bps       2.446      2.410      10.1 bps     2.511       2.368        19.8 bps      2.566
May 21, 2019        2.452       -0.8 bps       2.444      2.418       9.6 bps     2.515       2.377        19.5 bps      2.572
May 22, 2019        2.447       -0.5 bps       2.442      2.419       8.3 bps     2.502       2.388        16.8 bps      2.556
May 23, 2019        2.454       -0.9 bps       2.445      2.428       8.4 bps     2.512       2.392        18.0 bps      2.572
May 24, 2019        2.457       -1.7 bps       2.440      2.423       9.4 bps     2.517       2.367        16.5 bps      2.532
May 28, 2019        2.453       -0.4 bps       2.449      2.429       8.3 bps     2.512       2.381        16.9 bps      2.550
May 29, 2019        2.461       -0.4 bps       2.456      2.432       8.7 bps     2.519       2.376        16.0 bps      2.535
May 30, 2019        2.469       -1.8 bps       2.451      2.434       8.1 bps     2.516       2.369        18.2 bps      2.551
May 31, 2019        2.464       -2.1 bps       2.443      2.432       8.1 bps     2.513       2.365        18.6 bps      2.551
Jun 03, 2019        2.456       -1.7 bps       2.439      2.405       8.0 bps     2.484       2.311        16.7 bps      2.478
Jun 04, 2019        2.436       -2.4 bps       2.412      2.372       7.9 bps     2.451       2.236        16.5 bps      2.401
Jun 05, 2019        2.423       -2.6 bps       2.397      2.355       8.2 bps     2.437       2.211        19.1 bps      2.402
Jun 06, 2019        2.427       -1.7 bps       2.409      2.351       9.3 bps     2.444       2.196        20.7 bps      2.403
Jun 07, 2019        2.419       -1.4 bps       2.406      2.351       8.9 bps     2.440       2.201        20.0 bps      2.401
Jun 10, 2019        2.419       -1.0 bps       2.409      2.315       9.7 bps     2.412       2.151        21.3 bps      2.365
Jun 11, 2019        2.419       -0.3 bps       2.416      2.325       9.8 bps     2.423       2.171        20.3 bps      2.374
Jun 12, 2019        2.425       -1.0 bps       2.415      2.331       8.9 bps     2.420       2.187        18.9 bps      2.376
Jun 13, 2019        2.418       -1.2 bps       2.406      2.309       9.7 bps     2.406       2.168        19.1 bps      2.359
Jun 14, 2019        2.407       -1.4 bps       2.393      2.291      10.9 bps     2.399       2.126        20.2 bps      2.329
Jun 17, 2019        2.401       -1.6 bps       2.385      2.292      11.9 bps     2.411       2.131        18.9 bps      2.320
Jun 18, 2019        2.400       -2.0 bps       2.380      2.286      12.1 bps     2.407       2.136        20.2 bps      2.338
Jun 19, 2019        2.390       -1.8 bps       2.372      2.275      12.7 bps     2.402       2.131        22.9 bps      2.360
Jun 20, 2019        2.409       -0.4 bps       2.405      2.265      13.2 bps     2.397       2.083        20.9 bps      2.292
Jun 21, 2019        2.406       -0.7 bps       2.399      2.229      11.3 bps     2.343       2.033        20.6 bps      2.239
Jun 24, 2019        2.408       -0.2 bps       2.406      2.242      10.2 bps     2.344       2.055        20.6 bps      2.261
Jun 25, 2019        2.412        0.1 bps       2.412      2.207       8.8 bps     2.295       2.016        20.4 bps      2.221
Jun 26, 2019        2.410        1.5 bps       2.425      2.213       8.7 bps     2.299       2.024        20.3 bps      2.227
Jun 27, 2019        2.418        1.2 bps       2.430      2.226       8.3 bps     2.309       2.052        17.9 bps      2.230
Jun 28, 2019        2.408        1.5 bps       2.423      2.206       9.7 bps     2.304       2.036        19.2 bps      2.228

© Copyright 2019 ICE Benchmark Administration Limited                           U.S. Dollar ICE Bank Yield Index   24
You can also read