Understanding the tipping point of urban conflict: the case of Santiago, Chile
←
→
Page content transcription
If your browser does not render page correctly, please read the page content below
Understanding the tipping point of urban conflict:
violence, cities and poverty reduction in the developing world

Working Paper # 3
May 2012

Understanding the tipping point
of urban conflict: the case of
Santiago, Chile

Alfredo Rodríguez, Marisol Saborido and Olga
Segovia
Understanding the tipping point of urban conflict
violence, cities and poverty reduction in the developing world

 Alfredo Rodríguez is a city planner and Executive Director of SUR
       Corporación de Estudios Sociales y Educación, Chile.

     Marisol Saborido is an architect and a researcher at SUR
      Corporación de Estudios Sociales y Educación, Chile.

Olga Segovia is an architect and a researcher at SUR Corporación
            de Estudios Sociales y Educación, Chile.

    The Urban Tipping Point project is funded by an award from the
 ESRC/DFID Joint Scheme for Research on International Development
  (Poverty Alleviation). The Principal Investigator is Professor Caroline
 Moser, Director of the Global Urban Research Centre (GURC). The Co-
  Investigator is Dr Dennis Rodgers, Senior Researcher, Brooks World
    Poverty Institute (BWPI), both at the University of Manchester.

                  © Urban Tipping Point (UTP)
                  The University of Manchester
               Humanities Bridgeford Street Building
                           Manchester
                             M13 9PL
                               UK

                     www.urbantippingpoint.org
Table of Contents
Abstract                                                                              1

Presentation                                                                          3


Part I
City Profile                                                                          5
Chapter 1 Santiago, a Neoliberal City                                                 5

   1.      Neoliberal urban policies                                                 7
           1.1
   The struggle for the city: the project of a social state          7

           1.2
   Dismantling the social state                                      8

           1.3
   The bases of the new urban order (1973-1985)                      9

           1.4
   The expansion of the model (1985-2000)                           12

   2.
   Changes in Santiago between 1970 and 2010                                 13

          2.1
   Changes in the urban structure of the city                        13

          2.2
   Changes in the productive structure of the city                   14

          2.3
   Changes in the distribution of income in the city, 1970-2010      15

   3.
   A balance: gains and losses                                               16

Chapter 2 Violence and Insecurity in Santiago                                       18

   1.
   Conceptual framework                                                      18

          1.1
   Types of violence                                                 18

          1.2
   Categories of violence                                            20

          1.3
   Gender-based violence                                             22

          1.4
   Gender violence in public and private spaces: in the street and
          in the home                                                               23

   2.
   Violence in Santiago: differentiated by location, class and
          gender                                                                    23

          2.1 Direct violence                                                       23

          2.2
   Structural violence                                               26

          2.3
   Cultural violence: market violence                                29


Part II
Fieldwork report Participatory Violence Appraisal (PVA)
methodology                                                                         32

Chapter 3 The Sub-City Study: Violence in Three Areas of Santiago:
   El Castillo, Contraloría and La Dehesa                                           32

   1.
   Methodology: Participatory Violence Appraisal — PVA                       32

          1.1
   General background                                                32

          1.2
   Implementation of PVA in three areas of Santiago                  33

   2.
   The conceptual approach: tipping points and violence chains               33

   3.
   Sketch of the areas                                                       34

          3.1
   General background                                                34

          3.2
   Socio-economic characteristics of the three areas                 40

   4.
   Violence-related problems that affect women and men in
          public places and in the home                                             41

          4.1
   El Castillo, Municipality of La Pintana                           41

          4.2
   Contraloría, Municipality of La Florida                           51

          4.3
   La Dehesa, Municipality of Lo Barnechea                           60

   5
     Conclusions from the PVA                                                 68

           5.1 Problems and types of violence                                       68

           5.2
   Institutions                                                     71
Appendices                                                                           73

           Appendix A                                                                    73

           Appendix B                                                                    75

    References                                                                           79


LIST OF CHARTS
Chart 1.1
       Santiago 1970 to 2010: population, area, poverty, work force               6

Chart 1.2
       Changes in Santiago’s urban structure 1970-2010                           14

Chart 1.3
       Changes in the productive structure of the Metropolitan Region 1967,
                  1995, 2005 (percentages of GDP)                                           15

Chart 1.4
       Indicators of gains and losses                                            17

Chart 2.1
       Conceptual framework for flow of violence from inequalities and
                  conflict                                                                  18

Chart 2.2
       Types, categories and expression of violence in Santiago, Chile           21

Chart 2.3
       Perception of vulnerability to crime (percentages)                        25

Chart 2.4
       How much does direct violence affect quality of life? (selected
                  districts)                                                                25

Chart 2.5
       Human Development Index (HDI) (selected districts)                        27

Chart 3.1
       Socio-economic description: The municipalities of La Pintana, La
                  Florida, and Lo Barnechea                                                 35

Chart 3.2
       Socio-economic descriptions of the three areas according to
                  participants’ perceptions                                                 40

Chart 3.3
       Violence-related problems cited, and the frequency with which they
                  were mentioned, El Castillo                                               41

Chart 3.4
       Institutions identified in El Castillo                                    48

Chart 3.5
       Violence-related problems cited, and the frequency with which they
                  were mentioned, Contraloría                                               51

Chart 3.6
       Institutions identified in Contraloría                                    59

Chart 3.7
       Violence-related problems cited, and the frequency with which they
                  were mentioned, La Dehesa                                                 60

Chart   3.8
     Institutions identified in La Dehesa                                      67

Chart   A.1
     Injury rates per 100,000 inhabitants in relation to location              73

Chart   A.2
     Number of rapes per 100,000 inhabitants (2010)                            73

Chart   A.3
     Arrests following drug related crimes, 2010                               73

Chart   A.4
     What activities are avoided by men and women in order to protect
                  themselves from becoming victims of crimes, by sex and residential
                  district                                                                  73

Chart A.5
       SIMCE (Education Quality Measurement System) 2009 results
                  (Selected districts)                                                      74

Chart A.6
       Population distribution according to health care system (Selected
                  districts) (percentages)                                                  74

Chart A.7
       Job participation and unemployment rates according to sex (Selected
                  districts)                                                                74

Chart A.8
       Participation rates in care of household members as main activity,
                  and average of daily hours dedicated to that activity, by sex and
                  quintile                                                                  74

Chart B.1
       Summary of violence-related problems — El Castillo, Contraloría, La
                  Dehesa                                                                    75

Chart B.2a
      Group discussions by area according to gender and age: El Castillo,
                  Contraloría, La Dehesa                                                    77

Chart B.2b
      Breakdown of Group Discussions. El Castillo, Contraloría, La Dehesa       77

Chart B.3
       Workshops to share results of the PVA, Santiago, June 2011                78
LIST OF FIGURES
Figure 1.1 Location of 310 camps in Santiago, 1972 8
Figure 1.2 Eradication of pobladores from campamentos in the Santiago
Metropolitan Area by commune; from origin to destination, 1979-
1985 11
Figure 2.1 Visible and invisible levels of violence 19
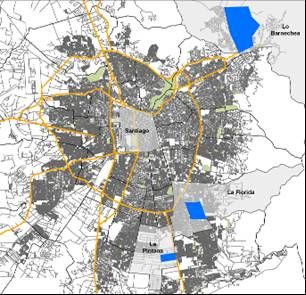
Figure 3.1 Map showing the location of the three areas under study,
Metropolitan Area of Santiago 34
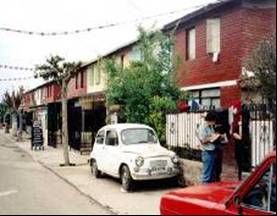
Figure 3.2 Housing in El Castillo 35
Figure 3.3 Timeline of the history of violence in El Castillo in Santiago, Chile 36
Figure 3.4 Timeline of the history of gender violence in El Castillo in Santiago,
Chile 36
Figure 3.5 Timeline of the history of violence in Contraloría in Santiago, Chile 38
Figure 3.6 Map of dangerous places in La Dehesa 39
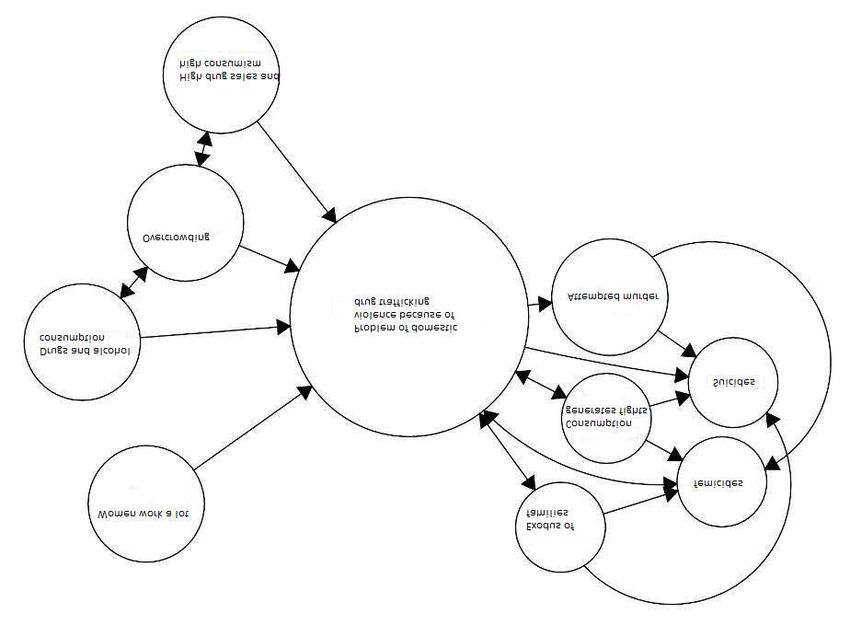
Figure 3.7 Causal flow diagram and violence chains based on women involved in
drug consumption and trafficking, El Castillo 43
Figure 3.8 Listing and ranking of violence-related problems that affect women
and men in public places and in the home in El Castillo 45
Figure 3.9 Flow diagram and chains of violence based on domestic violence
because of drug trafficking 47
Figure 3.10 Institutional mapping. El Castillo 49
Figure 3.11 Flow diagram of causes and consequences, based on verbal
aggression against women in public places, Contraloría 52
Figure 3.12 Flow diagram of causes and consequences and chains of violence
that affect women, based on job uncertainty, Contraloría 53
Figure 3.13 Flow diagram of causes and consequence, illustrates how drug
addiction is simultaneously a case and consequence of intra-family
violence. Contraloría 54
Figure 3.14 Flow diagram of a violence chain caused by drug adiction and
alcoholism, Contraloría 56
Figure 3.15 Flow diagram and violence chain caused by fights between fathers
and sons, Contraloría 57
Figure 3.16 Flow diagram and violence chain based on mothers that are beaten
by their sons, Contraloría 58
Figure 3.17 Cause-flow diagram based on social inequality as a cause of fear of
break-ins, La Dehesa 63
Figure 3.18 Flow diagram and violence chain based on fights among young men
for various reasons, La Dehesa 66
Figure 3.19 Specific types of violence and cross-cutting violence in the three
areas – El Castillo, Contraloría and La Dehesa. 71
LIST OF GRAPHS
Graph 1.1
Santiago, evolution of the Gini coefficient from 1960 to 2010 16
Graph 1.2
Participation rate of women in unpaid domestic work, according to
quintiles, Greater Santiago 29
Abstract
This working paper presents the results of the research project on Understanding the
tipping point of urban conflict: violence, cities and poverty reduction in the developing
world, undertaken in Santiago, Chile. The paper consists of two sections: the city profile
and the sub-city study.

The city profile uses secondary sources and is structured in two chapters. Chapter 1
presents changes in the city’s structure that have developed over the last 40 years,
identifying the tipping points that have marked the process of neoliberal urban
development. Chapter 2 establishes what is understood by ‘violence’ and offers an
analysis of the types and categories of urban violence in Santiago.

The sub-city study, Chapter 3, is presented in the second section of this working paper.
This chapter describes results of the Participatory Violence Appraisal methodology
applied in three urban areas of Santiago. The sub-city study identifies violence-related
problems that affect women and men both in public places and in the home, tipping
points and violence chains at the sub-city level, as well as institutions linked to violence
in the three areas.

The sub-city study highlighted the fact that all three city areas evidence manifestations
of direct violence that are economic, socio-economic and social in nature. Participants
reported the existence of violence against people as well as violence against property.
However, when asked about the causes of these violence-related problems, all of them
ventured explanations revealing the existence of a much deeper and widespread
problem rooted in structural violence and legitimated by cultural violence. This reality is
clearly demonstrated by the three case studies.

Keywords: tipping point, violence chains, urban violence, structural violence, cultural
violence, neoliberal urban development, Participatory Violence Appraisal, public spaces,
private spaces.

                                             1
Presentation
The changes that have occurred in Santiago over the course of the past 40 years are
tied to the consolidation of a neoliberal political model in Chile that has increased
economic and social inequalities. These inequalities are symptoms of an underlying
conflict that is structural in nature (more visible in recent years) between winners and
losers in relation to the distribution of benefits within the system. These winners and
losers inhabit areas that are connected by chains of production and exploitation, which
coordinate aspects of a city that is socially and physically fragmented. In such an
unequal city there are conflicts, violence and a lack of safety differentiated according to
place, class and gender.
Many indicators measuring the quality of life of the city’s inhabitants have shown marked
improvement, for example, in poverty levels. Nonetheless, the defining feature of life for
inhabitants of Santiago is the existence of a structural inequality that persists and also
becomes more severe. The resulting physical, social, economic and political changes are
expressed in an unequal and heterogeneous fashion in urban spaces. These expressions
of violence differ according to which neighbourhood people live in, the daily routes they
travel, where they work, their income level, and whether they are women or men.
There are two important tipping points that can be identified in relation to this
progressive change from a Social Welfare State to a Subsidiary State:
· The first, and more important , was the military coup in 1973 and the
subsequent formation of a neoliberal state model in the country by the mid-70s.
· The second tipping point, which took place around 1990, was the beginning of
the transition to democracy — which ended a sustained period of political
violence. This second tipping point initiated a period lasting 20 years that was
characterised by the implementation of diverse social and democratising
policies. However, the neoliberal ideology instituted in the previous period went
virtually unchanged.
The result of these opposing processes has been the maintenance of conflicts and
inequalities that have created a city that is home to different forms of violence.
The conflicts are manifestations of violence that permeate social relations. They are just
the tip of the iceberg of an indirect structural violence associated with the effects of
economic and social policies that have restricted and, in some cases, obliterated the
basic demands of the population. This is a violence directly connected to the quest for
profit and increasing economic and social inequality.
This violence is also linked to forms of cultural violence, a violence that has legitimised
the concentration of wealth, segregation and discrimination. It is precisely this type of
violence that is subject to widespread public scrutiny today. Inhabitants of the city are
challenging the commodification of education, the destruction of the environment,
gender-based discrimination, etc.
According to the framework developed by Galtung and Moser, which forms the basis of
our analysis, even though it is not necessarily obvious or easily observable, all of these
different types of violence are inter-linked.
Increased inequality in terms of distribution of resources (e.g. incomes), as well as
unequal access to education, health care and social security, are manifestations of a
structural violence inextricably tied to the existence of acute social and spatial
segregation in the city. In turn, this segregation translates into cultural violence —
discrimination, classism and the fear of the ‘other’. According to the data of the past 10
3years, these forms of cultural violence are manifested in high levels of fear regarding
forms of direct violence, i.e. homicides, personal injury, robbery/theft, etc., as well as
extremely low levels of trust in interpersonal relationships.
To avoid becoming victims of direct violence, women (especially those from low-income
areas) refrain from carrying out certain activities and using/circulating in public places at
night. Furthermore, the burden of family obligations coupled with the inordinate amount
of women’s time dedicated to domestic work (practically half the work day in the poorest
areas) impede women’s chances to improve their economic conditions and their
possibilities for personal development. As such, there is a generalised inequality that is
socially legitimised, constituting both structural and cultural violence. In sum, the use of
space and time in the city is characterised by inequality based on class and gender.
The Participatory Violence Appraisal (PVA) methodology carried out in three areas of
Santiago (El Castillo, low-income; Contraloría, middle-income; La Dehesa, high-income)
demonstrates that the violence that occurs in Santiago has different manifestations
depending on class, gender and place. All the problems identified in these areas are
related to the neoliberal model and its consequences — a set of severe economic and
social inequalities that unleash diverse forms of violence and violence chains. This means
exclusion and a lack of opportunities for some (El Castillo); accumulation of wealth and
‘a fear of the have-nots’ for others (La Dehesa); and an intermediate sector that
struggles ceaselessly to improve its lot, dedicating a great amount of time to work and
suffering high levels of stress and family breakdown as a result (Contraloría).
These differences became evident throughout the PVA, as participants identified
violence-related problems associated with direct violence against property and people.
However, when asked about the causes of these violence-related problems, participants
in all three areas ventured explanations that revealed the existence of structural and
cultural violence.
***
This working paper, which presents the results of the research Understanding the tipping
point of urban violence as carried out in Santiago, consists of two main sections: Part I,
City Profile which includes Chapter 1, Santiago as a neoliberal city; and Chapter 2, An
analysis of the types and categories of urban violence in Santiago; and Part II: Sub-City
Study with Chapter 3, a study of violence in three areas of Santiago — El Castillo,
Contraloría and La Dehesa — that presents the results of the Participatory Violence
Appraisal conducted in these neighbourhoods.
The paper was produced by a team of SUR Corporación researchers, coordinated by
Alfredo Rodríguez. Chapter 1 was prepared by Alfredo Rodríguez & Paula Rodríguez;
Chapter 2, by Olga Segovia & Lylian Mires; and Chapter 3, by Marisol Saborido with the
collaboration of Ximena Salas and Loreto Rojas.
This team would like to acknowledge the translators Silvia Arana & William Gills, Allan
Cahoon, Shelley Buckingham, Georgia Marman & Helen Conway; Paulina Matta for
editing the texts; Diego Rodríguez for his graphic design; Angélica Acosta for her field
work; and in a very special way, Caroline Moser for her support and guidance.
4Part I
City Profile
Chapter 1
Santiago, a Neoliberal City1
The 1973 military coup d’état was a tipping point for Chilean history. The civil violence2
(crimes against humanity) perpetrated by the Armed Forces and the right wing had no
precedents in the history of the country or of the city of Santiago. Examples of this are
the bombing of the Presidential Palace, with the suicide of the President of the Republic;
the declaration of a state of war against an internal enemy that was concentrated in
cities which were under military occupation; the mass arrests of political authorities and
social leaders, many of whom were detained and disappeared, or assassinated; the
intervention in municipal administration, and the suppression of social movements and
political parties3.
The discourses and practices of state violence and terror displayed after the coup were
partially, but strongly, criticised both in the country and internationally. However, there
was not a similar criticism of the discourses and practices of control and discipline in the
cities nor of the military government’s preference for the principles promoted by the
University of Chicago School of Economics.
Civil violence gave way to violence against the social body. As Harvey (2007:7-9) notes,
Chile was the first country to implement a neoliberal platform, and this was instigated by
force, during a military dictatorship, which took place long before the Washington
Consensus. In Chile, from 1975, a model was imposed based on policy changes such as:
i) the opening of the economy, which until 1973 had been closed and labelled a mono-
exporter; ii) the liberalisation of prices and markets; iii) the privatisation of public
enterprises; iv) the deregulation and flexibilisation of labour, together with the
expansion of the markets; v) fiscal adjustment, and the ending of industrial policies; and
vi) market deregulation (Martínez & Díaz 1995: 46-66). These drastic transformations,
that converted the social state into a subsidiary state in the context of a military regime,
were expressed in a violent way in the city’s social structure as well as in its inhabited
space.
Martínez and Díaz (1995) note that, between 1973 and 1990, there were two key
instances in the destructive phase of the neoliberal restructuration:
A first foundational period (1973-1983), in which a radical program of free market
policies was applied, under the influence of the University of Chicago School of
Economics, was well known for its anti-Keynesianism. This phase, marked by two large
recessions (1974-1975 and 1982-1983), involved free trade, the elimination of state
control, and the privatisation of public services, among other measures. In 1979, the
military government implemented a wave of privatisations referred to as "social
1
Section prepared by Alfredo Rodríguez and Paula Rodríguez. Translated by Silvia Arana, with the
collaboration of William J. Gills.
2
In this section we use the term ‘civil’ violence to refer to the kinds of violence defined as ‘delitos’
(crimes) by the Civil Code, and ‘social’ violence to name structural or cultural violence (Galtung
2004). See Chapter 2, Section 2.1.
3
According to the data of the Registro de la Vicaría de la Solidaridad, recorded between 1973 and
1988, the State was responsible for 81,051 detentions, 1,008 disappearances, and 2,100 deaths
for political reasons.
5modernisation". In this way the regulation of access to social goods and services
(housing, health, education) was passed from the state to the market, in the context of
the principle of the subsidiary state (Tironi, Vergara & Baño 1988).
A second instance, between 1983 and 1990, began with the economic crisis of 1982-
1983. The intensification and consolidation of the neoliberal model took place during this
period. With that goal in mind, adjustments were made, which were necessary to
advance towards an export economy, with the objective of consolidating the market
system and the subsidiary state — a process based on a huge external debt. In the
context of agreements with the International Monetary Fund (IMF) and the World Bank,
public enterprises, including those managing pension funds and health care, were
subject to a second wave of privatisations.
The 1988 plebiscite and the 1989 presidential elections marked further tipping points for
the country as well as for the city of Santiago. Faced with the alternative either to turn
back the neoliberal process introduced by the dictatorship or to continue it, the political
response was to continue — "with a human face". At that time the roll-back phase
mentioned by Theodore, Peck and Brenner (2009) had ended. Since the late 1980s —
and decidedly during the 1990s — the city has been subject to the neoliberal creation
phase, the roll-out as well as the later phase of "inclusive neo-liberalism" (human face
neo-liberalism) or the subsidiary system (Ruckert 2009). During this period one
observes the dominant presence of a deregulated capitalism, with unequal outcomes, in
different sectors of the national and urban economies, especially in the capital city,
Santiago.
Chart 1.1 shows some general values of the changes that have taken place in the city
over the last 40 years. The population has doubled, the city has expanded, the country’s
economic activity is still concentrated, poverty has been significantly reduced, the
economic base of the city has undergone a radical change, the industrial work force has
decreased, and the number of those working in the service sector has increased.
Chart 1.1 Santiago 1970 to 2010: population, area, poverty, work force
SANTIAGO 1970 1980 1990 2000 2010
City’s population, approximate 3 million 4 million 5 million 5.4 million 6.1 million
Total country population % 38.8%
Total country urban population % 44.8%
Area covered by the city 31,800 ha 64,000 ha 80,000 ha
(hectares)
National GDP % 47.6% 44.9% 44.8% 48.1% 42.5%
(2006)
Poverty % of the total population 38.7% 33.0 15.1% 11.5%
Homicide rate – country – (PAHO) 2.9 5.2 3.3
Homicide rate Santiago (PDI) 4.1
Economic Industry 30.8% 21.8% 15.7%
structure: Transport and 5.1% 6.9% 11.9%
Urban work Communication
force % Services 30.7% 37.5% 43.1%
Source: Prepared by the authors.
In the following section, we review critically neoliberal urban policies and the shifts that
have taken place, and we try to assess both the gains and losses experienced by the
city’s inhabitants as a consequence of this process.
61. Neoliberal urban policies
1.1 The struggle for the city: the project of a social state
In Chile, since the mid-1930s, the project of a social state had been the sum and
substance of the country’s economic development. This meant the expansion of
economic, social and political rights and freedoms.
In this context, the decade from the 1960s up to 1973 — the year of the military coup —
was a period of robust social transformations during which, through different state
policies, two important sectors of society, industrial workers and the inner city poor
(pobladores) (that until that time had been marginalised) were incorporated into social
and political spheres.
Santiago, as the political and administrative seat of the government, where industrial
activity had been concentrated, grew, attracting a large population which, since the
1940s, had been migrating from the country to the city, strengthening a unionised urban
working class associated with political parties. With the rapid and massive growth of the
urban population, public housing policies and programmes were overwhelmed: they
were not able to cover the housing needs of the migrants and poor city inhabitants who,
as a result, built precarious structures, that failed to comply with regulations, in marginal
lands. Thus, the pobladores burst upon the city scene with a claim to their right to the
city: the informal occupation of land, and the construction of organised, but
campamentos (precarious settlements), which were massive by the end of the 1960s.
The city, during this period, was a disputed territory for those who were excluded. They
occupied the city space, its geography, and they presented themselves as social actors
before the state and the private sector. This occupation of the city space revealed old
conflicts, like those created by social exclusion, by limited housing policies, and by what
by H. Lefebvre (1978) at that time called "the right to the city".
The 1972 map of the camp locations in Santiago, which appears below, shows the
magnitude of this phenomenon in the city. The pobladores transformed the visible face
of Santiago, and put pressure on a state ideologically porous to their demands.
7Figure 1.1 Location of 310 camps in Santiago, 1972
Source: Castells (1987): 91.
This process of land occupation intensified in 1973. According to data from the Ministerio
de Vivienda y Urbanismo (Minvu) [Ministry of Housing and Urbanism], when the coup
d’état happened, there were 390 camps in Santiago, with an estimated population of
between 500,000 and 630,000 people. On the other hand, approximately 400 industries
had been expropriated or transferred to their workers (Morales & Rojas 2009).
1.2 Dismantling the social state
According to Hackworth (2007: 8), the neoliberal model, understood as a process, is
based on: i) a negative reaction to social equality and to the Keynesian Welfare State, ii)
the primacy of the individual and the market over community interests; and iii) a state
that apparently does not intervene, but in practice really does.
In Chile, following the dictums of the Chicago School, the social state was criticised as
‘inefficient’. In order to correct such a diagnostic, its direction was changed from social
orientation with redistribution of wealth and social welfare to a state focused on
economic growth and support of the private sector, with its corollary of private gain.
With this change of direction, the state lost many of the attributes that it had possessed
until then, but not its central role in the national economy.
Following the same line of thought, in 1979 the military government promulgated a
National Policy for Urban Development (PNDU) to connect a sectorial urban policy with a
neoliberal market economy (Trivelli 2009). At the core of this policy was the creation of
a rent gap that fixed the value of land in accordance with its most lucrative use. It began
when Arnold Harberger, Director of the School of Economics, University of Chicago, was
hired in 1978 as consultant by the Minvu. Harberger promoted a rational model of
planning that assumed, among other things, that: i) urban land is not a scarce resource;
ii) flexible systems of planning should be applied with minimum state intervention; iii)
restrictions should be eliminated in order to increase the growth of urban areas,
following market trends. He argued that urban constraints distort the land market; that
8horizontal growth should be given priority over vertical growth; and that cities grow in a
natural way, a process that ought to be understood from market signals, and form the
base for Minvu’s action (Harberger 1978).
All of the above was expressed in the PNDU of 1979. Among its written principles were:
i) a flexible system of planning with a minimum of state intervention, based on technical
norms and generic procedures, will be applied; ii) projects that promote the renovation
of deteriorated areas (gentrification) will be supported by legislation; and iii) the state
will promote and support the creation of an open housing market, under the aegis of the
private sector.
1.3 The bases of the new urban order (1973-1985)
The bases of the new urban order were established during the first years of the
dictatorship, and their results can be observed today. These bases promoted a city with
clear territorial limits, with no blurred boundaries; a city — its infrastructure, its services
— transformed into a business opportunity; and a new source of resources for real-
estate investment, i.e., the now privatised pension funds. During this period, the civic
organisations were repressed and dismantled; the municipal territories were subdivided;
the property rights over urban land were regularised, creating the basis for the land
market; and the privatisation of enterprises relating to urban infrastructure was
initiated.
a) Social organisations were taken apart and repressed
During the military dictatorship, the existing social, economic and political organisations
of the city were taken over. Neighbourhood associations, sport clubs, and centres for
mothers were allowed to exist, but their apolitical nature was highlighted. Union
organisation was initially banned, and then later put under constraint by restrictive laws
as well as by a deindustrialisation model that diminished the political weight of the
working class. Thus, any potential reaction or opposition to the new regime was kept
under control. The brutality of the initial repression generated fear among the population
in lower-class neighbourhoods, and for a long time this inhibited any kind of reaction
against the military regime. It is worth remembering that in Santiago a curfew was
applied, with restricted movement at night time, which lasted for 13 years.
b) Reordering the political-administrative functions of the municipalities
One of the first measures of the military regime was the suppression of municipality
operations. The local authorities were suspended and replaced with military personnel.
From a geopolitical perspective, the dictatorship reorganised the municipal territories of
Santiago. The legal instrument for this was Decree No 575, Regionalisation of the
Country (07/13/1974), that created 13 regions nationally, 51 provinces and 335
communes (Hardy 2009: 144); the previous structure of 25 provinces and 96
departments was modified via this decree4.
The old province of Santiago was replaced by the Metropolitan Region of Santiago
(RMS), or the XIII Region. Since 1974, the RMS has been made up of 6 provinces
(Chacabuco, Cordillera, Maipo, Melipilla, Santiago and Talagante), and 52 municipalities.
While the 1974 Decree of Regionalisation was formulated with the objective of
decentralisation, which was based on the military government’s criticism about the
"inadequacy of the relation between state, society, and economy" (Hardy 2009: 144),
4
Today, the country is divided into 15 regions numbered from North to South: Arica y Parinacota
(XV), Tarapacá (I), Antofagasta (II), Atacama (III), Coquimbo (IV), Valparaíso (V), O'Higgins (VI),
Maule (VII), Biobío (VIII), Araucanía (IX), Los Ríos (XIV), Los Lagos (X), Aysén (XI), Magallanes
(XII), and Región Metropolitana (XIII).
9the new administrative structure was made up of decentralised institutions in the
territories, with autonomous budgets, that were — and still are — dependent on the
authorities named by the Executive, i.e. by the central government. Such is the case of
the Intendentes (the higher authority in the regions), and of the governors (the higher
authority in the provinces). As Rodríguez (2009) points out, the criterion for this
operation was social homogeneity; and the strategic objective was to put the city ‘in
order’.
The territories of the 14 municipalities in the Santiago Metropolitan Area were
restructured in 1973 (in some cases they were subdivided; in other cases, areas of some
were incorporated into the areas of others), creating 32 municipalities5. The reason
given for this was that the social work attributed to the municipalities would be better
served in territories that were socially and economically homogeneous, as each of the
newly created municipalities would be. Candidly stated: the established political-
administrative structure matched the socio-economic structure: a few municipalities for
the rich, some others for the middle class, and still others for the poor.
c) The reorganisation of the urban land market
Between 1979 and 1985 the question of the ownership of the 390 campamentos6 that
existed in Santiago was resolved. In contrast to other Latin American countries, where
the processes of land ownership regulation referred to its possession by the current
occupant, in Santiago it involved the return of the land to its former owner. This
criterion, in addition to the premise that the campamentos had been politically
organised, was the foundation for a large geo-political operation: in a period of three to
five years more than 179,000 people were displaced, their former settlements
destroyed, and relocated to new sites, without preserving their neighbourhoods or their
previous organisations. As shown in Figure 1.2, the inhabitants of the campamentos
were not only moved, but also dispersed, i.e., distributed from their provisional homes
to social housing projects on the outskirts of Santiago. In this manner, the basis of the
future real-estate market in the city was established: the more expensive areas were
cleaned — freed of precarious low-income settlements, and the low-income population
was concentrated in the southern and western zones of the city. This dispersion
dislocated the social and urban basis of the political parties that had supported President
Allende’s government.
Thus, the social space shared by the community was eliminated, and the city periphery
was created or enlarged, as indicated by Morales y Rojas ([1987] 2009):
‘The relocation of the urban poor to specific communes in the city meant not only
the elimination of clusters of poverty, settled in campamentos in areas near the
administrative centre and the high and middle class residential communes, but also
the rupture of the social consensus that, from this particular angle, implied to a
certain degree, the sharing of the communal space, or the acceptance in fact of a
cohabitation between different social sectors.’ (p. 138)
5
The creation of the new municipal territories took place before 1982. However, several of these
new municipalities were established only after the municipal elections of 1992, which confirms the
structural continuity of the reforms initiated during the dictatorship, and which were consolidated
during the democratic transition.
6
At the time, the “campamentos” were poor urban settlements born from informal occupations of
land carried out by organised groups of families. Initially, those groups were related to political
organisations.
10Figure 1.2 Eradication of pobladores from campamentos in the Santiago
Metropolitan Area by commune; from origin to destination, 1979-
1985
Source: Morales y Rojas (2009): 139.
d) Privatisation of public urban services
Education. Under the guise of decentralisation, the public education system was
dismantled and its operation was transferred to the municipalities and the private sector.
A system based on the notion that education was a right guaranteed by the state
through a free public education system from pre-school through to college, was shifted
to the current system, which puts the responsibility for the education of sons and
daughters in the hands of their families. Families, depending on their resources, could
“opt” — “have the freedom”, in the language of the time — to send their children to
municipal, subsidised-private or private educational institutions, with large differences in
quality between them.
Health. A similar approach to the public health system, which was privatised, created a
dual system with public and private funding. Public health insurance for low-income
workers and indigents was offered through the National Health Fund (Fonasa). Private
insurance for mid- and high-income sectors was offered through Isapres (health care
institutions). At the same time, primary health care was transferred to the
municipalities, which had to cover part of the costs.
Garbage collection, drinking water, electricity, gas. During this period, services such as
garbage collection were privatised. Until then they had been dependent on the
municipalities or the Ministry of Public Works. Thus the basis for the later privatisation of
other urban infrastructure services was established. The former state enterprises for
electricity, drinking water and gas were transformed first into autonomous public
11enterprises, and then, at the end of the 1980s, into private companies7. As to water
resources, it is worth pointing out that they were ceded free of charge and in perpetuity
to the private sector, through the Water Code of 1981 (Larraín 2006).
e) Privatisation of pension funds
Until 1980, the social security system in Chile was public and pensions for retirees were
based on the contributions of the economically active population and those from the
State. At that time, the current system of individual capitalisation of pensions was
established and made mandatory for all salaried workers. This system is managed by
private financial enterprises called Pension Fund Management Companies (AFP) that at
the beginning totalled 12 organisations. Today, due to mergers and concentrations,
there are only six AFP that manage more than 150 billion dollars in financial instruments.
The investment funds linked to the AFP have, since the mid-1990s, enabled the creation
of a strong real-estate sector, as well as a financial sector to support housing policies.
1.4 The expansion of the model (1985-2000)
The above-mentioned territorial arrangements and economic transformations —
eradication of campamentos, a new municipal structure, privatisation of public services
and infrastructure, the creation of investment funds — allow us to explain the current
city order, its socio-economic and symbolic fractures, and the new forms of violence. The
return to governments elected by democratic vote, beginning in 2000, did not reverse
the direction formed by these arrangements: just the opposite; in some cases the new
structures have been reinforced. Examples of this will be detailed below.
a) The municipalities: The fragmentation of social policies
The subdivision of municipal territories in the Metropolitan Region established during the
dictatorship was maintained; and with the approaching municipal elections of 1992, the
entire political administrative design proposed by the regime was established: today’s 35
communes of Santiago8. The transfer of health and education services was preserved
without noticeable change, despite their budget deficits. The role assigned to the
municipalities as simply administrative entities of the communes — instead of local
government — was not questioned; and above all their role as unique instruments in the
application of public social policies (subsidies, bonds, etc.) was kept, and this has limited
the universal nature of these policies reinforcing the image of the mayor as local political
boss.
b) Housing policy: housing finance policy
The greatest success of the dictatorship’s policies and that of the subsequent
governments has been the housing subsidy system ("sistema de subsidio habitacional")9.
7
Graciela Moguillansky (1997), referring to the privatisation of the electric companies writes, "The
CEPAL study (1994a) based on diverse data, shows that 'the authorities linked to the decision and
the operations concerning the privatisations (including army officers and executives of the public
enterprises) were legally able to take advantages of stock offerings at preferential prices and
conditions, and use their access to special information about the enterprises to make the decision
to acquire additional stock using commercial credit'."
8
One must remember that Santiago, in political-administrative terms, is not a city, but a set of 32
autonomous communes in the province of Santiago, plus the communes of San Bernardo (Maipo
province), Puente Alto (Cordillera province), and Colina (Chacabuco province). The Regional
Intendente is the political authority of the Metropolitan Region, but not of the communes. In this
sense, the application of social policies through the figure of the mayor maintains and consolidates
the fragmentation of the city.
9
The housing subsidy is a financing system for the purchase of homes, which is granted to each
family individually, and consists of three elements: family savings, a monetary subsidy, and a
bank loan. This system has been in operation since 1978. Thanks to this system more than
12However, time has shown that the system has been successful as a way to finance the
construction of small, low quality, and poorly-located homes. It was not a housing policy.
It was a good deal for the construction companies, and eventually, a bad deal for the
"beneficiaries". A number of recent studies have demonstrated that a large part of the
486 housing groups built during those years in Santiago are now practically ghettos
(Poduje 2010; Rodríguez & Sugranyes 2005; Ducci 2000). Thus, large areas of degraded
housing were created in the northern and western peripheries of the city, repeating the
same spatial pattern that had been initiated by the eradications of campamentos.
c) Privatisation of public works, express toll highway: real-estate boom
In the 1990s the privatisation of businesses relating to urban infrastructure, a process
initiated during the dictatorship, became widespread. Thus, all the enterprises that
generated and distributed electricity, the companies that produced drinking water, and
the sewage treatment companies, were transferred to the private sector.
Additionally, a concession system was designed for the construction of an urban freeway
network in Santiago — connecting the city with national highways (also supported by
construction concessions).
During those years, real-estate activity was established as the main engine of the city’s
growth and expansion. Until then, building contractors and developers walked different
paths, and were even competitors. But the freeway concessions together with financial
capital (the private pension funds) launched a new mode of city development: freeways
plus urbanisation plus big projects. Thus, the compact city of the past was permanently
broken, and today’s fragmented city was born.
2. Changes in Santiago between 1970 and 2010
2.1 Changes in the urban structure of the city
The urban structure of the city has changed. If in 1970 Santiago was a compact city, by
2010 it had become a scattered city that spreads out through a network of freeways
managed by concessionaires. The downtown area has lost its importance, and a large
part of commercial activity and many central services have moved to new sub-centres
and shopping centres, first towards the high-income areas, and later to the rest of the
city, following the new road networks and the subway lines.
500,000 social housing units have been built in the country, with more than 230,000 units in
Santiago alone between 1980 and 2002.
13Chart 1.2 Changes in Santiago’s urban structure 1970-2010
SANTIAGO 1970 / COMPACT CITY SANTIAGO 2010 / SCATTERED CITY
A weakened centre, new sub-centres (shopping centres,
Centre(s) A single centre, planned sub-centres malls, business city)
Network of urban freeways supported by concessions
Centrifugal network generating the expansion of the real-
Centripetal radial network estate market
Road network Beginning of Metro (subway) construction Metro network, 5 lines
Campamentos eradicated, and scattered in the outskirts
of the city.
Land occupations: campamentos Clusters of deteriorated social housing: ghettos, hidden
Social housing Campamentos located in the city, seen as a threat in the city, forgotten
Empresa de Transportes Colectivos del Estado:
Public transport subsidised public transport system Transantiago: private system with public subsidy
Market oriented
Urban structure Planned compact city Scattered, fragmented, segregated city
Education, health
services State, public, free Privatised, run by municipalities
Source: Prepared by the authors.
In this process of changes in the city structure, two features stand out:
First, the deregulation of urban guidelines and reduction to a minimum of urban
planning. Beginning in the 90s, and with greater intensity since 2000, in order to favour
construction activity, a large portion of the guidelines for construction and urbanisation
became more flexible, with the initiative left to the real-estate agencies. Thus, a great
push to expand the city was created, responding to the additional profits that the
companies would reap by converting agricultural lands into urban lands. As a result,
during the 90s the city expanded towards the north, through the Chacabuco Plan10, and
in the 2000s towards the west and south.
Second, the construction of urban concession highways began in the mid-90s. The
design of the toll freeways has partially followed the city’s transit and transport
guidelines, but mostly obeyed the proposals of the concessionaires. As pointed out by
Poduje & Yáñez (2009), the outline of the freeways in the city’s periphery was linked to
the residential mega-projects. The new network of freeways in concession has been the
basis for the expansion of new housing development and real-estate investment in the
city’s periphery.
2.2 Changes in the productive structure of the city
The city’s productive structure has also significantly changed. At the end of the 1960s,
Santiago was a city with an industrial base, and a labour force with a strong worker
presence. The unionised workers and working class parties were important political
actors in the city’s public life. This situation has changed. Chart 1.3 shows the loss of the
relative importance of the industrial sector in the city. Today Santiago is a city of
services.
10
The Chacabuco Plan incorporated into the urban area of Santiago a semi-rural zone of “second
home” plots (5,000 square meters) shifting from a density of 10 to 150 people per hectare. See
Poduje and Yáñez (2009).
14Chart 1.3 Changes in the productive structure of the Metropolitan Region
1967, 1995, 2005 (percentages of GDP)
SECTORS 1967 1994 2005
Agriculture, hunting and fishing 6.5 6.9 4.2 4.5 1.2 2.2
Mining 0.4 0.3 1.0
Industry 30.8 36.9 21.8 29.5 17.9 27.0
Construction 5.2 6.9 7.3
Electricity, gas, and water 0.9 0.8 1.8
Commerce 20.4 56.2 21.6 66.0 15.7 70.8
Transport and communications 5.1 6.9 11.9
Services 30.7 37.5 43.1
Total percentage 100.0 100.0 100.0 100.0 100.0 100.0
Source: 1967 and 1994: De Mattos (1999: 3); 2005: Banco Central:
http://www.bcentral.cl/publicaciones/estadisticas/actividad-economica-gasto/aeg07.htm
(Consulted April 4 2011).
This change in the productive structure of the Santiago Region has had important
political and social repercussions. The former industrial working class organised in unions
has lost importance. The quality of employment is different: most of the new jobs in the
service sector are deregulated, without control or contracts. This situation has led to a
reduction in the rate of unionisation, and to a fragmentation of the labour force, all of
this reinforced by legislation that does not allow employees to engage in collective
bargaining.
2.3 Changes in the distribution of income in the city, 1970-2010
The 60s and early 70s represented a period not only of democratisation, but also of
greater social and economic equality. The military coup ended that trend, and from then
on the concentration of income increased.
Graph 1.1, showing the evolution of the Gini coefficient for income distribution in
Santiago, summarises the political-social history of the city. During the 60s, the
distribution of income became increasingly more equitable. The coup d’état, and the
beginning of the military regime, evince the tipping point at which the trend towards
equality was annulled. From then on, a higher concentration of income — with highs and
lows — would become stabilised.
15Graph 1.1 Santiago, evolution of the Gini coefficient from 1960 to 2010
Sources: Contreras (1999) and Secretaría Regional Ministerial de Planificación y Coordinación
Región Metropolitana de Santiago (2009). Prepared by Paula Rodríguez.
It is important to bear in mind that income inequality is a structural feature of Santiago.
If the average values in relation to the city's economic activity, employment and poverty
were reviewed, the understandable conclusion that things are going well would be
erroneous. For example, the annual growth rate of Santiago nears 5.8 percent (2007),
which is above the national rate (4.6 percent). In addition to this, macro-indices of
poverty have decreased since the 1980s for the Metropolitan Region of Santiago (RMS):
from 38.7 percent in 1987 to 11.5 percent in 2009. In 2003, 10.2 percent of the total
RMS population was located below the poverty line; this figure decreased to 8.2 percent
in 2006; and increased slightly to 8.8 percent in 2009. But, in fact, the Gini coefficient
for income distribution in Santiago shown in the graph above — among other facts —
reveals something different.
3. A balance: gains and losses
Today, 40 years after the military coup, for some people things are going well in
Santiago, but not for others. It is true that there have been significant positive changes
over recent decades; however, such progress has not happened in equal measure for
everyone. And for some, the changes have not been positive at all.
From the point of view of what interests this study, that of violence, Santiago — as we
mentioned before — is a civilly safe city.11 We are referring to the fact that, even though
it is almost impossible to know the actual indices of transgressions committed in the city
(a common situation in many cities of the region), the figures for acts considered crimes
are considerably lower than those for other Latin American cities. In spite of this reality,
Santiago is a socially insecure city, because many people living in the city have seen
their social status diminished in recent decades — with all the losses that this implies —
as a consequence of the dismantling of the social state (Castel 2004).
11
The homicide rate in Santiago is 4.1 per 100,000 inhabitants (Policía de Investigaciones de
Chile, 2011).
16Chart 1.4 Indicators of gains and losses
GAINS LOSSES
Reduction of poverty Concentration of income, greater inequality
Physical improvements in the city: better equipped The city is for those that deserve (can afford) it.
infrastructure: drinking water, sewerage system, electricity Cost of tariffs for public services
Reduction of housing deficit New housing projects converted into ghettos
Greater education coverage: less illiteracy, more years of Education differentiated according to income
compulsory education Poor quality of municipal education
Greater health coverage: extension of services Differences between private health care (Isapres) and public health
care (Fonasa)
Greater life expectancy Differences between pension fund systems
Increase in rate of salaried employment Labour flexibility as a precarious form of work
Small-scale drug trafficking in vulnerable neighbourhoods
Source: Prepared by the authors.
The political and social changes have been reflected in the city’s inhabited space.
Santiago is a socially and spatially segregated city. Since the late 70s of the last century,
the city has been progressively segregated through the implementation of different
policies. To the first form of segregation (high-income municipalities vs. low-income
municipalities) has been added another kind of segregation: in recent years, municipal
zones have been created where both low-income housing and high-income housing can
be found, but this latter as enclosed, gated neighbourhoods.
17Chapter 2
Violence and Insecurity in Santiago12
Based on a description of the process of political, economic and social transformations
that have taken place in the city of Santiago de Chile over the last 40 years provided in
chapter one, the contents of this chapter consider: i) a conceptual framework that
defines and identifies different kinds of urban violence in Santiago, incorporating the
concepts of tipping points and chains of violence; and ii) analysis of secondary
information about violence at a city level, disaggregated at a district level and
corresponding to the socio-economic sectors selected for fieldwork.
1. Conceptual framework
Chart 2.1 Conceptual framework for flow of violence from inequalities and
conflict
Current violence and insecurity in Santiago is related to a neoliberal political, social
and economic structure that has exacerbated inequalities.
Structural conflict: Social, economic … which is
inequality between and political- expressed in
winners and losers institutional direct, structural
(gains and losses). violence... and cultural
violence.
Santiago is presently a fragmented social and physical space in which
violence and insecurity, differentiated by location, class and gender,
are made manifest.
1.1 Types of violence
According to Moser (2004), most definitions of violence say it is “the use of physical
force that causes damage to others” in order to impose the will of the person inflicting it.
However, she indicates that there are “more extensive definitions that go beyond
physical violence and consider actions that cause psychological damage, material
deprivation and symbolic disadvantages to be violence”. This takes us to Galtung (2004),
who indicates that the phenomenon of violence can be compared to an iceberg, in that
the visible part is much smaller than the unseen portion. He proposes the existence of
three forms of violence — direct, cultural, and structural — and suggests the concept of
a ‘triangle of violence’ to represent the relations existing between them:
12
Section prepared by Olga Segovia and Lylian Mires. Translated by Alan Cahoon and Silvia Arana.
18Figure 2.1 Visible and invisible levels of violence
Direct violence, which is visible, is embodied in behaviour and occurs when one or more
persons inflict physical or psychological acts of violence on other people. It can be
physical, verbal and/or psychological, is inflicted by an aggressor or intentional agent (a
person) and is suffered by a living being that is physically hurt or injured. This refers to
an abuse of authority, an action that generally takes place in asymmetrical relationships.
According to Galtung, this is the manifestation of something, not the origin.
In a circumscribed sense, the notion of direct violence refers to that which harms people
or their goods (property), called civil violence by Robert Castel (2004). This corresponds
to types of violence against people and goods that society recognises as offences; an
example of this would be those offences considered in Chile as having great social
repercussions.13
Structural violence, which is invisible, is not enacted by individuals but is hidden to a
greater or lesser extent in structures that do not facilitate or hamper the satisfaction of
needs, and specifically becomes manifest in the negation of these needs. This is a type
of indirect violence associated to economic or social policies that restrict or prevent the
satisfaction of one or any of the aforementioned basic human needs and the causes
behind this violence are consequently not patently visible. This violence refers to an
existing conflict between social groups (normally described in terms of gender, ethnicity,
class, nationality, age or others), in which the sharing or access to resources is
systematically settled in favour of one of the parties and at the expense of all others.
The importance of the term ‘structural violence’ is that it recognises the existence of
conflict in the use of material and social resources. Actions or situations which can be
classified as structural violence are not necessarily directly designed or executed in order
to deny the satisfaction of basic needs, but are rather indirect derivations of an
inequitable economic policy and the unfair distribution of wealth. From this perspective
and always in accordance with Galtung (2004), the main forms of structural violence,
based on politics and economics, are repression and exploitation.
From another perspective, manifestations of structural violence can be grouped into two
categories (Galtung 2004), metaphorically known as vertical structural violence and
horizontal structural violence. The first one is “political repression, economic exploitation
or cultural alienation, which respectively violate the need for freedom, welfare and
identity”. The second one “separates people who want to live together, or brings
together people who want to live separately. It violates the need for identity”.
13
From the eight categories of “offenses of great social repercussion” established in Chile, two
(pickpocketing and theft) refer to crime against property, while the other six (aggravated robbery,
theft with forcible entry, aggravated assault, murder, rape and intra-family violence) refer to
crimes against the person.
19You can also read