Using a variant of the optomotor response as a visual defect detection assay in zebrafish
←
→
Page content transcription
If your browser does not render page correctly, please read the page content below
Journal of Biological Methods | 2021 | Vol. 8(1) | e144
DOI: 10.14440/jbm.2021.341                                                                                                                             Protocol

Using a variant of the optomotor response as a visual
defect detection assay in zebrafish
Matthew K. LeFauve1,2, Cassie J. Rowe2,3, Mikayla Crowley-Perry2,4, Jenna L. Wiegand2, Arthur G. Shapiro3,5,6,
Victoria P. Connaughton2,3*
1
  Department of Biological Sciences, George Washington University, 800 22 nd St NW, Washington, DC 20052, USA
2
  Department of Biology, American University, 4400 Massachusetts Ave NW, Washington, DC 20016, USA
3
  Center for Behavioral Neuroscience, American University, 4400 Massachusetts Ave NW, Washington, DC 20016, USA
4
  Department of Chemistry, American University, 4400 Massachusetts Ave NW, Washington, DC 20016, USA
5
  Department of Psychology, American University, 4400 Massachusetts Ave NW, Washington, DC 20016, USA
6
  Department of Computer Science, American University, 4400 Massachusetts Ave NW, Washington, DC 20016, USA

*Corresponding author: Victoria P. Connaughton, Email: vconn@american.edu

Competing interests: The authors have declared that no competing interests exist.

Abbreviations used: CPD, cycles per degree; OMR, optomotor response; OKR: optokinetic response

Glossary of terms and definitions used: angular cycle, the sinusoidal gradient (the high and low contrast bars together) that are presented to the zebrafish in the stimulus (see
Figure 1 for a graphical representation); spatial frequency, the number of angular cycles presented to the zebrafish that stimulates an optomotor response

Received July 13, 2020; Revision received December 10, 2020; Accepted December 10, 2020; Published February 1, 2021

            ABS T RACT

            We describe a visual stimulus that can be used with both larval and adult zebrafish (Danio rerio). This protocol is a mod-
            ification of a standard visual behavior analysis, the optomotor response (OMR). The OMR is often used to determine the
            spatial response or to detect directional visuomotor deficiencies. An OMR can be generated using a high contrast grated
            pattern, typically vertical bars. The spatial sensitivity is measured by detection and response to a change in grating bar
            width and is reported in cycles per degree (CPD). This test has been used extensively with zebrafish larvae and adults
            to identify visual- and/or motor-based mutations. Historically, when tested in adults, the grated pattern was presented
            from a vertical perspective, using a rotating cylinder around a holding tank, allowing the grating to be seen solely from
            the sides and front of the organism. In contrast, OMRs in zebrafish larvae are elicited using a stimulus projected below
            the fish. This difference in methodology means that two different experimental set-ups are required: one for adults and
            one for larvae. Our visual stimulus modifies the stimulation format so that a single OMR stimulus, suitable for use with
            both adults and larvae, is being presented underneath the fish. Analysis of visuomotor responses using this method
            does not require costly behavioral tracking software and, using a single behavioral paradigm, allows the observer to
            rapidly determine visual spatial response in both zebrafish larvae and adults.
            Keywords: behavioral neuroscience, optomotor response, spatial frequency, visuomotor, zebrafish

                              BACKGROUND                                                  fitness [2]. Behavioral assays of vision are not only applicable to studies
                                                                                          of retinal pathology but also provide a whole-animal context of neural
    Zebrafish (Danio rerio) are an excellent animal model for functional                  and behavioral function determined at the cellular level [3,4].
studies due to their short life cycle, sequenced genome, and commer-                          The optomotor response (OMR) is an innate visuomotor reflex char-
cially available mutant strains [1]. To facilitate use of this model in                   acterized by the fish swimming in the same direction as a high-contrast
high throughput studies, methods for functional assessment must be                        visual stimulus. The swimming movement helps to stabilize the fish’s
highly reliable, repeatable, quantifiable, rapid, and inexpensive. One                    position with respect to the stimulus. The OMR is a variation of the
organ system that lends itself to functional studies via these throughput                 optokinetic response (OKR), another vision-based behavioral response
mechanisms is the visual system. In zebrafish, tests utilizing the visual                 which has been used in a large group of taxa, including humans [5].
sensory system are well established, as is the associated anatomy, par-                   Both OMR and OKR are used with zebrafish. The OMR is well char-
tially because of the heavy reliance on their visual system for optimal                   acterized in larval zebrafish as a screen for aberrant motion detection

    How to cite this article: LeFauve MK, Rowe CJ, Crowley-Perry M, Wiegand JL, Shapiro AG, Connaughton VP. Using a variant of the optomotor
    response as a visual defect detection assay in zebrafish. J Biol Methods 2021;8(1):e144. DOI: 10.14440/jbm.2021.341

www.jbmethods.org                                                                                                                                                             1
                                                                                 POL Scientific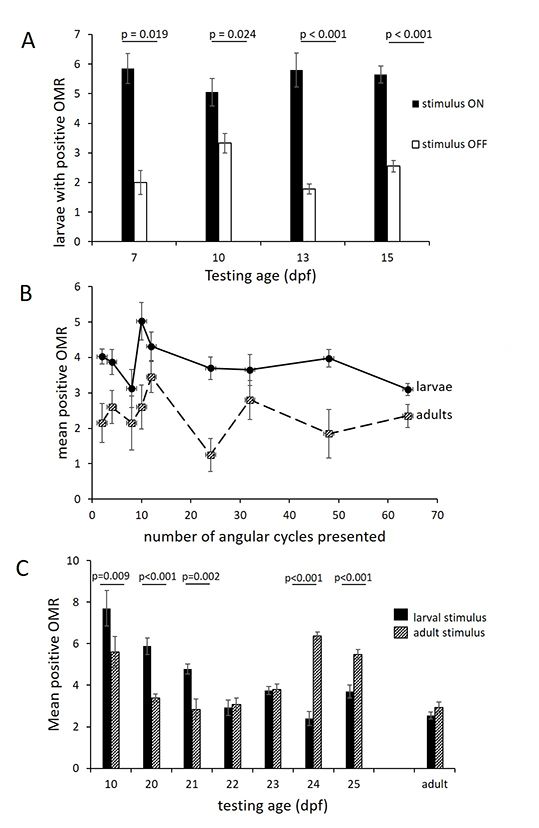
Protocol
during development [1,6]. These results are often coupled to the OKR maintained at 28 ± 3°C with a 14:10 light-dark cycle. The fish were
experiments, which identify retina-based defects. Because adults are fed Tetramin flakes supplemented with either powdered (larvae) or live
difficult to immobilize, which is a requirement for the OKR, the OMR (adults) brine shrimp twice daily [13].
is often used to assess changes in vision-based behaviors. The use To obtain larvae, zebrafish were bred in-house following established
of the OMR task in adult zebrafish has identified visual impairments protocols. In brief, group breeding was performed by placing multiple
due to genetic mutations and toxin exposures [7,8]. Zebrafish OMR female and male adult zebrafish from the breeding colony in a breeding
is generated by several separate visual and motor circuits, many of chamber overnight to ensure genetic variability of the wildtype offspring.
which overlap with the circuits activated by the OKR in the eyes [9]. The next morning, 30–60 min after lights on, embryos were collected,
OMR neural circuitry is evolutionarily conserved, involving binocular staged (shield to 75% epiboly), and placed in petri dishes maintained
neural activation, making the OMR separate from the OKR [10]. This at the same water temperature and light cycle as adults. Larvae were
suggests additional pretectal modulation is directly related to motor housed in 100 mm petri dishes in a temperature-controlled incubator
tuning via reticulospinal cells [11]. Thus, defects in the OMR may (Heratherm), at the same environmental conditions as stock tanks, for
suggest a major visuomotor defect that may not be detected by other at least two weeks prior to being shifted into the aquatic facility. Dishes
behavioral analyses. Though many studies have examined visuomotor were checked daily to remove debris and feed the larvae.
capacity and behavioral acuity in zebrafish, the methods are based on All experiments were performed within the protocols and guidelines
those validated for larval zebrafish, which may not work as well for approved by the Institutional Animal Care and Use Committee (IACUC)
adults. This has been demonstrated by the need for slightly different of American University.
OMR stimulus methods required for two recent publications from our
lab [8,12]. The method described here has been altered from those Equipment
initial works to address that issue. The result demonstrates a novel and 99 PsychoPy Psychophysics code package [14]
inexpensive OMR assay that quantitatively assesses visuomotor and 99 Python-based stimulus code (source code available at github.
behavioral spatial responses in both larval and adult zebrafish. com/MattLeFauve/OMRProject)
99 Computer capable of running PsychoPy
99 Standard Computer Monitor
MATERIALS 99 Larval Petri dish (100 mm diameter)
99 Adult Dish (28 cm diameter)
Animals 99 Video Recorder (Canon FS40 Handheld was used in this study)
Wild-type adult zebrafish (Danio rerio) obtained from either the 99 Closed Door Behavior Chamber/Cabinet (optional)
existing colony at American University or, if needed, a commercial 99 Video playback software (VideoLan VLC Mediaplayer was
supplier (LiveAquaria, CA, United States of America) and their offspring used in this study)
were used. Fish were housed in an aquatic facility (AHAB-Pentair), 99 Repeating stopwatch
PROCEDURE
Assembling the OMR setup
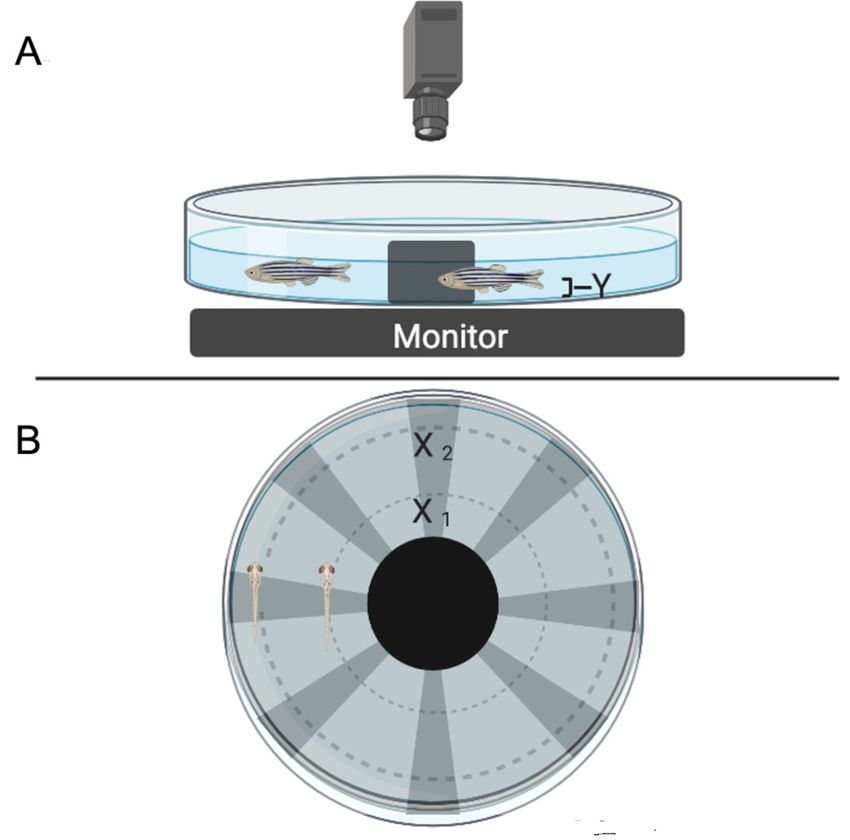
Figure 1 shows the OMR Task setup.
Running the OMR setup
1. Install Psychopy on your computer (http://psychopy.org/installation.html).
2. Download the stimulus from GitHub. Please see Table 1 to determine how to modify the stimulus if neces-
sary for your experimental setup.
3. Connect the monitor and the computer and test that the stimulus successfully fills the monitor screen. Prior
to playing the stimulus, the monitor should be calibrated using the tools provided on a Windows or Mac
computer (https://www.digitaltrends.com/computing/how-to-calibrate-your-monitor/). This will ensure the
stimulus is presented at the optimal optical resolution.
4. Place a 20.32 × 25.4 cm (8 in × 10 in) transparent film/acetate on the monitor to prevent water damage. Prior
to recordings, run the stimulus and position the experimental dish on the monitor to determine the optimal
location for both the adult and larval dishes. The dish should be directly above the stimulus and positioned
so the convergent point for the pinwheel is in the center of the dish.
5. Once the optimal dish position is determined, trace the outline of the bowl or make other markings, so you
can consistently position the dish in the same location between trials.
6. Position the camera above the monitor, inside the behavior chamber (Fig. 1). Camera height is somewhat
arbitrary (in our case ~45.72–60.96 cm above the dish) but should be high enough to allow movement/
2 J Biol Methods | 2021 | Vol. 8(1) | e144
POL ScientificProtocol
transferring of bowls and fish below it, but low enough so that the experimental dish fills the video screen.
Recording within a behavioral chamber is optimal, as it prevents distraction of the fish and also allows control
of external lighting while taking videos.
7. To prevent monocular visual distraction for the fish during stimulus presentation, place non-reflective tape
around the outside of the bowl to the water line.
8. Place a physical barrier such as a small straight sided glass container over the central portion of the testing
dish to prevent visual distraction at the point source of the stimulus as demonstrated in Figure 1B. To prevent
visual distraction stemming from this barrier, the center barrier should also be covered with non-reflective
tape. This provides a swimming arena for the fish that is an annulus, so the fish swims either clockwise or
counterclockwise within the dish.
Figure 1. Experimental setup. A. Setup from the side. B. Setup from the top, with the stimulus running. The computer monitor displaying the stimulus
is covered with a transparent 20.32 × 25.4 cm (8 × 10 in) piece of acetate to prevent water damage to the monitor. The dish should always be situated
in the center of the monitor, directly above the stimulus. Camera height above the dish is shown as 45.72–60.96 cm (~18–24 in) but should be adjusted
to allow detailed viewing of the entire dish and the movement of the fish in the dish. X1, X2, and Y are measurement parameters used to calculate visual
angle (see text step 22).
Presentation of the OMR
9. Fill the trial dish ~2/3 full with fresh system water. The larvae should be in 100 mm diameter dishes and the
adults should be in 28 cm diameter dishes (see equipment list).
10. Place up to 10 larvae or 1–2 adult fish in the dish. Position the glass container (step 8 above) in the center
of the dish.
11. Transfer the dish containing fish into the behavioral chamber and position it on the monitor, taking care to
make sure it is in the center of the monitor and aligned with the position markers (steps 4–5 above) on the
J Biol Methods | 2021 | Vol. 8(1) | e144 3
POL ScientificProtocol
transparent cover. Allow the fish at least three minutes to acclimate to the testing chamber. Acclimation to
the dish is performed within the recording chamber.
12. Turn the camera on and be sure the fish are visible.
13. Begin recording. Following the directions in the “OMR_Stimulus” code, project the stimulus below the fish.
The stimulus is designed to rotate clockwise then counterclockwise with a blank gray screen in the middle.
The default timing is 30 s for each direction and the blank screen, but timing can be altered by changing the
second number in the TIME line. Altering the TIME line number will change the seconds of each stimulus
direction, including the blank screen. The provided stimulus code has been written at the optimal speed and
angular cycles to elicit an optimal response for each age group. The optimal speed and angular cycle number
are presented in Table 1.
14. After allowing the stimulus to make as many full rounds of clockwise-gray-counterclockwise as necessary,
stop the stimulus by pressing the spacebar and stop the video recording. Zebrafish tend to exhaust and need
swimming recovery time after three to four full rounds of the stimulus when presented at 20 s intervals.
15. Once the behavior has been recorded, return fish back to the holding/stock tanks.
16. 16. This process can be repeated as many times as necessary to behaviorally test each fish. Extinction of
the OMR is possible however, so individuals should not be tested with more than 10 full rounds (clockwise,
gray, counterclockwise) in a 48 h period.
Table 1. Stimulus line descriptions.
Line Description Typical ranges
Time Seconds that the stimulus and blank “recovery” 30–60 s is the typical presentation time that reduces the potential for
screen are presented rapid exhaustion
Speed Time (in seconds) that it takes for one angular Larvae Stimulus: 1.04
cycle to go one full revolution. Number = rad/s Adult Stimulus: 1.033
Grating (angular cycles) Number of angular cycles presented Prime larval response: 16 angular cycles
Prime adult response: 12 angular cycles
Spatial resolution analysis tested 2–64 angular cycles
Grating (contrast) Strength of the leading edges of the stimulus The best OMRs were elicited by strong leading edges (0.9–1.0)
(LeFauve, 2015, personal observation)
We do not recommend changing this parameter in the stimulus code
Analysis of the video, detection assessment for visuomotor defect discovery
17. Ensure fish are visible in the recorded video before proceeding with data analysis. Adjustment of the camera
position may be necessary.
18. Movement of the fish in response to each stimulus can be analyzed in three ways, described below. In gen-
eral, as this method is designed to be implemented easily without costly behavioral software or time-costly
coding setup, it is not well-suited to using currently available open-source computer vision tracking software
such as PathtrackR [15].
18.1. Scan sampling—This can be applied to both larvae and adults but works best for larvae as the size
of the Petri dish may preclude the larvae from making a full revolution during stimulus presentation.
Scan sampling behavioral analysis can be used to assess group behaviors quickly. To assess OMR
success, at 10 s intervals, perform a rapid clockwise sweep of the dish and count the individuals mov-
ing in the direction of the stimulus. All individuals moving with the direction of the stimulus at the
time of the sweep are to be counted as demonstrating a positive OMR [16]. Individuals not moving
are therefore not showing an OMR and individuals moving in the opposite direction are showing a
negative OMR. For ease of analysis, this study combined individuals showing no OMR and showing a
negative OMR into a “non-positive OMR” group. If comparing treatment groups, it may be helpful to
count the number of larvae moving during the break period when the stimulus is not being presented.
Zebrafish have been shown to have motion aftereffect and so the first sweep of fish should not be
counted using this method.
4 J Biol Methods | 2021 | Vol. 8(1) | e144
POL ScientificProtocol
18.2. Counting the number of full revolutions—Adults are able to swim completely around the dish without
exhaustion during the stimulus interval, so the number of full revolutions can be counted. Counting the
number of times each fish makes one full revolution around the dish during the stimulus presentation
is similar to counting individuals following the OMR stimulus when presented in a unidirectional
pattern. This method works well for adult stimulus presentations.
18.3. Combination of observation and computer tracking. Open source behavioral software may be a viable
option to track the fish in this behavioral setup. Easier to use options that the authors recommend
include PathtrackR [15], ZebraZoom [17]. Current open-source behavioral tracking software performs
better when there is a constant background as most computer vision-based tracking is done using
organism-background contrast differences. As a result, a high contrast pinwheel stimulus, presented
below the fish, may result in automated tracking errors, as a dark fish above a dark portion of the
stimulus would be ‘lost’ and not counted. Thus, the method described here may lend itself better to
observer-based video tracking rather than computer-based tracking.
Analysis of the video, spatial frequency analysis
19. If necessary, repeat “Presentation of the OMR”. It is possible (and necessary when recording responses in
larval vs. adult fish) to change the number of angular cycles presented to the fish, explanation of this can
be found in Table 2. Angular cycles presented can be altered by changing the “angular cycles” number in
the “grating” lines. Up to three angular cycle amounts can be tested in one recording session before the
zebrafish will stop responding. If more angular cycle tests are needed for an individual, recovery time after
bout swimming can take up to 15 min (LeFauve, 2015, personal observation). Recovery can be conducted in
the testing apparatus with the monitor turned off. As stated above, zebrafish should not be tested with more
than 10 full rounds (clockwise-gray-counterclockwise) in a 48 h period.
20. Repeat step 17.
21. Movement of the fish in response to each angular cycle number can be done using the same measurements
provided in step 18. This will generate an optimal response curve (Fig. 2B). The optimal response curve
indicates what angular cycle demonstrates the strongest response based on either the number of individuals
exhibiting a positive OMR or the number of revolutions made by each individual in a treatment group.
22. The results are the proportion of time fish swim in one direction vs. either the frequency of grating (the
number of angular cycles presented, as in Fig. 2B) or the visual angle subtended by one cycle of the grating
on the fish retina. The visual angle can be calculated by the arctan of the distance from the fish to the screen
(Y in Fig. 1A) divided by the distance covered by one angular cycle. In our example, the distance from the
fish to screen was 40 mm for adults and 10 mm for larvae, the distance of the cycle depends on the fish’s
radial position in the dish (as in the X1 and X2 values in Fig. 1B). The width of the angular cycles can be
calculated by dish circumference divided by the number of angular cycles.
APPLICATION AND VALIDATION of taxa, including Drosophila, zebrafish, rodents and humans [20]. These
designs are all similar, with most stimuli presented as a rotating drum
We have optimized a variation of the standard OMR assay that is around the test subject. This type of experimental apparatus can present
suitable for use with both larval and adult zebrafish. Previous work a myriad of challenges stemming from costly experimental setups to
demonstrated that an OMR can first be detected at 5 dpf and reliably high analysis time. The method described here reduces the experimental
demonstrated by 7 dpf [18]. While the stimulus elicits an OMR be- cost and demonstrates an easy and repeatable observation technique by
ginning at 7 dpf, it becomes considerably more robust with age, as presenting the rotating drum stimulus as a computer-generated rotating
evidenced by the responses at 10 dpf and 13 dpf when compared to a pinwheel that is projected below the animal. Though this technique of
blank lit background screen (t-test, P < 0.001) (Fig. 2A). Maaswinkel presenting stimuli from below is currently used with zebrafish larvae, it
and Li suggested the optimal speed of the stimulus was 103 deg/s for is not commonly used with adults, which often require an OMR setup
juvenile to adult zebrafish [19]. To generate a comparable method, we with the stimulus presented from the side [1,21]. Thus, current OMR
maintained the stimulus at that speed while different spatial frequencies analysis across the life span of the fish requires two different laboratory
were tested. Larval zebrafish response peaked at 16 angular cycles and set-ups. With our technique, however, only one experimental set-up is
adult zebrafish response peaked at 12 angular cycles (Fig. 2B). For longer needed, as both larvae and adults respond to the computer-generated
duration studies, there appears to be a developmental time point when stimulus. The circular nature of our OMR technique reveals that adult
the zebrafish stop responding to the larval stimulus and begin responding zebrafish are capable of responding to an OMR stimulus presented from
to the adult stimulus. This occurs at 22–23 dpf and may reflect changes below, but only when side vision is obscured.
in the visual system at these ages (Fig. 2C). Previously, we used variations of this technique in our lab to identify
The classic OMR is used for visuomotor defect detection in a variety changes in the zebrafish visual system in response to developmental
J Biol Methods | 2021 | Vol. 8(1) | e144 5
POL ScientificProtocol
exposure to heavy metals [12] and endocrine disruptors [8]. The stimulus contrast. We have also identified the age at which stimulus parameters
used in these initial studies has been further modified to reduce any startle change for a larval to adult zebrafish transition. Additional work needs
response exhibited by the fish during stimulus presentation changes and to be done to determine how that age transition, and resulting behavioral
the overall luminosity of the stimulus while maintaining angular cycle response change, plays a role in organism function.
Figure 2. Positive OMR responses in larval and adult zebrafish. A. Stimulus-elicited positive OMR in larval zebrafish. This is the mean number (±
standard error = 20–30 per testing age) of larvae displaying a positive OMR when the stimulus is presented (black bars) vs. during the gray resting screen
(white bars). B. Positive OMRs evoked in response to different numbers of angular cycles. Mean number (± standard error) of larval (n = 20 per stimulus)
and adult (n = 6 per stimulus) zebrafish demonstrating a positive OMR during stimulus presentation. Responses were recorded across a range of spatial
frequencies, represented by an increasing number of angular cycles in the stimulus. C. Mean stimulus responses across ages tested. Larval stimulus
presentation (black bars) resulted in the largest number of positive OMR in zebrafish aged 21 dpf or younger. Conversely, the adult stimulus presentation
(hashed bars) resulted in the largest number of positive OMRs in zebrafish aged 24 dpf and older. At intermediate ages (22–23 dpf) zebrafish responded
similarly to both stimulus types, suggesting a transition stage. Statistical differences at each age (in A and C) were assessed using a t-test (IBM SPSS,
ver. 27). (n = 10–26 per testing age) Significant differences are indicated by bars, with corresponding P-values. α = 0.05.
In summary, we have modified an optomotor technique that is easily TROUBLESHOOTING
adaptable for use with adult and larval ages in the zebrafish model. The
ability to detect changes across the lifespan, using the same method This method is moderately straightforward in application, but is-
in both larval and adult zebrafish, will undoubtedly prove valuable. sues can potentially arise in the stimulus code. Presented in Table 1
are descriptions of each line that a user can alter, ultimately changing
6 J Biol Methods | 2021 | Vol. 8(1) | e144
POL ScientificProtocol
a component of the stimulus to be presented to the fish. Commonly encountered issues not already discussed are presented in Table 2.
Table 2. Troubleshooting.
Step number Problem Causes Suggestions
“Running OMR Fish are jumping out of the Fish may be startled by Letting the fish acclimate to the OMR setup may eliminate this prob-
Setup” OMR bowl the light source below lem, and after acclimation, the authors did not experience fish leaving
them the testing chambers. If this does not solve the issue, placing a clear
piece of acrylic on top of the testing container may be necessary.
14 Larvae are remaining active Fish are impacted Do not count the number of larvae swimming during the first 10 s scan
during the blank ”control” period by motion aftereffect sample interval to allow them time to overcome the visual illusion of
of the stimulus presentation motion as elicited by this motion aftereffect OR only count the fish locomotion while the stimulus
stimulus is being presented.
15 Testing visual acuity with vari- Increased angular cycle Below are the numbers to insert into the “SPEED” line for given angular
able angular cycle amounts, but amount will result in the cycles:
needing speed to be consistent stimulus increasing in • 2 angular cycles = 1.005
• 4 angular cycles = 1.01
speed based on stimulus
• 8 angular cycles = 1.02
code. This can be ac- • 12 angular cycles (validated adult stimulus) = 1.033
counted for by changing • 16 angular cycles (validated larval stimulus) = 1.04
the “SPEED” line. • 20 angular cycles = 1.05
• 24 angular cycles = 1.06
• 30 angular cycles = 1.068
• 36 angular cycles = 1.082
• 40 angular cycles = 1.095
• 46 angular cycles = 1.115
• 50 angular cycles = 1.12
• 56 angular cycles = 1.133
• 60 angular cycles = 1.143
• 66 angular cycles = 1.15
Acknowledgments 8. Gould CJ, Wiegand JL, Connaughton VP (2017) Acute developmental exposure
to 4-hydroxyandrostenedione has a long-term effect on visually-guided behaviors.
The authors would like to thank Alex Niu for his help in the original Neurotoxicol Teratol 64: 45-49. doi: 10.1016/j.ntt.2017.10.003. PMID: 29031477
OMR stimulus code generation. The authors would also like to thank the 9. Kubo F, Hablitzel B, Dal Maschio M, Driever W, Baier H, et al. (2014) Functional
two anonymous reviewers who helped make the manuscript stronger. architecture of an optic flow-responsive area that drives horizontal eye movements
in zebrafish. Neuron 81: 1344-1359. doi: 10.1016/j.neuron.2014.02.043. PMID:
24656253
10. Naumann EA, Fitzgerald JE, Dunn TW, Rihel J, Sompolinsky H, et al. (2016)
References
From Whole-Brain Data to Functional Circuit Models: The Zebrafish Optomotor
1. Neuhauss SC, Biehlmaier O, Seeliger MW, Das T, Kohler K, et al. (1999)
Response. Cell 167: 947-960. doi: 10.1016/j.cell.2016.10.019. PMID: 27814522
Genetic disorders of vision revealed by a behavioral screen of 400 essential
loci in zebrafish. J Neurosci 19: 8603-8615. PMID: 10493760 11. Dunn TW, Gebhardt C, Naumann EA, Riegler C, Ahrens MB, et al. (2016)
Neural Circuits Underlying Visually Evoked Escapes in Larval Zebrafish.
2. Suriyampola PS, Shelton DS, Shukla R, Roy T, Bhat A, et al. (2015) Zebrafish
Neuron 89: 613-628. doi: 10.1016/j.neuron.2015.12.021. PMID: 26804997
Social Behavior in the Wild. Zebrafish 13: 1-8. doi: 10.1089/zeb.2015.1159.
PMID: 26671510 12. LeFauve MK, Connaughton VP (2017) Developmental exposure to heavy
metals alters visually-guided behaviors in zebrafish. Curr Zool 63: 221-227.
3. Roeser T, Baier H (2003) Visuomotor behaviors in larval zebrafish after GFP-
doi: 10.1093/cz/zox017. PMID: 29491980
guided laser ablation of the optic tectum. J Neurosci 23: 3726-3734. PMID:
12736343 13. Lawrence C (2007) The husbandry of zebrafish (Danio rerio): A review.
Aquaculture 269: 1-20. doi: 10.1016/j.aquaculture.2007.04.077.
4. Connaughton VP, Graham D, Nelson R (2004) Identification and morphological
classification of horizontal, bipolar, and amacrine cells within the zebrafish 14. Peirce JW (2009) Generating Stimuli for Neuroscience Using PsychoPy. Front
retina. J Comp Neurol 477: 371-385. doi: 10.1002/cne.20261. PMID: 15329887 Neuroinform 2: 10. doi: 10.3389/neuro.11.010.2008. PMID: 19198666
5. Cameron DJ, Rassamdana F, Tam P, Dang K, Yanez C, et al. (2013) The 15. Harmer AMT, Thomas DB, Poisot T. pathtrackr: An R package for video
optokinetic response as a quantitative measure of visual acuity in zebrafish. J tracking and analysing animal movement. Methods Ecol Evol 10: 1196-1202.
Vis Exp : doi: 10.3791/50832. PMID: 24145465 doi: 10.1111/2041-210X.13200.
6. Orger MB, Smear MC, Anstis SM, Baier H (2000) Perception of Fourier 16. Tauber ES, Atkin A (1968) Optomotor responses to monocular stimulation:
and non-Fourier motion by larval zebrafish. Nat Neurosci 3: 1128-1133. doi: relation to visual system organization. Science 160: 1365-1367. doi: 10.1126/
10.1038/80649. PMID: 11036270 science.160.3834.1365. PMID: 5651899
7. Weber DN, Connaughton VP, Dellinger JA, Klemer D, Udvadia A, et al. (2007) 17. Mirat O, Sternberg JR, Severi KE, Wyart C (2013) ZebraZoom: an automated
Selenomethionine reduces visual deficits due to developmental methylmercury program for high-throughput behavioral analysis and categorization. Front
exposures. Physiol Behav 93: 250-260. doi: 10.1016/j.physbeh.2007.08.023. Neural Circuits 7: 107. doi: 10.3389/fncir.2013.00107. PMID: 23781175
PMID: 17905328 18. Portugues R, Engert F (2009) The neural basis of visual behaviors in the larval
J Biol Methods | 2021 | Vol. 8(1) | e144 7
POL ScientificProtocol
zebrafish. Curr Opin Neurobiol 19: 644-647. doi: 10.1016/j.conb.2009.10.007. 10.1242/jeb.037945. PMID: 20348349
PMID: 19896836 21. Kist AM, Portugues R (2019) Optomotor swimming in larval zebrafish is driven
19. Maaswinkel H, Li L (2003) Spatio-temporal frequency characteristics of the by global whole-field visual motion and local light-dark transitions. Cell Rep
optomotor response in zebrafish. Vision Res 43: 21-30. doi: 10.1016/s0042- 29: 659-670. doi: 10.1016/j.celrep.2019.09.024. PMID: 31618634
6989(02)00395-4. PMID: 12505601
This work is licensed under a Creative Commons Attribution-Non-
20. Theobald JC, Ringach DL, Frye MA (2010) Dynamics of optomotor responses Commercial-ShareAlike 4.0 International License: http://cre-
in Drosophila to perturbations in optic flow. J Exp Biol 213: 1366-1375. doi: ativecommons.org/licenses/by-nc-sa/4.0
8 J Biol Methods | 2021 | Vol. 8(1) | e144
POL ScientificYou can also read