USING COGNITIVE MAPPING TO STUDY THE RELATIONSHIP BETWEEN NEWS EXPOSURE AND COGNITIVE COMPLEXITY
←
→
Page content transcription
If your browser does not render page correctly, please read the page content below
Public Opinion Quarterly, Vol. 84, No. 3, 2020, pp. 599–628

USING COGNITIVE MAPPING TO STUDY THE
RELATIONSHIP BETWEEN NEWS EXPOSURE AND
COGNITIVE COMPLEXITY

MARK BOUKES     *

                                                                                                                                       Downloaded from https://academic.oup.com/poq/article/84/3/599/6133223 by guest on 01 December 2021
FEMKE A.W.J. VAN ESCH
JEROEN A. SNELLENS
SEBASTIAAN C. STEENMAN
RENS VLIEGENTHART

          Abstract Cognitive complexity is a concept that allows scholars to dis-
          tinguish unidimensional thinking from multidimensional thinking,
          which allows citizens to identify and integrate various perspectives of a
          topic. Especially in times of fake news, fact-free politics, and affective
          polarization, the news media would ideally foster such complex political
          understanding. The current paper introduces the method of cognitive
          mapping to measure cognitive complexity regarding citizens’ under-
          standing of the financial crisis, one of the most pressing political issues
          of the past decades. Linking content-analytic data to panel-survey data,
          we examine how exposure to news about the crisis relates to cognitive
          complexity. A wide variety of news sources (print, television, and
          online) were analyzed to take the high-choice media environment into
          account. Results show that news consumption generally is related to a
          less cognitively complex understanding of the financial crisis. However,
          actual exposure to news about the crisis (combined measurement of
          content analysis and survey data) is positively related to cognitive

MARK BOUKES is an assistant professor in the Department of Communication Science at the
Amsterdam School of Communication Research, University of Amsterdam, Amsterdam, the
Netherlands. FEMKE A.W.J. VAN ESCH is an associate professor of European integration at the
Utrecht School of Governance, Utrecht University, Utrecht, the Netherlands. JEROEN A. SNELLENS
is a senior IT and network security consultant at ./BtDt, the Hague, the Netherlands. SEBASTIAAN
C. STEENMAN is an assistant professor and director of the Undergraduate School of Governance at
Utrecht University, Utrecht, the Netherlands. RENS VLIEGENTHART is a professor for media and so-
ciety in the Department of Communication Science at the Amsterdam School of Communication
Research, University of Amsterdam, Amsterdam, the Netherlands. This study has been made
possible by a VIDI grant [016.145.369 to R. V.] from the Dutch Research Council. Data collec-
tion of the online news was carried out via the Infrastructure for Content Analysis on the Dutch
National e-Infrastructure with support of the SURF Cooperative. *Address correspondence to
Mark Boukes, Amsterdam School of Communication Research, University of Amsterdam,
Nieuwe Achtergracht 166, 1018 WV Amsterdam, the Netherlands; email: markboukes@gmail.com.
doi:10.1093/poq/nfaa040                                                            Advance Access publication 10 February 2021
C The Author(s) 2021. Published by Oxford University Press on behalf of American Association for Public Opinion Research.
V
This is an Open Access article distributed under the terms of the Creative Commons Attribution-NonCommercial-NoDerivs licence
(http://creativecommons.org/licenses/by-nc-nd/4.0/), which permits non-commercial reproduction and distribution of the work, in any
medium, provided the original work is not altered or transformed in any way, and that the work is properly cited. For commercial re-
use, please contact journals.permissions@oup.com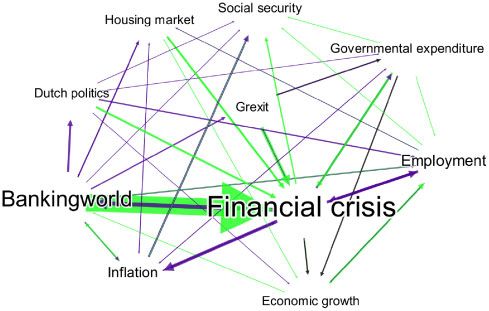
600                                                               Boukes et al.

      complexity, particularly among less-educated citizens. In addition, the
      most prominent topics in news coverage were more frequently associated
      with the financial crisis, as reflected in the cognitive maps of
      less-educated citizens exposed to more crisis news. These findings
      demonstrate the potential of news media to increase citizens’ complexity
      of understanding, especially among the less educated.

                                                                                    Downloaded from https://academic.oup.com/poq/article/84/3/599/6133223 by guest on 01 December 2021
For democracy to function well, citizens are expected to understand political
issues sufficiently to cast informed votes and to hold leaders accountable.
However, most prior research has examined citizens’ knowledge while con-
siderably less attention has been devoted to citizens’ understanding.
Understanding complex political issues requires more than knowledge alone,
and depends on the ability to link concepts to each other into one manageable
and accessible cognitive schema (Neuman 1981). This ability involves
differentiation—distinguishing among related concepts—and integration—
one’s understanding of how concepts are linked to one another (Tetlock
1983; Suedfeld 2010). Cognitive complexity is the theoretical construct that
captures both differentiation and integration (Conway et al. 2014).
   Political understanding is especially urgent in times of fake news, fact-free
politics, and affective polarization: The capacity to think complexly helps citi-
zens cope better with ambiguous information, think in less unidimensional pat-
terns, and diminishes the tendency to stereotype or opt for aggression
(Schroder, Driver, and Streufert 1967; Graber 2001; Sotirovic 2001).
Additionally, it allows more nuanced decision-making that takes multiple per-
spectives into account (e.g., Gomez and Wilson 2001; Sotirovic 2001).
Despite the importance of political understanding, little is known about how it
may be enhanced or disrupted by news coverage.
   The current study introduces a method called “cognitive mapping” that
permits valid measurement of the complexity of citizens’ political thinking.
This method is applied to an event that was particularly challenging for
ordinary citizens to understand: the global financial crisis (2009–2016), which
has been among the most pressing political issues of the past decades
(Hernández and Kriesi 2016). In the case of the financial crisis, cognitive
complexity entails, for instance, connecting potential causal institutions
(e.g., banking industry), outcomes (e.g., employment), policy measures
(e.g., government expenses), and involved actors (e.g., European Union)
rather than dogmatically attributing all blame to one cause or actor.
   To examine how news consumption relates to complexity of understanding
regarding the financial crisis and to zoom in on the cognitive maps of citizens
with more versus less news exposure, our study employs a unique combination
of three data collection methods: (1) a manual content analysis of news cover-
age; (2) a panel survey to measure media consumption; and (3) cognitive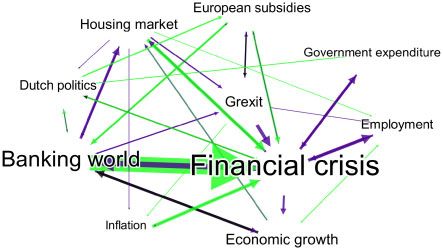
News, Cognitive Complexity, and Cognitive Maps                                601

mapping to gain insight into citizens’ cognitive complexity. Elaborating on the
knowledge gap hypothesis (Tichenor, Donohue, and Olien 1970), we assess
whether education conditions the relationship between news consumption and
cognitive complexity.

Cognitive Complexity, or Just Knowledge?

                                                                                      Downloaded from https://academic.oup.com/poq/article/84/3/599/6133223 by guest on 01 December 2021
In times of economic crisis, financial topics become highly salient in the main-
stream press (Soroka 2012; van Dalen, de Vreese, and Albæk 2017; Damstra
and Boukes 2018). Coverage of the European debt crisis (2009–2015) has
been dominated by substantive coverage rather than by strategically or
conflict-framed news (Quiring and Weber 2012; Falasca 2014) that empha-
sized morality, business, or system failures (Bach, Weber, and Quiring 2013;
Damstra and Vliegenthart 2018). Frame complexity increased in later stages of
the Eurozone crisis (Kleinnijenhuis, Schultz, and Oegema 2015; Picard 2015).
Moreover, news about the financial crisis touched upon many issues (Salgado
and Nienstedt 2016) and included a rich diversity of interviewed stakeholders
(Kalogeropoulos, Svensson, et al. 2015). This coverage thus holds the poten-
tial to induce a cognitively complex understanding of the crisis.
   News consumption improves citizens’ knowledge about politics (Eveland
et al. 2005; Jerit, Barabas, and Bolsen 2006), including political-economic
issues (Kalogeropoulos, Albæk, et al. 2015), but we lack evidence on whether
it increases cognitive complexity. Cognitive complexity consists of two prop-
erties: (a) differentiation, the ability to identify and discriminate multiple con-
cepts or dimensions of an issue (see Bieri 1955); and (b) integration, the
ability to perceive connections among these concepts (see Neuman 1981).
Most existing literature examined citizens’ ability to remember facts rather
than their understanding of political issues. However, being able to recall facts
(similar to differentiation) is a prerequisite for complex thinking, but does not
guarantee that citizens can integrate these in one integrated cognitive scheme
(Tetlock 1983; Eveland, Marton, and Seo 2004). Cognitive complexity
increases as citizens integrate more concepts into their understanding of a
topic. Critically, cognitive complexity does not take correctness or soundness
of associations into account—would that even be possible (Tetlock 1983). In
other words, it captures the underlying structure of reasoning instead of the ac-
tual content of thoughts (Suedfeld 2010).

COGNITIVE MAPPING AS A METHOD FOR STUDYING COGNITIVE COMPLEXITY

This paper introduces the method of cognitive mapping (Axelrod 1976) to the
study of public opinion, and cognitive complexity in particular. This technique
has been applied in organizational studies, political science, and social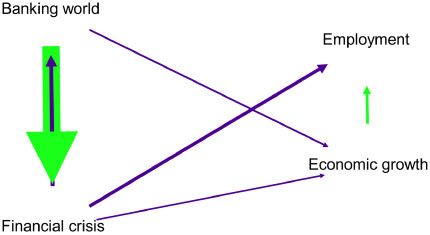
602 Boukes et al.
psychology to understand decision-making processes of managers and bankers
(Hodgkinson, Maule, and Bown 2004; van Esch and de Jong 2019).
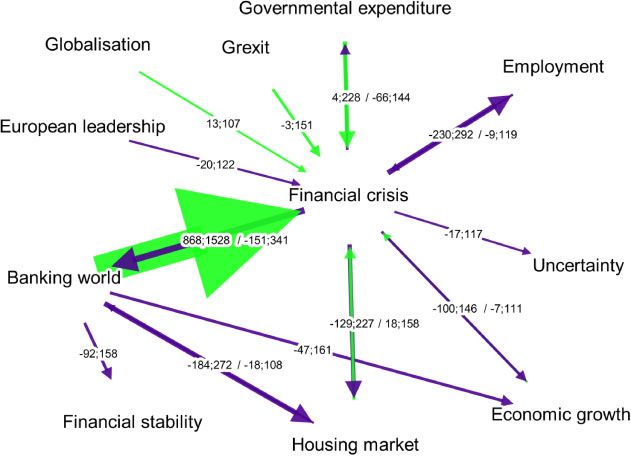
In cognitive maps, concepts are visually depicted as points in a diagram
with arrows indicating a causal direction or mutual relationship between them
(Axelrod 1976; Hodgkinson, Maule, and Bown 2004). All points (concepts)
and arrows (relationships) together depict an actor’s belief system. Figure 1
Downloaded from https://academic.oup.com/poq/article/84/3/599/6133223 by guest on 01 December 2021
illustrates such a diagram for a sample of hypothetical citizens. The words rep-
resent concepts—including objects such as the “banking world,” and condi-
tions such as “economic growth.” Concepts can also include key actors such
as public officials and processes. The arrows convey how the concepts are un-
derstood to be connected in the minds of the citizen. The direction of the arrow
indicates causal direction of the perceived causal effect, the width reflects the
relative number of citizens perceiving the connection, and the color of the ar-
row indicates whether the sign of the effect is positive (light green) or negative
(darker purple). For instance, the thick, green downward-pointing arrow
reflects that many citizens associate the banking world with having caused the
financial crisis, while the thinner, purple line running upward indicates that a
smaller number of citizens perceive that the crisis has diminished or harmed
the banking community.
The earliest application of cognitive mapping was derived by content analy-
sis of archival texts (Axelrod 1976), but recent techniques allow respondents
to draw their own cognitive map (van Esch, Joosen, and van Zuydam 2016).
This allows a bottom-up reflection of the issue under study. Respondents can
create their personal cognitive map in two ways (Hodgkinson, Maule, and
Bown 2004): (a) pairwise judgments of causal relationships between potential
concepts, or (b) a freehand approach in which actors visually express their be-
lief system.
Our study employs the freehand approach, which has multiple advantages
over pairwise judgments. Similar to the knowledge structure density
Figure 1. Visual illustration of a composite cognitive map of the financial
crisis for a hypothetical sample of citizens.News, Cognitive Complexity, and Cognitive Maps 603
measurement (Eveland, Marton, and Seo 2004), explicit pairwise judgments
are obtrusive (Axelrod 1976) and impose researchers’ conceptual frameworks
upon the respondents (Young and Schafer 1998; Gaxie, Hubé, and Rowell
2011). Cognitive maps generated through the freehand approach, by contrast,
are the outcome of actors searching their own memory of how they perceive
the relationships between concepts (Hodgkinson, Maule, and Bown 2004).
Downloaded from https://academic.oup.com/poq/article/84/3/599/6133223 by guest on 01 December 2021
This results in fewer false positives (inferred associations that do not exist in
one’s belief system) and more accurately reflects how people would respond
in real life. Finally, the freehand approach is quicker to administer, respondents
find the task relatively easy, and they perceive the result as more representative
of their thoughts (Hodgkinson, Maule, and Bown 2004).
HOW NEWS EXPOSURE CAN PROMOTE COGNITIVE COMPLEXITY
While abundant evidence exists that news consumption may contribute to
factual political-knowledge gain (Norris and Sanders 2003; Jerit, Barabas,
and Bolsen 2006; Boukes and Vliegenthart 2019), little is known about the
effect that mediated information may have on cognitive complexity
(Sotirovic 2001; Hutchens, Hmielowski, and Beam 2015). News coverage
generally oversimplifies the world because it is impossible to cover all
aspects in a single news item (Hilgartner and Bosk 1988) and only one or a
few “aspects of a perceived reality” (Entman 1993, p. 52) will be selected.
Moreover, by consuming news, one does not necessarily come across much
information about politically relevant issues, as such content may be over-
shadowed by distracting soft news topics that include crime, disaster, or ce-
lebrity news (Patterson 2000; Baum 2003). News consumption therefore
may not promote cognitive complexity regarding one specific issue (Luskin
1990; Eveland and Schmitt 2015). In contrast, it is possible that news con-
sumption makes people feel they understand the political world less
(Woodstock 2014) and reduces their understanding of economic issues
(Jansen and Neuenkirch 2018).
Rather than consuming the news, it is the quantity of relevant political infor-
mation to which one is exposed that can have a positive effect (Jerit, Barabas,
and Bolsen 2006; Elenbaas et al. 2013). Accordingly, the content of news out-
lets in combination with the actual exposure to these outlets needs to be ex-
plored (de Vreese et al. 2017) to assess whether news consumption, generally,
or the actual exposure to issue-specific news stories increases cognitive com-
plexity (see Eveland and Schmitt 2015). The media covered the financial crisis
substantively from a variety of perspectives (Quiring and Weber 2012; Falasca
2014), with multiple actors (Kalogeropoulos, Svensson, et al. 2015), and an in-
creasing level of complexity (Kleinnijenhuis, Schultz, and Oegema 2015).
Exposure to such news may thus provide the necessary information to elabo-
rate on the topic and increase the complexity of citizens’ understanding of the604 Boukes et al.
crisis. Accordingly, we differentiate between news consumption generally and
exposure to coverage of the financial crisis specifically. This leads to two
hypotheses:
H1: News consumption in general is not positively related to cognitive complexity
about the financial crisis.
H2: Exposure to news coverage about the financial crisis is positively related to
Downloaded from https://academic.oup.com/poq/article/84/3/599/6133223 by guest on 01 December 2021
cognitive complexity about the financial crisis.
ARE THE EFFECTS OF SPECIFIC NEWS EXPOSURE CONDITIONAL?
The knowledge gap hypothesis (Tichenor, Donohue, and Olien 1970) predicts
that people of higher socioeconomic status acquire information more effec-
tively from the media than less-educated citizens. Liu and Eveland (2005, p.
910), however, wrote that “the research literature is full of findings inconsis-
tent with the original expectation.” Media are especially adequate in informing
the citizens with lower levels of education or ability (Chaffee and Kanihan
1997; Eveland and Scheufele 2000; Shehata et al. 2015 found similar results
regarding knowledge). Our expectation is that a similar relationship exists con-
cerning cognitive complexity, given how the same processes are likely to
occur.
News consumption may reduce rather than amplify the gap between citizens
of high and low levels of education (Eveland and Scheufele 2000; Jebril et al.
2013). After all, highly educated citizens often have more alternative sources
of information (education, professional experiences, etc., Luskin 1990;
Robinson and Davis 1990) that restrict the impact of new sources of informa-
tion (Jennstål 2019). However, for less-educated citizens, the media may help
them gain more knowledge and increase understanding of how certain con-
cepts are associated. Accordingly, news media potentially reduce the knowl-
edge gap between citizens with higher versus lower levels of education
(Chaffee and Kanihan 1997; Boukes and Vliegenthart 2019). Assuming that
the same rationale holds true for cognitive complexity, we expect a contingent
effect:
H3: The effect of exposure to news coverage about the financial crisis on
cognitive complexity strengthens for citizens with lower levels of education.
If the positive relationship between the exposure to news about the crisis
and cognitive complexity is indeed stronger among less-educated citizens, sub-
stantive differences in the content and structure of their cognitive maps should
emerge for those with more versus less crisis news exposure. Arguably, the
relationships between concepts frequently associated with the crisis in news
coverage should be more prominent in citizens’ cognitive maps. To understand
the differences between lower educated citizens exposed to more or less newsNews, Cognitive Complexity, and Cognitive Maps 605
about the financial crisis, we qualitatively analyze their aggregated cognitive
maps:
RQ1: How do the cognitive maps of citizens with lower levels of education differ
between those who are exposed to more versus less news about the crisis?
Downloaded from https://academic.oup.com/poq/article/84/3/599/6133223 by guest on 01 December 2021
Methods
Data were collected in the first half of the year 2015 in the Netherlands.
Although early signs of economic recovery were witnessed at the aggregate
level (e.g., stock-market improvement; GDP increase), the economic situation
was still experienced as “in crisis” and consumer confidence was low
(Boukes, Damstra, and Vliegenthart 2019) because the most tangible economic
indicators for individual citizens had not yet improved much (e.g., high unem-
ployment, low house prices). Therefore, the central concept within this study
was “financial crisis,” a concrete construct with which actors, events, and other
economic concepts could be relatively clearly associated.
CONTENT ANALYSIS OF ECONOMIC NEWS COVERAGE
A content analysis of Dutch news was conducted for the period from February
to July 2015. Due to the high-choice media environment (Prior 2007), it was
important to investigate a wide array of outlets. Without clear partisan news
media in the country, a census of all economic news items of the most popular
mainstream news outlets was manually annotated for the presence of crisis
news (see table 1).
Newspaper articles about the economy were retrieved from LexisNexis and
stored in the Amsterdam Content Analysis Toolkit (AmCAT; van Atteveldt
et al. 2014) using an inclusive search string (Boukes et al. 2020). Website
items were scraped from RSS feeds and stored within Infrastructure for
Content Analysis (INCA; Trilling et al. 2018) using the same search string and
a 25 percent sampling.1 Within the retrieved articles, coders manually verified
whether each item dealt with economic news. For television news, economic
news items were manually identified by watching the full programs.
Altogether, this resulted in 7,076 economic news items.
Measurement and reliability. Within all these economic news items, a team
of 22 student coders analyzed whether a news item explicitly referred to either
the “economic crisis” or “financial crisis.” They could simply answer this by
1. For the most popular news website Nu.nl, all economic articles were selected and analyzed.606 Boukes et al.
Table 1. Overview of news media outlets used in the content analysis
(and survey questions), and their number of economic news items (n)
and news items about the crisis (ncrisis)
Modality Outlet Genre/broadcaster n ncrisis
Newspaper Algemeen Dagblad Popular 455 64
Downloaded from https://academic.oup.com/poq/article/84/3/599/6133223 by guest on 01 December 2021
Newspaper de Telegraaf Popular (with large 1,078 138
finance section)
Newspaper Metro Popular (free) 86 7
Newspaper NRC Handelsblad/Next Quality 628 142
Newspaper Trouw Quality 428 91
Newspaper de Volkskrant Quality 562 102
Newspaper Financieel Dagblad Financial 1,317 211
Newspaper Noordelijk Dagblad Regional 460 41
Newspaper Noordhollands Dagblad Regional 303 36
Newspaper de Gelderlander Regional 369 30
Television NOS Journaal (20.00 PM) News / Public 77 15
broadcaster
Television NOS op 3 News / Public 21 5
broadcaster
Television RTL Nieuws (19.30 PM) News / Commercial 78 14
broadcaster
Television EenVandaag Current affairs / Public 24 4
broadcaster
Television Nieuwsuur Current affairs / Public 64 14
broadcaster
Television RTL-Z Financial / Commercial 142 21
broadcaster
Internet Nu.nl Stand-alone news 49 4
website
Internet Telegraaf.nl Website of popular 301 37
newspaper
Internet Volkskrant.nl Website of quality 217 28
newspaper
Internet NRC.nl Website of quality 170 30
newspaper
Internet NOS.nl Website of public 247 28
broadcasting news
Total 7,076 1,062
means of a yes (1) or no (0). In total, 1,075 items (15.1 percent) were identi-
fied as dealing with the crisis. Additionally, the coders identified the main eco-
nomic topic of an article using an extensive list of 60 topics as well as its mainNews, Cognitive Complexity, and Cognitive Maps 607
noneconomic topic (from a list of 25 general news topics following the
Comparative Agendas Project Master Codebook; Bevan 2014).
A random selection of 248 newspaper and website articles was assessed by
multiple coders to assess intercoder reliability. Reliability statistics were calcu-
lated using Nogrod 1.1 (Wettstein 2018). The reliability in identifying crisis-
related news was satisfactory, especially considering the large number of
Downloaded from https://academic.oup.com/poq/article/84/3/599/6133223 by guest on 01 December 2021
coders. For crisis news (Krippendorf’s a ¼ 0.62, Holsti’s percent agreement
93.8 percent, Scott’s p ¼ 0.72, standardized Lotus ¼ 0.87). Similar scores
emerged for the categorical variables related to the topics covered: economic
main topic (a ¼ 0.64, standardized Lotus ¼ 0.83) and noneconomic main
topic (a ¼ 0.59, standardized Lotus ¼ 0.76).
SURVEY OF DUTCH ADULTS
During the same period as the content analysis, a three-wave panel survey
among Dutch adults was conducted by I&O Research. Only the first wave
(fielded on February 23, 2015) and the last wave (fielded on June 15, 2015)
are used since all relevant independent, control, and criterion variables were
tapped in either Wave 1 or Wave 3. After inviting 22,879 panel members,
9,112 people started the first questionnaire (RR2 ¼ 39.8 percent) of which
6,386 completed the survey (RR1 ¼ 27.9 percent; cooperation rate,
COOP1 ¼ 70.1 percent). With an attrition rate of 28 percent per wave, 3,270
respondents completed the last survey wave, of whom 2,511 also completed
the cognitive mapping exercise. Although I&O’s pool of respondents was
recruited using random sampling from population registers, it was not fully
representative of the Dutch population in that respondents were older than
average (18–91 years of age, M ¼ 61.32, SD ¼ 11.14), and included an
overrepresentation of males (66.2 percent) and more highly educated people
(50.5 percent). The large sample size, however, leaves sufficient observa-
tions in the investigated subsamples for a qualitative analysis of their cogni-
tive maps.
Measurements: independent variables. News consumption was measured
by asking how many days per week respondents read/watched the specific
news outlets for which the content analysis was conducted (see table 1).
Responses were recoded to range from 0 (no consumption of outlet) to 1
(maximal/daily consumption) and summed to measure total news consump-
tion. On average, respondents consumed news from 3.88 (SD ¼ 1.82) outlets
per day.
Exposure to news about the financial crisis. To measure actual exposure
to news about the crisis, data of the content analysis were combined with the
news consumption variables. For every individual respondent (i), the608 Boukes et al.
frequency of consumption of a certain outlet (k) is multiplied by the summed
number of news items about the economic crisis within this outlet k in the four
months prior to the last survey wave:
X
Exposure to crisis newsi ¼ Consumption of ½outlet ki
Presence of crisis news in ½outlet k
Downloaded from https://academic.oup.com/poq/article/84/3/599/6133223 by guest on 01 December 2021
This variable indicates the number of news items about the financial crisis
that a respondent would have been exposed to before taking the final survey
and drawing their cognitive map. On average, there were 130.23 news items
with large variation between respondents (SD ¼ 98.56).
Moderator: education. In line with Tichenor and colleagues (1970) and
following the guidelines of UNESCO’s International Standard Classification
of Education (ISCED 2011), we distinguish three levels of education. Lower
education includes primary education only, preparatory vocational second-
ary education (lower level of secondary education, in Dutch: LTS or
VMBO), and less than three years of secondary school at the two highest
levels. This low-education group has not finished professional education
and stopped studying after or during secondary school. Intermediate educa-
tion includes intermediate vocational education (in Dutch: MBO), and the
last three years of secondary school within the two highest levels (senior
general secondary or university preparatory education; in Dutch: HAVO
and VWO). Higher education includes higher professional education (in
Dutch: HBO) and research-oriented university education (in Dutch: WO).
All three levels of education—lower (n ¼ 435, 17.5 percent), intermediate
(n ¼ 745, 29.9 percent), and higher education (n ¼ 1,309, 52.6 percent)—are
well represented in our sample. Education is treated as a categorical variable in
the analysis with a dummy coding scheme that has intermediate education as
the reference category.
Control variables. To reduce the likelihood of omitted variables bias, analy-
ses controlled for age, gender, political knowledge, efficacy, interest, ideology,
discussion frequency, and survey duration. Moreover, dummy variables were
included for whether people personally had positive economic experiences
(found a job, salary raise, or promotion) or negative personal experiences (be-
coming unemployed, salary decrease) in the past four months.
Dependent variable: cognitive complexity using cognitive mapping.
Cognitive mapping represents belief structures as the combination of concepts
one has in memory and the perceived relationships among these conceptsNews, Cognitive Complexity, and Cognitive Maps 609
(Young 1996). This is highly comparable to the differentiation and integration
elements in cognitive complexity (Tetlock 1983). Hence, the cognitive map-
ping technique offers an empirical measure that closely approximates the theo-
retical construct of cognitive complexity (Young 1996).
At the end of the third wave of the survey, respondents were forwarded to
the web application DART in which cognitive maps were directly elicited us-
Downloaded from https://academic.oup.com/poq/article/84/3/599/6133223 by guest on 01 December 2021
ing the freehand approach.2 To draw their map, respondents were first asked
to select a maximum of seven out of a list of 47 predefined concepts (see ap-
pendix B). “Financial crisis” was preselected. Although the 47 predefined con-
cepts slightly limited the bottom-up character of the task, it still provided
respondents with 4,418 (47 47 concepts 2 relationship types) possible
relationships to draw.
Subsequently, respondents were asked to draw arrows between the concepts
to indicate how they perceived them to be linked. The direction of the arrow
indicated the direction of the perceived causal effect, while the color of the ar-
row indicated whether the effect was deemed to be positive (light green) or
negative (darker purple).3
How cognitively complex, varied, and interconnected individuals’ belief
systems are (Suedfeld and Tetlock 1977; Young and Schafer 1998) can be cal-
culated by the number of (in- and outgoing) relationships between concepts in
the map, thereby summarizing the number of causes and consequences that a
person associates with the concepts (Shapiro and Bonham 1973): More cogni-
tively complex belief systems are more interconnected (i.e., less unidimen-
sional). On average, respondents have drawn 2.41 (SD ¼ 1.42) associations
between the financial crisis and related concepts, with a maximum of 12.
Although this may not seem like a lot, it corresponds with previous research
that citizens generally have low levels of cognitive complexity (Van Hiel and
Mervielde 2003) and only few are able to make real abstractions (Neuman
1981). Because only 1.47 percent of the sample had drawn seven or more
associations with the financial crisis concept, these were grouped together,
thus resulting in a scale from 0 to 7.
Validity of cognitive mapping as a measurement of cognitive complexity.
If the characteristics of cognitive maps are valid indicators of cognitive com-
plexity, they should be correlated with theoretically relevant criterion variables
2. This video shows the procedure respondents experienced while creating their personal cogni-
tive map: https://osf.io/ewbkm/?view_only¼2972642f46804a609653589ad9455823.
3. The use of a negative key concept (financial crisis) raised issues for the analysis. When
respondents connect a cause-concept with a negative arrow to the concept of financial crisis, in
essence, they are making a double negative statement. A comparison between how respondents
connected the concept “banking world” to financial crisis and their answers to the open-ended
survey question “Who or what is responsible for the financial crisis?” confirmed that this caused
confusion for some. All double negative statements of these respondents were corrected.610 Boukes et al.
(Cronbach and Meehl 1955; Treiman 2014). We identified five such criterion
variables. First, the differentiation part of complexity has also been coined po-
litical knowledge or “knowledge-in-use” (Neuman 1981, p. 1240), which is
a precondition for integration (Suedfeld 2010). Hence, more knowledge
should be related to more complexity, also because it increases the need to
organize one’s ideas (Neuman 1981; Luskin 1987). Second, education not
Downloaded from https://academic.oup.com/poq/article/84/3/599/6133223 by guest on 01 December 2021
only reflects people’s general level of intelligence, it in particular strength-
ens people’s ability to reflect and think in abstract terms, thus allowing
more complex thinking (Neuman 1981; Jennstål 2019). Internal political
efficacy captures whether people believe they are able to understand and
participate in politics (Niemi, Craig, and Mattei 1991), and could thus be
regarded as a self-reported measure of cognitive complexity. Interest in a
topic encourages the search for more (political) information (Luskin 1990),
and therefore would relate to higher cognitive complexity. Moreover, engag-
ing in political discussions increases complexity of thinking, not due to
knowledge gain per se (Jennstål 2019) but because it encourages people to
elaborate on a topic (Eveland 2004).
Finally, it is possible that the complexity of cognitive maps is simply an ar-
tifact of respondent effort. Respondents who are more thoughtful in answering
questions throughout the survey, or those high in verbal fluency, might simply
spend more time drawing their cognitive map. If so, the number of concepts
and connections could be an artifact of effort. To rule this out, we would hope
that cognitive complexity is not correlated with survey response duration
(O’Keefe and Sypher 1981).
Validity criterion measurements. Factual knowledge was measured by 11
multiple-choice questions (M ¼ 8.08, SD ¼ 2.16; full details in appendix A).
As an alternative knowledge measure, we asked respondents to estimate the
unemployment rate and calculated the difference with the real rate (logarithmi-
cally transformed to deal with outliers). Internal political efficacy was mea-
sured with three items asking how well respondents believed they were able to
discuss economic issues, understand economic matters, and feel informed
about the economy compared to others (Cronbach’s a ¼ 0.89). Current affairs
interest was measured by combining two items regarding people’s interest in
politics and economics (a ¼ 0.75). Political discussion frequency was tapped
by two questions asking how frequently people discussed economic or politi-
cal topics (a ¼ 0.87). Duration of survey response was measured as the num-
ber of minutes it took respondents to complete the last survey (M ¼ 32.31, SD
¼ 25.75).
Criterion-oriented validity. Pairwise correlation analyses were run with cog-
nitive complexity and the criterion variables to verify whether the number ofNews, Cognitive Complexity, and Cognitive Maps 611
Table 2. Tests of criterion-oriented validity using bivariate correlation with
cognitive complexity
Bivariate correlation
Criterion variables r p
Factual knowledge 0.06 0.001
Downloaded from https://academic.oup.com/poq/article/84/3/599/6133223 by guest on 01 December 2021
D estimate unemployment (log) –0.12 0.000
Education (low, intermediate, high) 0.15 0.000
Internal efficacy 0.08 0.000
Current affairs interest 0.02 0.235
Current affairs discussion frequency 0.07 0.001
Survey response duration 0.01 0.484
NOTE.—Cells contain coefficients of Pearson correlation with cognitive complexity (r), and
probabilities (p; two-tailed).
associations with the financial crisis in the cognitive map is a valid measure-
ment of cognitive complexity. The number of associations with financial crisis
in cognitive maps (i.e., dependent variable) indeed correlated in the expected
direction with the two factual knowledge variables, education, internal self-
efficacy, and current affairs discussion frequency (see table 2). Surprisingly,
cognitive complexity was positively, but not significantly, correlated to current
affairs interest; we elaborate on this finding in the discussion. No significant
correlation was found with survey response duration, which further increased
trust in the validity of cognitive complexity’s measurement.
Results
TOPICS IN CRISIS NEWS
Three specific topics were particularly prominent in news coverage about the
financial crisis (see fig. 2): the Greek debt crisis with a heavy focus on a possi-
ble Grexit; general economic developments; and economic decline or growth.
Other heavily covered topics within this news were the role of banks, (un)em-
ployment, and the housing market.
While the majority of news items solely focused on economic news (58.4
percent), some economic news stories also contained a central noneconomic
topic. Most visible among the noneconomic main topics were political issues,
especially European Union politics (15.1 percent of the items) and national
politics (7.7 percent). All other noneconomic main topics were only marginally
visible (3 percent or less).612 Boukes et al.
Top-20 Topics in News about Financial Crisis
0% 2% 4% 6% 8% 10% 12% 14% 16% 18%
Greek debt crisis
General economic developments
Economic growth
Banks
Housing market and prices
Downloaded from https://academic.oup.com/poq/article/84/3/599/6133223 by guest on 01 December 2021
(Un)employment
Crisis in general
Stock market
Taxes
Financial system in general
Interest rate
Personal economic situations
Salaries
Turnover (growth or decrease)
Development in sales
Budget cuts by government
Financial troubles of citizens
Inflation, prices and value of euro
Profitability
Layoffs
Figure 2. Top 20 most visible topics in news about the financial crisis.
From content analysis of 7,076 newspaper, television, and internet news stories,
February 2015–July 2015.
COGNITIVE MAPS
To provide a visualization of what the aggregated cognitive map of all
respondents looks like, network software Gephi (Bastian, Heymann, and
Jacomy 2009) was used to create figure 3. Eleven concepts were used an
above average number of times, seven of which overlap with the most promi-
nent issues reported in crisis news coverage. One relationship in particular
stands out: The association between the financial crisis and banking world is
unique in its consistency and strength. The banking world as well as govern-
ment spending, Grexit, European leadership, and globalization are generally
more often perceived as causes of the financial crisis than as being affected by
it. By contrast, (un)employment, economic growth, the housing market, finan-
cial stability, and uncertainty are generally perceived to be outcomes of the cri-
sis. Overall, these cause-effect relationships make sense, thus strengthening
our confidence in the measurement method.
NEWS CONSUMPTION, CRISIS NEWS EXPOSURE, AND COGNITIVE COMPLEXITY
Table 3 shows the results of regression models predicting cognitive complexity
of the financial crisis. Regarding the control variables, more cognitiveNews, Cognitive Complexity, and Cognitive Maps 613
Downloaded from https://academic.oup.com/poq/article/84/3/599/6133223 by guest on 01 December 2021
Figure 3. Excerpt of aggregated cognitive map with 11 most salient con-
cepts and the 18 most salient relations. Light green color represents positive
associations and darker purple color represents negative relationships. The
labels (a;b) report two alternative metrics for the strength of the relationship.
The number before the semicolon (a) is net positivity: the total number of posi-
tive arrows minus the number of negative arrows drawn by respondents. The
number after the semicolon (b) is the total weight of the relation (i.e., the num-
ber of drawn relationships). For concepts that have arrows going back and forth,
two labels are visible separated by a slash (a;b/a;b), whereby the first pair refers
to the largest arrow between the concepts.
complexity was found among the higher educated, younger, more knowledge-
able, and more politically efficacious citizens. Interestingly, citizens who
placed themselves on the left side of the political spectrum scored higher on
complexity. This corresponds with what is known of political elites such as
political candidates (Conway et al. 2016) and justices (Tetlock, Bernzweig,
and Gallant 1985). On top of that, model 1 finds a negative relationship be-
tween news consumption (irrespective of content) and complexity of one’s un-
derstanding of the financial crisis. This finding supports H1: With every extra
news outlet that one consumed daily, the number of associations in the cogni-
tive map decreased 0.07 points (i.e., a positive relationship did not emerge).
Model 2 adds the number of crisis news items that citizens were exposed to
before drawing their cognitive map. To include news consumption and crisisTable 3. OLS regression models predicting cognitive complexity
614
Model 1: News Model 2: Exposure Model 3: Interactions
consumption to crisis news with education
Independent variable B (S.E.) b p B (S.E.) b p B (S.E.) b p
Intercept 3.52 (0.24) 0.000 3.54 (0.24) 0.000 3.38 (0.27) 0.000
Lower education –0.10 (0.08) –0.03 0.232 –0.10 (0.08) –0.03 0.236 0.16 (0.20) 0.04 0.427
Higher education 0.29 (0.06) 0.10 0.000 0.29 (0.06) 0.10 0.000 0.51 (0.16) 0.18 0.001
Survey response duration 0.00 (0.00) 0.06 0.003 0.00 (0.00) 0.06 0.003 0.00 (0.00) 0.06 0.003
Age –0.03 (0.00) –0.21 0.000 –0.03 (0.00) –0.21 0.000 –0.03 (0.00) –0.21 0.000
Gender (0 ¼ male, 1 ¼ female) 0.10 (0.06) 0.03 0.133 0.09 (0.06) 0.03 0.140 0.09 (0.06) 0.03 0.151
Positive economic experiences 0.12 (0.19) 0.01 0.530 0.11 (0.19) 0.01 0.540 0.12 (0.18) 0.01 0.510
Negative economic experiences –0.15 (0.17) –0.02 0.377 –0.15 (0.17) –0.02 0.369 –0.16 (0.17) –0.02 0.354
Political ideology (left-right) –0.04 (0.01) –0.06 0.002 –0.04 (0.01) –0.06 0.002 –0.04 (0.01) –0.06 0.001
Factual knowledge 0.04 (0.01) 0.06 0.004 0.04 (0.01) 0.06 0.004 0.04 (0.01) 0.06 0.004
Internal efficacy 0.03 (0.01) 0.07 0.008 0.03 (0.01) 0.07 0.009 0.03 (0.01) 0.07 0.008
Current affairs interest –0.01 (0.02) –0.01 0.711 –0.01 (0.02) –0.01 0.711 –0.01 (0.02) –0.01 0.757
Current affairs discussion frequency 0.03 (0.02) 0.04 0.106 0.03 (0.02) 0.04 0.106 0.04 (0.02) 0.04 0.102
News consumption –0.07 (0.02) –0.08 0.000 –0.07 (0.02) –0.10 0.001 –0.03 (0.04) –0.03 0.481
Exposure to crisis news 0.00 (0.00) 0.02 0.589 0.00 (0.00) 0.00 0.953
Lower education news consumption –0.15 (0.07) –0.18 0.019
Higher education news consumption –0.05 (0.05) –0.08 0.317
Lower education crisis news exposure 0.00 (0.00) 0.12 0.022
Higher education crisis news exposure –0.00 (0.00) –0.01 0.863
R2 0.092 0.093 0.096
N 2,453 2,453 2,453
Boukes et al.
NOTE.—Cells include, for each independent variable, unstandardized coefficients (B), robust standard errors in parentheses (S.E.), standardized coefficients
(b), and two-tailed probabilities (p).
Downloaded from https://academic.oup.com/poq/article/84/3/599/6133223 by guest on 01 December 2021News, Cognitive Complexity, and Cognitive Maps 615
news exposure in one model, these variables should not correlate too strongly.
With r ¼ 0.77, this turned out to be unproblematic (VIF < 2.5). A positive
but nonsignificant relationship (b ¼ 0.01, p ¼ 0.625) emerged between crisis
news exposure and cognitive complexity; thus, we found no support for H2.
Model 3 adds interactions between crisis news exposure and education to
examine whether the relationship with cognitive complexity is conditional
Downloaded from https://academic.oup.com/poq/article/84/3/599/6133223 by guest on 01 December 2021
upon education. Because of the strong correlation between crisis news expo-
sure and general news consumption, it is necessary to also include interactions
with the latter to avoid spurious relationships. Two interesting patterns are
found. First, the interaction between lower levels of education and news con-
sumption was significant. In other words, news consumption had a negative
relationship with cognitive complexity only among less-educated citizens (see
fig. 4), with an insignificant main negative effect of news consumption (i.e.,
for the reference category, or those with an intermediate level of education).
News consumption thus did not significantly relate to complexity about the fi-
nancial crisis among citizens with intermediate and higher levels of education.
By contrast, there was a significant and positive interaction effect of expo-
sure to crisis news on cognitive complexity among less-educated respondents
(b ¼ 0.12, p ¼ 0.022). As shown in figure 5, less-educated citizens exposed
to more crisis news have a more complex understanding of the financial crisis
when compared with their counterparts who had been exposed to less crisis
news. This effect of crisis news coverage did not occur among citizens of in-
termediate and higher education. Evidence is thus found in support of H3.
Among less-educated citizens, then, the data indicate both a positive rela-
tionship between exposure to crisis news and cognitive complexity as well as
a negative relationship between general news consumption and cognitive
Figure 4. Estimated cognitive complexity regarding the financial crisis for
different levels of education when citizens consume more (right side) or
fewer news outlets (left side) with 95 percent confidence interval.616 Boukes et al.
Downloaded from https://academic.oup.com/poq/article/84/3/599/6133223 by guest on 01 December 2021
Figure 5. Estimated cognitive complexity regarding the financial crisis for
different levels of education when citizens are exposed to more (right side)
or less news items about the crisis (left side) with 95 percent confidence
interval.
complexity. As such, the overall relationship is complex, not surprising given
that both independent variables are inherently correlated (r ¼ 0.77). After
all, less-educated citizens who are exposed to more news about the crisis
specifically (which increases cognitive complexity) will also see more news in
general (which decreases cognitive complexity). For example, if one compares
(a) an average group of lower-educated citizens with a mean level of crisis
news exposure to (b) a group of lower-educated citizens with one standard
deviation (þ1 SD) more crisis news exposure, one should also assume that the
latter group has a 0.77 standard deviation higher general news exposure.
Accordingly, their cognitive complexity will go up with another þ0.12 SD
(see model 3) but also decrease with an additional 0.14 points (i.e., 0.77
–0.18). These effects thus cancel each other out under normal circumstances.
Cognitive complexity consequently only increases if lower-educated news
audiences shift their attention to news media in which they are more likely to
be exposed to issue-relevant news (in our case, quality and financial newspa-
pers; see table 1) while at the same time tuning out from media that cover the
topic less frequently.
Altogether, this raises the question of how the cognitive maps of less well-
educated people with more (þ1 SD, n ¼ 39) versus less (–1 SD, n ¼ 75) expo-
sure to crisis news substantively differed in terms of content and complexity.
Reviewing the relationships between the 10 most salient concepts in their
maps reveals a high level of overlap (9 out of 10) in chosen concepts (see
figs. 6 and 7). The only difference is that those with little crisis news exposure
identified social security as the sixth most salient concept, whereas highly
exposed respondents selected European subsidies. As European Union politicsNews, Cognitive Complexity, and Cognitive Maps 617
was a prominent topic in news about the crisis, this is a first sign that issue-
relevant news exposure informed people’s cognitive map.
Looking at the relative salience of drawn associations, clearer differences
emerge. Respondents with less crisis news exposure associated the crisis
more frequently with the concepts of employment, inflation, and government
expenditure (fig. 6). Respondents with more crisis news exposure, by contrast,
Downloaded from https://academic.oup.com/poq/article/84/3/599/6133223 by guest on 01 December 2021
Figure 6. Cognitive map of low-educated respondents with less than aver-
age (–1 SD) crisis news exposure (top 10 most salient concepts; the larger
the concept/relation, the higher its saliency). Relationships that are on average
perceived as positive are drawn with light green color and negative relationships
in darker purple color (n ¼ 75).
Figure 7. Cognitive map of low-educated respondents with more than av-
erage (11 SD) crisis news exposure (top 10 most salient concepts; the larger
the concept/relation, the higher its saliency). Relationships that are on average
perceived as positive are drawn with light green color and negative relationships
in darker purple color (n ¼ 39).618 Boukes et al.
perceived the concepts of economic growth, Grexit, the housing market, and
Dutch politics as relatively more salient (fig. 7). Interestingly, the latter topics
were the most salient topics in the news about the financial crisis. Thus, a
clearer correspondence exists between the cognitive maps of less-educated citi-
zens exposed to more news about the crisis and the topics that were most
prominent in the news about this topic. Hence, differences in cognitive com-
Downloaded from https://academic.oup.com/poq/article/84/3/599/6133223 by guest on 01 December 2021
plexity among lower-educated citizens can partly be explained by the amount
of exposure to news about this topic.
A second remarkable difference concerns the role of the banking world.
Whereas both groups believe that banks are the main instigator of the financial
crisis, the extent to which differs. Among lower-educated respondents with
most crisis news exposure, 65 percent indicated that the banking world is a
major cause of the crisis, while 35 percent suggested that the banking world
prevented the crisis. Among lower-educated respondents with little crisis news
exposure, the respective proportions are 54 percent and 46 percent. Moreover,
while only 33 percent of the connections drawn by respondents with less news
exposure indicate that the financial crisis has a negative effect on the banking
world, for respondents with most crisis news exposure, this figure is 75 per-
cent. Hence, the understanding of those with more frequent exposure to crisis
news was more cognitively complex: They tend to identify the reciprocity and
backlash in the relationship between banks and the crisis as well as adhere to
the—by now commonly accepted—idea that banks have (partly) caused the
crisis.
Another major difference between the two groups with less education is that
individuals with more frequent exposure to crisis news, overall, drew about
twice (6.74) as many relationships between the concepts in their maps as those
with less exposure (3.10). The connectedness of the top 10 concepts identified
by the respondents with high media exposure is between 1.6 and 2.6 times
higher than the connectedness of the low-exposure group.
Discussion
Understanding of the financial crisis becomes more cognitively complex
among those with most exposure to issue-relevant news items, but only among
the lower-educated citizens, and for many this effect will cancel out if general
news consumption is higher too. People with less education may thus have
benefited most from exposure to issue-relevant news (Eveland and Scheufele
2000; Shehata et al. 2015; Boukes and Vliegenthart 2019 found similar results
regarding knowledge). This finding implies that media may help lower-
educated citizens achieve more cognitively complex understanding by teaching
them how to “connect the dots” (Hansen and Pedersen 2014) on a certain issue
by covering it heavily. Qualitative inspection of their aggregated cognitiveNews, Cognitive Complexity, and Cognitive Maps 619
maps revealed that those concepts that featured prominently in news coverage
about the crisis also featured more dominantly in the maps of low-educated
respondents with more news exposure. Although regarding a conceptually dif-
ferent outcome, we thereby find evidence contradicting Tichenor, Donohue,
and Olien’s (1970) well-established knowledge gap hypothesis. As the cogni-
tive mapping exercise happened after the measured exposure to crisis news,
Downloaded from https://academic.oup.com/poq/article/84/3/599/6133223 by guest on 01 December 2021
but was only included once in the panel survey, no changes in cognitive com-
plexity could be observed. Hence, one should be careful not to draw firm con-
clusions about causal direction.
Whereas exposure to news about the financial crisis could thus increase cog-
nitive complexity, the opposite was found for news consumption generally (ir-
respective of content). Potentially, the dominance of sensational topics could
have distracted citizens from an issue as complex as the financial crisis
(Patterson 2000; Baum 2003). Moreover, the news is often perceived as too
complicated, abstract, and irrelevant (Bird 1998), which may generally harm
perceived comprehension of current affairs (Costera Meijer 2003; Woodstock
2014). Just consuming the news without actual exposure to issue-relevant in-
formation therefore could decrease the complexity of citizens’ understanding.
Tests of cognitive mapping’s criterion-oriented validity have shown that this
measurement of cognitive complexity and most criterion variables were signif-
icantly correlated in the expected direction. However, correlations were rather
weak (r 0.15), which suggests the presence of considerable measurement er-
ror. Arguably, the employed measurement was not very precise, as may be
expected from a newly developed method. Further research is needed to verify
the reliability of cognitive mapping as a method to measure cognitive com-
plexity and to experiment with different instructions, interfaces, or rewards to
ease respondents’ experience while drawing their cognitive maps. The insignif-
icant correlation between cognitive complexity and current-affairs interest is
surprising given that interest functions as a proxy for related concepts, such as
information-seeking (Luskin 1990). Given that interest captures the motivation
to learn about political matters, this finding potentially speaks to the theoretical
need to separate the motivation and ability of processing political information
(Lecheler and de Vreese 2017). Indeed, cognitive complexity theoretically has
been defined as the ability to differentiate and integrate concepts when think-
ing about a topic (Tetlock 1983; Suedfeld 2010). Hence, the introduced mea-
surement through cognitive mapping could be a powerful way to measure the
ability to understand politics in isolation from people’s motivation to do so.
Although following recommendations to enhance the precision of news con-
sumption self-reports (asking concrete frequency and specific outlets; see
Andersen, de Vreese, and Albæk 2016), the unavoidable measurement error in
the independent variable will have caused a downward bias toward the null
hypothesis (Scharkow and Bachl 2017). Arguably, our findings present conser-
vative results and have revealed only a small portion of the true relationship620 Boukes et al.
between exposure to issue-relevant news and cognitive complexity.
Experimental research can overcome the known difficulties of media con-
sumption measurements (Prior 2009) and unreliability in the manual detection
of content features.
Incorporating cognitive mapping in experimental follow-up studies will also
allow for assessing the differential effects of specific content features on cogni-
Downloaded from https://academic.oup.com/poq/article/84/3/599/6133223 by guest on 01 December 2021
tive complexity. For instance, the framing or language complexity of political
news may influence cognitive complexity (Tolochko, Song, and Boomgaarden
2019). Alternatively, modality of news coverage could play a role: Neuman
(1981, p. 1265) already suggested that “vague and shallow” media coverage
could be the source of a generally low level of cognitive complexity. Yet
some media may be better suited to generate complex belief systems than
others (Prior 1985; Sotirovic 2001)—for example, by putting events into per-
spective and relating these to other topics rather than just episodically framing
the news (Iyengar 1991). Additional analyses on our data indeed show that the
interaction effect between education and crisis news exposure is only repli-
cated for newspapers, but not for TV news or (free) online news.4 Printed
news potentially increases complexity due to its more sophisticated nature and
because it allows citizens to consume articles at their own pace (Postman
1986; Robinson and Davis 1990); television may be too superficial and go too
fast to benefit comprehension.
Moreover, the overrepresentation of older respondents could have restricted
the influence of online news, which is particularly effective for younger people
(Eveland, Marton, and Seo 2004). The generation that has grown up with the
internet, however, may be less likely to store information in memory (because
they can always look it up online; Kleinberg and Lau 2019); hence, one may
question how this affects their cognitive complexity. Interestingly, table 3
shows that younger people actually think in more cognitively complex patterns
about the financial crisis. The lack of moderation effects for TV and online
news might also simply be due to less statistical power (i.e., a majority of con-
tent analyzed news was from newspapers; table 1). Experimental designs that
keep content as stable as possible and only manipulate the presentation format
(e.g., Kruikemeier, Lecheler, and Boyer 2017) are needed to verify these
assumptions and disentangle how the demonstrated effects are conditional
upon modality.
Reflecting on the generalizability of our findings, the Netherlands is rather
typical for the northern European region regarding both education and media
landscape: Higher education is relatively accessible to all income categories,
and the country has a popular public broadcaster and strong newspaper market
that set a high standard for other news outlets (Brants and Van Praag 2006).
The impact of issue-relevant news exposure on cognitive complexity could
4. See https://osf.io/5xcrv/?view_only¼2972642f46804a609653589ad9455823.You can also read