Validation of a visual attention test as a predictor of driving accident involvement
←
→
Page content transcription
If your browser does not render page correctly, please read the page content below
Journal of Occupational and Organizational Psychology {\^)9A), 67, 173-182         Printed in Great Britain   173
© 1994 The British Psychological Society

          Validation of a visual attention test as a
         predictor of driving accident involvement

                 Winfred Arthur, Jr,* Mark H. Strong and John Williamson
              Department of Psychology, Texas A&M. University, College of Liberal Arts, College Station,
                                             rX 77843-4235, USA

            A computer-ad ministered test of visual attention was investigated as a predictor of driv-
            ing accident involvement. Three forms ofthe test were administered to three indepen-
            dent samples. The correlation between rest performance and self-reported driving
            accident involvement was significant. Furthermore, the magnitude of this relationship
            was within the upper range of validities typically reported for most selection devices.
            The potential utility of the test and suggestions for future research are discussed.

The objective of this paper is to present preliminary criterion-related validity evidence on
the relationship between a computer-administered test of visual attention and driving
accident involvement. For organizations that employ professional drivers or workers in
positions requiring driving, vehicular accident involvement is an important job perfor-
mance criterion associated with both high financial and high human costs (United States
Department of Transportation, 1990). For instance, according to the Bureau of" Labor
Statistics, transportation accidents account for the largest percentage of work related
deaths in the United States. Of the 6083 fatal occupational injuries occurring in 1992, 32
per cent (1899) involved vehicular accidents (Toscano & Windau, 1993). So in addition
to possibly saving lives, the accurate prediction of driving accident involvement may have
financial benefits for organizations. The benefits of successful driving accident prediction
are not limited to organizations, but extend to society at large (National Safety Council,
1991).
   Although many constructs are relevant to driving behaviour and no single ability
or skill will predict all aspects of driving (Blander, West & French, 1993; Hansen,
 1989), it has been demonstrated that as a category, in format ion-process ing variables,
particularly attention, are valid predictors of driving accident involvement. For instance,
in a meta-analytic study, Arthur, Barrett & Alexander (1991) found that, ofthe several
types of predictors used in driving accident prediction research, auditory selective
attention was the most valid predictor. (See also Arthur & Doverspike, 1992; and Shinar,
 1978, who estimates that 25-50 per cent of driving accidents result from driver in-
attention.)
   Most of the work on attention as a predictor of performance in applied settings has used
a version of a dichotic listening task known as the Auditory Selective Attention Test

 * Requests tor reprints.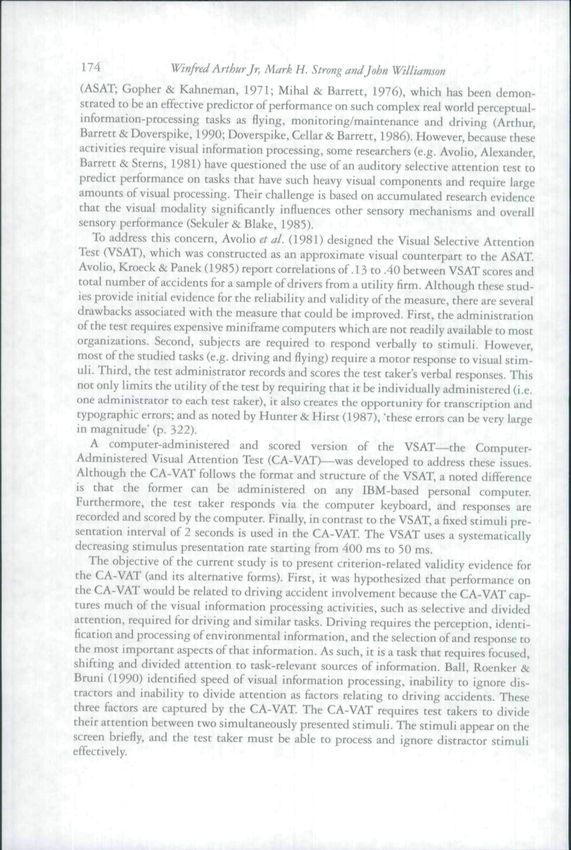
"^infred Arthur Jr, Mark H. Strong and John Williamson
 (ASAT; Gopher & Kahneman, 1971; Mihal & Barrett, 1976), which has been demon-
 strated to be an effective predictor of performance on such complex real world perceptual-
 information-processing tasks as flying, monitoring/maintenance and driving (Arthur,
 Barrett & Doverspike, 1990; Doverspike, Cellar & Barrett, 1986). However, because these
 activities require visual information processing, some researchers (e.g. Avolio, Alexander,
 Barrett & Sterns, 1981) have questioned the use of an auditory selective attention test to
 predict performance on tasks that have such heavy visual components and require large
 amounts of visual processing. Their challenge is based on accumulated research evidence
 that the visual modality significantly influences other sensory mechanisms and overall
 sensory performance (Sekuler ik Blake, 1985).
     To address this concern, Avolio et al. (1981) designed the Visual Selective Attention
  Test (VSAT), which was constructed as an approximate visual counterpart to the ASAT.
  Avolio, Kroeck & Panek (1985) report correlations of .13 to .40 between VSAT scores and
  total number of accidents for a sample of drivers from a utility firm. Although these stud-
  ies provide initial evidence for the reliability and validity ofthe measure, there are several
 drawbacks associated with the measure that could be improved. First, the administration
 ofthe test requires expensive miniframe computers which are not readily available to most
 organizations. Second, subjects are required to respond verbally to stimuli. However,
 most ofthe studied tasks (e.g. driving and flying) require a motor response to visual stim-
 uli. Third, the test administrator records and scores the test taker's verbal responses. This
 not only limits the utility ofthe test by requiring that it be individually administered (i.e.
 one administrator to each test taker), it also creates the opportunity for transcription and
 typographic errors; and as nored by Hunter & Hirst (1987), 'these errors can be very large
 in magnitude' (p. 322).
     A computer-administered and scored version of the VSAT—the Computer-
 Administered Visual Attention Test (CA-VAT)—was developed to address these issues.
 Although the CA-VAT follows the format and structure of the VSAT, a noted difference
 is that the former can be administered on any IBM-based personal computer.
 Furthermore, the test taker responds via the computer keyboard, and responses are
 recorded and scored by the computer. Finally, in contrast to the VSAT, a fixed stimuli pre-
sentation interval of 2 seconds is used in the CA-VAT. The VSAT uses a systematically
decreasing stimulus presentation rate starting from 400 ms to 50 ms.
    The objective of the current study is to present criterion-relaced validity evidence for
the CA-VAT (and its alternative forms). First, it was hypothesized that performance on
the CA-VAT would be related to driving accident involvement because the CA-VAT cap-
tures much ofthe visual information processing activities, such as selective and divided
attention, required for driving and similar tasks. Driving requires the perception, identi-
fication and processing of environmental information, and the selection of and response to
the most important aspects of that information. As such, it is a task that requires focused,
shifting and divided attention to task-relevant sources of information. Ball, Roenker &
Bruni (1990) identified speed of visual information processing, inability to ignore dis-
tractors and inability to divide attention as factors relating to driving accidents. These
three factors are captured by the CA-VAT. The CA-VAT requires test takers to divide
their attention between two simultaneously presented stimuli. The stimuli appear on the
screen briefly, and the test taker must be able to process and ignore distractor stimuli
effectively.
Attentionldriving accident involvement                                       175
   Second, consistent with past research (e.g. Arthur & Doverspike, 1992), it was hypoth-
esized that the CA-VAT would predict both at-fault and not-at-fauk accidents. From an
attention perspective, the perceptual information that is processed is not limited to
traffic lights, signs and pedestrians but also includes other vehicles. Thus, processing and
responding to the actions of other drivers is essential. Consequently, even if a driver is not
legally at-fault, how appropriately the individual processes and responds to the actiotis of
others can play a role in accident involvement.
    Finally, in addition to being predictive of driving accident involvement, it was also
expected that the magnitude of these correlations would be comparable to those reported
for the VSAT and ASAT in past research. Three independent groups of subjects were each
administered an alternate form of the CA-VAT. They also completed the ASAT, a self-
report measure of driving accident involvement (Arthur, 1991; Arthut & Doverspike,
1992), and the Computer Attitude Scale (Dambrot, Watkins-Malek, Silling, Marshall &
Garver, 1985).

                                                   Met bod

Subjects
Subjects were volunteers from a large southwestern university. There were a total of 324 subjects, 141 (44 per
cent) of whom were female. The mean age for the total sample was 19.02 years (SD = 1.32). Subjects were
not altowed to participate in the study if they reported visual impairments or if they did not have a valid
driver's licence. The mean number of years the study participants had been driving was 3.56 years
( S D = 1.57).

Meastires
Cumputer^Administemi Visual Attention Test (CA-VAT). The CA-VAT (Arthur, 1991; Arthur, Strong, Jordan,
Williamson, Shebilske & Re^ian, in press) is an IBM-based PC administered and scored test of visual atten-
tion. The general design ofthe test, constructed as an approximate visual counterpart to the ASAT (Gopher
& Kahneman, 1971; Mihal & Barrett, 1976) is based on protocol developed for the VSAT by AvoUo H al.
(19H1). The stimuli in the CA-VAT are pairs of numbers and letters that appear on a computer monitor. The
numbers range from 1-9 and the letters, with rhe exclusion of'S' and 'O', make up the complete alphabet.
The characters are 3 X 9 mm in size. A given pair of characters consists of either two numbers, a number and
a letter, or two ietrers. Each character making up the stimulus pair is presented at 62 mm on either side of
the screen's centre point. An illustration of a stimulus screen is presented in Fig. 1.
    The CA-VAT consists of 24 test messages (items) of two parts each. (A shorter alternate form of the CA-
VAT was also used in the present study. This form is identical to the long form except that it is only halt as
long; It consists of the last 12 messages of the long form.) The first pare of each message consists of 16 stim-
ulus pairs. For 12 of the test messages, the second part consists of three stimulus pairs. The other 12 messages
have five stimulus pairs in the second part. The subject's task is to respond to the pairs via the computer key-
board. Cue words indicate what the appropriate response should be for each part of the message. At the begin-
ning of each message, the message number is presented and then erased. After a 2 s interval, the relevant cue
word for the first part is presented on the screen for 2 s. The stimulus pairs are next presented at 2 s intervals;
 if a subject does not respond within this interval, the next stimulus pait is ptesented. After the first part, the
cue word for the second part is presented for 2 s. Subsequently, the stimulus pairs for the second part are then
presented. Eleven ofthe 24 messages have different cues for each part. This sequencing was used to be con-
sistent with the VSAT.
   Consistency with the VSAT also motivated the choice of cue words 'coffee' and "apple'. The ctie word
•coffee' indicates that subjects are to respond with the left-arrow key to all o^t/numbers in the/«//channel and
with the right-arrow key to all ei'en numbers in the right channel. The word 'apple' indicates that subjects are
176                  Winfred Arthur Jr. Mark H. Strong and John Williamson

                      Figure 1. Illustration of CA-VAT stimulus screen and apparatus.

to respond with the left-arrow key to ei'eri numbers in the kfl channel and wich the right-arrow key to ftdW
numbers in the rtj^hl thannel. Letters never satisfy the conditions indicated by the cues.
   The cue words also change how subjects use the up- and down-arrows. The up-arrow indicates that both
response contingencies are met; the down-arrow indicates that neither contingency is met. For example, if the
cue word is coffee', subjects are to strike the up-arrow key when an odd numl->er appears in the left channel
and an even number appears in the righr channel. Subjects are to strike tht- down-arrow when the character
in the left channel is not an odd number and when the character in che right channel is not an even number.
A subject's score is the numlier of errors made.
   Avolio el d/. (1981) re|x.rt convergent validity for the VSAT und ASAT (r ^ .42) and the Gmup Embedded
Figures Test (r = .36)—both commonly used measures of information-processing ability. Avolio e/^/. (19SI)
also report a VSAT internal consistency of .85. The coefficient alphas obtained for the CA-VAT in the current
study ranged from .93 to .9H. A test-retest reliability of .83 has also been reported for the CA-VAT (Strong,
1992). A CA-VAT/perceptual speed correlation of - . 0 3 , and CA-VAT/general cognitive correlations of .32
to .37 have been reported (Arthur. 1991).
                                                                              I

Driving Behaviour Q/mtiomaire. Subjects completed a driving behaviour questionnaire (Arthur, 1991; Arthur
& Doverspike, 1992). In completing the questionnaire, subjects re[X)rted the total number of accidents they
had been involved in as one of the drivers, the number for which they were at fault, and the total number of
years they had been driving legally. An accident was defined as any driving or traffic accident In which the
subject was involved as one of the drivers, and in which a person had suffered physical injury (including fatal-
ities) and/or there was $ 150 or more damage to property. An af-fault accident was one in which the police had
determined that the subject was at fault. Test-retest reliabilities ranging from .96 to .98 have been reported
for the Driving Behaviour Questionnaire (Arthur. 1991, 1993).
Attentionl driving accident involvement                                    177
Computer Attitude Scale (CATF). This is a 20-item instrument that measures the respondent's attitudes
towards computers. Because of the administration and responding format of the CA-VAT, the CATT
{Dambrot et al., 1985) was administered to assess the effect of computer attitudes on the CA-VAT. Internal
consistencies of ,84, .79 and .73 have been reported for the CATT (Arthur & Olson, 1991; Dambrot et al.,
1985),

Auditory Selective Attention Test (ASAT). In the ASAT (Gopher & Kahneman, 1971; Miha! & Barrett, 1976),
24 dichotic messages are presented simultaneously to subjects via stereo headphones. Each message consists
of a pair ofeither single letters or digits ranging from ()-9, The subject's task is to report all digits presented
in the cued eat. The score on the ASAT is the total number of errors. A test-retest reliability ot ,71 for the
ASAT has been reported (Doverspike et al., 1986).

Procedtire
Initial development and pilot dara indicated that subjects required considerable practice with the CA-VAT
before they were familiar with the instructions and required keystroke responses. The, amount of practice
requirt'd consequently resulted in lengthy administration times. So in an attempt to identity an acceptable
trade-off between administration time and amount of practice in the current study, three forms of the CA-
VAT were administered ro thrt-e independent groups of subjects such that each group took one form of the
CA-VAT. Tlie forms differed on three dimensions: the amount of practice, the length of time between prac-
tice and test sessions, and the length ofthe test.
   In Form A, 111 subjects completed the long (24-message) CA-VAT, once as a practice session and seven
days later as a test session. In Form B, 105 subjects also completed the long CA-VAT, but with a lO-minute
break between practice and test sessions. Finally, in Form C, 108 subjects completed a short alternate torm of
the CA-VAT. In this form, the practice session cotisisted of rhe first 12 messages of the long CA-VAT, and the
test session consisted of the last 12 messages. As with Form B, practice and test sessions were separated by a
10-minute interval.
   Subjects who t w k the CA-VAT I'orm C were also administered the ASAT. A reverse counter-balanced
administration order was used to control for potential order effects. For half the subjects, the CA-VAT was
administered before the ASAT; the order was reversed for the other half, f-tests failed to display any order
effects so the two groups were combined for subsequent analyses.
   Testing was conducted individually with subjects seated at an IBM AT (80286) tompiitible computer run-
ning at 12 MHz with a 101-keyboard. All subjects completed the CATT and the driving behaviour ques-
tionnaire before their CA-VAT practice session. Subjects also completed tout practice messages before starting
the test session of each form. Test instructions and sample messages were presented via the computer. In addi-
tion to this, subjects were encouraged to ask questions and seek clarifications if the computer-presented
 instructions were not understood. It should be noted that data presented in the Results are based on test ses-
sion scores only.

                                                    Results
Descriptive statistics for the study variables are presented in Table 1. Internal consisten-
cies for the CA-VAT along with its correlations with the other study variables are pre-
sented in Table 2. The CA-VAT displayed a fairly high and stable level of internal
consistency, ranging from .93 to .98. The lowest a was obtained for Form C, which had
half as many messages as the other forms. Correcting for the effect of halving the test
resulted in an internal consistency of .96—a value comparable with the other forms.
    The data presented in Table 2 also indicate that all three forms of the CA-VAT were
significantly correlated with accident involvement (for total accidents, r = .38, .28 and
. 2 6 , / ' < .01, for Forms A, B and C respectively). Sample-weighted mean validities aggte-
gated across the CA-VAT forms provided further support for this finding. Additionally,
the correlations between the three forms and driving accidents were not significantly dif-
ferent from each other. An examination ofthe accident data indicated that along with a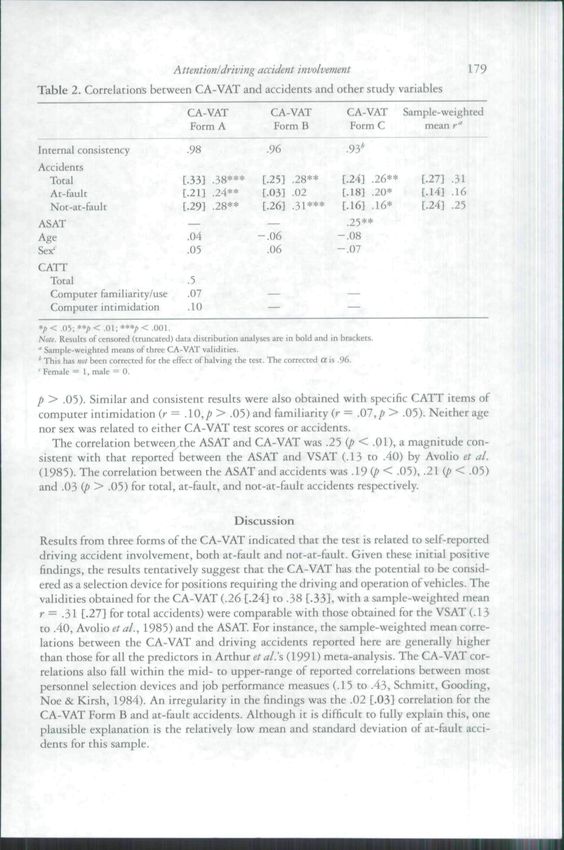
178                   Winfred Arthur Jr, Mark H. Strong and John Williamson
Table 1. Means, standard deviations and minimum and maximum values for study
variables
Measures                      N              Mean              SD      Min        Max
CA-VAT Form A                HI             57.41             53.15    9.00     339.00
                                   •' t
Accidents                                             1   •

  Total                                       0.92             1.13    0.00        5.00
  At-fault                                    0.41             1.72    0.00        3.00
  Not-at-ftiult                               0.51             0.86    0.00        3.00
CATT                                        67.42              6.48   50.00       83.00
Age                                         18.99              1.22   18.00       26.00
CA-VAT Form B                105            56.52             46.42    5.00     310.00
Accidents
  Total                                       0.89             0.95    0.00        4.00
  At-fault                                    0.37             0.65    0.00        3.00
  Not-at-fault                                0.51             0.83    0.00        3.00
ASAT                                        38.37             16.95   10.00      87.00
Age                                         19.19              1.61   17.00      30.00
CA-VAT Form C                108            31.61             27.66    2.00     156.00
Accidents
  Total                                      0.82             0.96     0.00       5.00
  At-fault                                   0.50             0.79     0.00       4.00
  Not-at-fault                               0.32             0.59     0.00       2.00
Age                                         18.88              1.09   17.00      24.00
Total sample                 324
Accidents
  Total                                      0.88             1.00    0.00        5.00
  At-fault                                   0.43             0.72    0.00        4.00
  Not-at-fault                               0.45             0.78    0.00        .100
Age                                         19.02              1.32   17.00      3O.(){)
" Form C has half the number of messages as Forms A and B

low base-rate (mode — 0), it was also censored (truncated). Censored variables have a high
concentration of cases at the lower or upper end of the distribution (Joreskog & Sorbom,
 1988; SPSS Inc., 1990) and this non-normality of the accident data is potentially prob-
lematic with correlation coefficients (McGuire, 1973). To correct for this problem, the
preceding analyses were repeated using a PRELIS procedure designed specifically for
truncated data distributions (Joreskog & Sorbom, 1988; SPSS Inc., 1990). Although
slightly lower, the results were essentially similar co those obtained for the Pearson rs and
are also presented in Table 2.
   Because of the administration format of che CA-VAT, there had been some concern that
computer attitudes might influence performance on the test. This was not supported by
the results. The correlation between the CA-VAT and CATT was not significant (r = .05,
Attention/driving accident involvement                                      179
Table 2. Correlations between CA-VAT and accidents and other study variables
                                         CA-VAT                 CA-VAT               CA-VAT       Sample-weighted
                                         Form A                 Form B               Form C          mean r"

Internal consistency                     .98                   .96                   .93*
Accidents
  Total                                 [.33] 58***          [.25} .28**            [.24] .26**      [.27] .31
  At-fauk                               [.21] 24**           [.03] .02              [.18] .20*       [.14] .16
  Not-at-fault                          [.29] .28**          [.26] .31***           [.16] .16*       1.24] .25
ASAT                                      —.                  —                      ,25**
Age                                      .04                -.06                   -.08
Sex'                                     .05                   .06                 -.07
CATT
  Total                                  .5
  Computer familiarity/use               .07                   —                     —
  Computer intimidation                  .10                   —                     —
*p < .05;**/'*^ Ot; ***/> < -001.
Note. Resultsof censored (truncated) data distributidii analyses are in bold and in brackets.
•' Sam pie-weigh ted means of three CA-VAT validities.
* Tliis lias mil been torrected for the effect of halving the test. The corrected a is .96.
• Female = 1, male = 0.
                                                                            y

p > .05). Similar and consistent results were also obtained with specific CATT items of
computer intimidation (r = .\X),p > .05) and familiarity (r — .07,p > .05). Neither age
nor sex was related to either CA-VAT test scores or accidents.
   The correlation between the ASAT and CA-VAT was .25 (p < .01), a magnitude con-
sistent with that reported between the ASAT and VSAT (.13 to .40) by Avolio et ai.
(1985). The correlation between the ASAT and accidents was.19 ( / ' < .05), .21 (p < .05)
and .03 (p > .05) for total, at-fault, and not-at-fauit accidents respectively.

                                                      Discussion
Results from three forms ofthe CA-VAT indicated that the test is related to self-reported
driving accident involvement, both at-fault and not-at-fault. Given these initial positive
findings, the results tentatively suggest that the CA-VAT has the potential to be consid-
ered as a selection device for positions requiring the driving and operation of vehicles. The
validities obtained for the CA-VAT (.26 [.24] to .38 [.33], with a sample-weighted mean
r= .31 [-27] for total accidents) were comparable with those obtained for the VSAT (.13
to .40, Avolio et al., 1985) and the ASAT. For instance, the sample-weighted mean corre-
lations between the CA-VAT and driving accidents reported here are generally higher
than those for all the predictors in Arthur c/^^/.'s (1991) meta-analysis. The CA-VAT cor-
relations also fall within the mid- to upper-range of reported correlations between most
personnel selection devices and job performance measues (.15 to .43, Schmitt, Gooding,
Noe & Kirsh, 1984). An irregularity in the findings was the .02 [.03] correlation for the
CA-VAT Form B and at-fault accidents. Although it is difficult to fully explain this, one
plausible explanation is the relatively low mean and standard deviation of at-feult acci-
dents for this sample.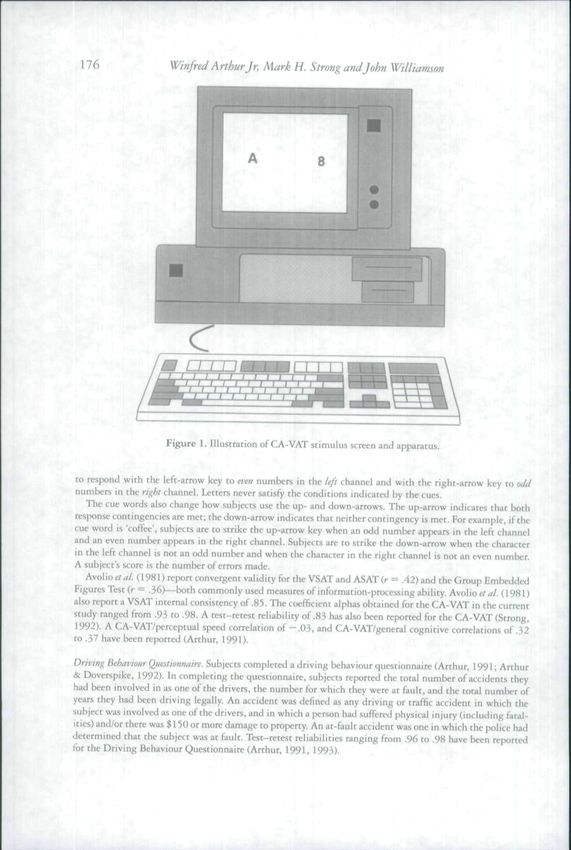
Winfred ArthurJr, Mark H. Strong andJohn Williamson
    However, in general, che results ofthe present study are a promising demonstration of
 the criterion-related validity of a computer-administered test of visual attention. In addi-
 tion to its psychometric properties, the administrative characteristics of the CA-VAT
 enhance its viability as a potential selection tool. The widespread availability of i->ersonal
 computers and the advantages and increasing use of compucer-ad mini ste red testing (Vale,
 1990; Wise & Plake, 1990) make the CA-VAT suitable for most research and applied
settings.
    In order to learn what a test actually measures, it is necessary to carry out a series of val-
 idation studies (Dunnette, 1992). 'Validation refers broadly to the process of learning
 more about the meaning or total network of interpretations that may be attached to an
 individual difference measure. Test validation is never ending, because each new research
study may provide some new information about relationships between test behaviors and
nontest behaviors" (Dunnette, 1992, p. 158). As such, the present research must be viewed
as a preliminary demonstration of the CA-VAT's validity from which future hypotheses
for future studies can be formulated. Our results, therefore, encourage future research.
    Along these lines, there are potential limitations ofthe current study to be considered
in future investigative efforts. First, the samples used may limit the generalizability ofthe
findings. The current sample was young, and although young drivers (persons under the
age of 25) are disproportionately involved in driving accidents (Butler, 1982), they had
been driving tor a relatively short period of time, and consisted of non-professional
drivers. Future research could attempt to replicate these findings with a wider age range
of subjects and also wirh professional drivers. These studies might also use predictive
instead of concurrent or postdictive designs (see Arthur & Doverspike, 1992).
    A second limitation is the use of self-report accounts of driving accident involvement.
Asking drivers to report the accidents in which they have been involved opens up the pos-
sibility of misrepresentations, either intentional or otherwise. Nevertheless, self-reports
are the most commonly used criterion in driving accident involvement research (Ball &
Owsley, 1991) because unlike "objective" archival data, they have the major advantage of
being able to canvas all accidents (Elander^/rf/., 1993)- State records may underreport the
number of actual accidents because the parties involved choose not to report the accident,
the accident occurred in a different state, or the accident was judged by the police not to
be serious enough to report (McGuire, 1973; Smith, 1976). In addition, IIHS (1991)
found that only 40 per cent of vehicle accidents that should have been available to auto
insurers appeared on publicly available records. Lastly, mechanical and other non-
behavioural factors, such as the car engine catching fire, are often coded as accidents in
archival records.
    Elander et al.'s (1993) review also suggests that self-report data can be just as good as
objective/archival criteria and have served effectively as criterion measures in driving acci-
dent research. This conclusion is consistent with Arthur e^rf/. 5(1991) failure to find self-
report data as a consistent moderator ofthe relationship between specified predictors and
driving accident involvement, in spite of this, future research using a combination of both
objective and self-report data may provide the most accurate account of driving accident
involvement.
    To summarize, this paper provides initial criterion-related validity evidence on the
relationship between the CA-VAT and driving accident involvement. Furthermore, the
CA-VAT has also been demonstrated to predict performance on a dynamic flight simula-
Attention/driving accident involvement 181
tion task (Arthur e/i«/., in press) both before and after training. This suggests that the CA-
VAT could potentially be a valid predictor of other complex psychomotor tasks that span
across several job types. Future research needs to assess this potential and improvements
in the test for both applied and research settings.
References
Arthur, W., Jr. (1991). Individual Differences In rhe Predicrion and Training of Complex Perceptual-Motor
Skill Tiisks: The Development and Validation oFthe Computer-Administered Visual Attention Test. Teth.
Report No. 8. College Station, TX: Texas A&M University, Psychology Department.
Arthur, W., Jr. (199.^). Relationships among the big five personality dimensions and driving accident
involvement. Manuscript submitted for publication.
Arthur, W., Jr., Barrett, G. V. & Alexander, R. A. (1991). Prediction of vehicular accident involvement: A
meta-analysis. Human PerforiiMnce. 4, 89-105.
Arthur, W., Jr., Barrett, G. V. & Doverspike, D. (1990). Validation ofan information-process ing-based test
battery for the prediction of handling accidents among petroleum transport drivers. Journal of Applied
PsyiMo/ry. 7^,621-628.
Arthur, W.. Jr. &. Doverspike, D. (1992). Locus of control and auditory selective attention as predictors oi
driving accident involvement: A comparative longitudinal investigation. Joumal of Safely Research, 23,
73-80.
Arthur, W., Jr. & Olson, E. (1991). Computer attitudes, computer experience, and their correlates: An inves-
tigation of path linkages. Teachinji of Psycholof^y. 18, 51-54.
Arthur, W., Jr., Strong, M. H,, Jordan, J., Williamson. J.,Shebilske,W. & Regian,W. (in press). Visual atten-
tion: Individual differences in training and predicting complex task performance. Aita Psyihologica.
Avolio, B. J., Alexander, R. A., Barrett, G. V & Sterns, H. L. (1981). Designing a measure of visual selective
attention to assess individual differences in informatioti processing. Applied Psychological Measurement. 5,
29-42.
Avolio, B. J., Kroeck, K. G. & Panek, R E. (1985). Individual differences in information-processing ability
as a predictor of motor vehicle accidents. Human Factors, 27, 577-588.
Ball, K. & Owsley, C. (1991). Identifying correlates of accident involvement for the older driver. Hiima?i
Factors. 33. 583-595.
Ball, K., Roenker, D. & Bruni, J. (1990). Developmental changes in attention and visual searcfi throughout
adulthood. In J. Enns (Ed.), Advamts in Psychology. 69, 489-508.
Butler, G. T. (1982). Effectiveness and Efficiency in Driver Education Programs: Evaluation Summary Report
1966-81. Traffic Safety Programs. Washington, DC: US Department of Transportation, National
Highway Traffic Safety Administration.
Dambrot, R H., Watkins-Malek, M, A.. Silling. M. S,, Marshall, R. S. & Garver, J. A. (1985). Correlates of
sex differences in attitudes toward involven:ient with computers._/o»m(*/ of Vocational Behavior, 27, 71—86.
Doverspike, D., Cellar, D. & Barrett, G. V. (1986). The Auditory Selective Attention Test: A review of field
and laboratory studies. Education and Psychological Measurement, 46, 1095-1103.
Dunnette, M. D. (1992). It was nice to be there: Construct validity then and now. Human Performance, 5,
157-169.
Elander, J., West, R. & French, D. (1983). Behavioral correlates of individual differences in road-traffic crash
risk: An examination of methods and findings. Psychological Bulletin. 113, 279-294.
Gopher, D. & Kahneman, D. (1971). Individual differences in attention and the prediction of flight criteria.
Perceptual and Motor Skill, 33, 1335-1342.
Hansen, C, P. (1989). A causal model ofthe relationship among accidents, biodata, personality, and cognitive
^•Actor^.Jourtul of Applied Psychology. 14, 81-90.
Hunter, J. E. & Hirsh. H. R. (1987). Applications of meta-analysis. In C. L. C(x>per& I. T. Robertson (Eds).
International Review of Industrial and Organizational Psychology 1987. London: John Wiley.
Insurance Institute of Highway Safety (1991). Status Report. 26, 1-10.
Joreskog. K. G. & Sorbom, D. (1988). PRELIS: A Preprocessor for LISREL, 2nd ed. Mooresville, IN: Scietitific
Software.182 Winfred Arthur Jr. Mark H. Strong andJohn Williamson
McGuire, F. L, (1973). The nature of bias in official accidetit and violation records. Joumal of Applied
Psychology. 57, 500-305.
Mihal, W, Si Barrett, G. V. (1976), Individual differences in perceptual information processing and their rela-
tioti to automobile accident invoWement. Journal of Applied P.sythology. 6 1 , 229-233,
National Safety Council (1991). Accident Facts, 1991 Edition. Chicago, IL: Author.
Schmitt, N,, Gooding, R. Z,, Noe, R. A. & Kirsh, M. (1984). Meta analyses of validity studies published
between t96'1 and 1982 and the investigation of study characteristics. Personnel Psychology. 37, 407-422.
Sekuler, R. & Blake, R, (1985), Perception. New York; Alfred A. Ktiopf,
Shinar, D, (1978), Driver Performance and individual Differences in Attention and Information Processing:
Volume 1. Driver Attention, (Tech, Report DOT HS 8-HOI819.) Washington, DC: US Department of
Transportation, National Highway Traffic Safety Administration.
Smith, D. I, (1976). Official driver records and self reports as sources of accident and conviction data for
research purposes. Accident Analysis and Prevention. 8, 207—211.
SPSS Inc. (1990), SPSS LISREL 7 and PRELIS User's Guide and References. Chicago, IL: Author,
Strong, M. H. (1992). An assessment of the criterion-related validity and improvements in the utility ofthe
Computer Administered Visual Selective Attention Test, Unpublished Masters thesis, Texas A&M
University.
Toscano, G. & Windau, J. (1993). Fatal work injuries: Results from the 1992 national census. Monthly Lahttr
Review {October). 39-48.
United States Department of Transportation (1990). Accidents of Motor Carriers of Property J988 (Publication
No. FHWA/MC-90/0i8). Washington, DC: US Government Printing Office.
Vale, C. D. (1990). The Minnesota Clerical Assessment Battery: An application of computerized testing to
business. Measurenieni and Evaluation in Counseling and Deivlopmtnt. 23. 11—19.
Wise, S, L, & Plake, B, S, (1990). Computer-based testing in higher education. Measurement and Evaluation in
Counseling ami Det'elopmenr. 23, 3-10,
' Received 10 D&xmber 1992; revised version received 7 December 1993You can also read