Validity and reliability of the 'Isometric Exercise Scale' (IES) for measuring ratings of perceived exertion during continuous isometric exercise
←
→
Page content transcription
If your browser does not render page correctly, please read the page content below
www.nature.com/scientificreports
OPEN Validity and reliability
of the ‘Isometric Exercise
Scale’ (IES) for measuring
ratings of perceived exertion
during continuous isometric
exercise
John W. D. Lea, Jamie M. O’Driscoll, Damian A. Coleman & Jonathan D. Wiles*
Isometric exercise (IE) interventions are an effective non-medical method of reducing arterial blood
pressure (BP). Current methods of prescribing and controlling isometric exercise intensity often
require the use of expensive equipment and specialist knowledge. However, ratings of perceived
exertion (RPE) may provide a more accessible means of monitoring exercise intensity. Therefore,
the aim of this study was to assess the validity of a specific Isometric Exercise Scale (IES) during a
continuous incremental IE test. Twenty-nine male participants completed four incremental isometric
wall squat tests. Each test consisted of five 2-min stages of progressively increasing workload.
Workload was determined by knee joint angle from 135° to 95°. The tests were continuous with no
rest periods between the stages. Throughout the exercise protocol, RPE (IES and Borg’s CR-10), heart
rate and blood pressure were recorded. A strong positive linear relationship was found between the
IES and the CR-10 (r = 0.967). Likewise, strong positive relationships between the IES and wall squat
duration (r = 0.849), HR (r = 0.819) and BP (r = 0.841) were seen. Intra-class correlation coefficients
and coefficients of variations for the IES ranged from r = 0.81 to 0.91 and 4.5–54%, respectively, with
greater reliability seen at the higher workloads. The IES provides valid and reliable measurements
of RPE, exercise intensity, and the changes in physiological measures of exertion during continuous
incremental IE; as such, the IES can be used as an accessible measure of exercise intensity during IE
interventions.
Abbreviations
ANOVA Analysis of variance
BP Blood pressure
DBP Diastolic blood pressure
EMG Electromyography
HR Heart rate
IE Isometric exercise
IES Isometric Exercise Scale
IET Isometric exercise training
MAP Mean arterial pressure
RPE Rating of perceived exertion
SBP Systolic blood pressure
Hypertension, characterised by a sustained elevation in arterial blood pressure (≥ 140 mmHg systolic and/or
≥ 90 mmHg diastolic), is the leading attributable risk factor for increased CVD mortality1. Exercise has been
School of Human and Life Sciences, Canterbury Christ Church University, Kent, UK. *email: Jim.Wiles@canterbury.
ac.uk
Scientific Reports | (2021) 11:5334 | https://doi.org/10.1038/s41598-021-84803-8 1
Vol.:(0123456789)www.nature.com/scientificreports/
recommended as a non-pharmacological lifestyle modification for the treatment of hypertension2. Isometric
exercise training (IET) interventions have been shown to be an effective and time efficient methodology to reduce
resting3–6 and ambulatory blood p ressure6.
The control of exercise intensity is a key factor in ensuring the safety and efficacy of physical activity in any
context, including athletic, recreational, and therapeutic settings7,8. Previous methods of administering IET and
monitoring its intensity have tended to require expensive equipment such as isokinetic dynamometers3,9,10, hand
grip dynamometers11 and electromyography (EMG)5. It has been suggested that the need for expensive equip-
ment and time-consuming testing protocols, may present unnecessary barriers that could ultimately limit the
effectiveness of these interventions12. Consequently, more accessible modes of IET that could be implemented
in the home have been explored. One such intervention, is the use of the isometric wall squat, where intensity
is controlled by manipulation of the knee joint a ngle13. A 4-week home based isometric wall squat intervention,
with exercise intensity derived from a maximal isometric wall squat t est6,14, was shown to produce significant
reductions in resting6,15 and ambulatory arterial BP6. While these methods of training are more accessible than
previous iterations, the ability to accurately monitor exercise intensity without laboratory testing and the use of
additional equipment could help to further promote uptake of this type of IE intervention.
Ratings of perceived exertion (RPE) could provide an easy to use and accessible alternative means of assessing
and monitoring exercise intensity16,17. Indeed, it has long been established that RPE provides an accurate estima-
tion of exercise intensity and physiological exertion during cardiovascular exercise18. In addition, there is now
a growing body of evidence that indicates that various RPE scales provide a valid measure of exercise intensity
during resistance exercise, including the Borg 6-2019, Omni-res20, and the Borg CR-1021 scales. The validity of
these scales has been shown to be independent of participant a ge22,23 or s ex21,24,25. Additionally, the Borg CR-10
scale has largely been adopted within IE research up to this this point14, despite its intended application being for
rating pain with no numerical ceiling e ffect26. In an exercise setting, where the average participant’s understanding
of RPE is likely to be limited, the open-ended nature of the CR-10 scale may make monitoring and prescribing
IE intensity more difficult. There are currently no RPE scales that have been specifically designed and validated
for IET; it has been suggested that it is important to design and validate scales for specific populations, exercise
types and m odalities16, and that caution should be taken when using RPE scales with modalities and materials
other than those they have been validated for27. It has also been proposed that for an RPE scale to be considered
a valid measure for use in the clinical and/or health-fitness setting, it must demonstrate both concurrent and
construct validity, evidenced by strong positive correlations with physiological variables (e.g. HR) and a previ-
ously validated criterion scale r espectively28.
Therefore, the aims of this research were to: (1) assess the construct validity of a new isometric exercise scale
(IES) as a measure of RPE during isometric wall squat exercise, using the frequently adopted CR-10 scale as a
criterion measure; (2) examine the validity of the IES to measure changes in isometric wall squat intensity during
a continuous maximal incremental test; (3) explore the concurrent validity of the IES using criterion measures
of physiological exertion (HR and BP); and (4) examine the reliability of the IES responses over time.
Methods
Participants. Twenty-nine normotensive male volunteers (age: 23.2 ± 4.0 years; stature: 180.9 ± 7.8 cm; body
mass: 82.7 ± 17.3 kg) participated in this research. All participants were physically active, non-smokers and not
taking any medication that could affect the study results. Furthermore, participants self-reported that they were
not suffering from any injury or disease. Written informed consent was given by all participants and they agreed
to maintain their regular exercise and dietary habits between testing sessions and for the length of study.
Study design. All participants were required to attend the laboratory on four separate occasions, separated
by a minimum of 48 h. Each session followed the same procedures; starting with resting measurements before
completion of a continuous maximal incremental wall squat tests. Participants were asked to abstain from food
4 h, caffeine 12 h, alcohol and strenuous exercise 24 h pre-testing. All participants verbally confirmed adherence
to the testing requirements prior to the start of each testing session. This study was approved by Canterbury
Christ Church University’s Ethics Committee (15/SAS/223) and conducted according to the 1964 Declaration
of Helsinki.
Procedures. Familiarisation. Prior to the first testing session participants received an information pack
outlining the testing protocols and measurement procedures included in the study. At the start of the first labo-
ratory session participants had the study design, resting and exercise measurements, and exercise protocols
explained to them verbally. As part of this explanation, participants were shown the equipment that would be
used and were given a demonstration of the wall squat, including the correct wall squat position. Finally, par-
ticipants were shown the RPE scales and received the standardised instructions and anchoring. Following this, if
the participant wished to be part of the study, written informed consent was collected and resting measurements
were taken.
Resting measures. Upon arrival to the laboratory, participants rested in a seated position for 10 min. After
10 min rest, HR, systolic BP (SBP), diastolic BP (DBP) and mean arterial pressure (MAP) were recorded using an
oscillometric BP monitor on the participants left arm (Dinamap® Pro, GEMedical Systems, Slough, UK). Three
measurements were taken, each separated by 1-min29. Following the seated measurements, participants rested in
a supine position for 15 min. After an initial 10-min period, HR and BP were measured continuously for 5 min
using a plethysmographic device (Task Force® Monitor, CNSystems, Graz, Austria). Resting HR and BP values
were calculated as the mean of the 5-min supine measurement period.
Scientific Reports | (2021) 11:5334 | https://doi.org/10.1038/s41598-021-84803-8 2
Vol:.(1234567890)www.nature.com/scientificreports/
Figure 1. Knee joint angles used for the five consecutive 2-min stages of the incremental isometric exercise test
(left to right: 135°, 125°, 115°, 105°, and 95°).
Maximal isometric wall squat test protocol. Following the resting measures, participants were required to com-
plete a maximal incremental isometric wall squat test, as described in13. The test required participants to lower
their back down a fixed wall and make small adjustments to their feet position until the required knee joint
angle was reached, while maintaining a vertical lower limb and an erect trunk. Knee joint angle was measured
using a clinical goniometer, secured to the participants lower and upper leg using elasticated Velcro strapping.
The fulcrum was aligned with the lateral epicondyle of the femur, the moving arm was placed on the lateral mid-
line of the femur using the greater trochanter for reference and the stationary arm on the lateral midline of the
fibula using the lateral malleolus and fibular head for reference. A spirit level was attached to the stationary arm
to ensure that the lower leg was kept vertical during exercise. The internal angle between the femur and fibula
was measured13. The test consisted of five consecutive 2-min stages, beginning at a knee joint angle of 135° and
guided to reduce the angle by 10° every 2 min (125°, 115°, 105°, and 95°) (Fig. 1). Each participant’s foot position
was measured from the back of the left heel to the wall and their back position was measured as the distance
from the ground to the lower back, which was defined as the lowest point of contact that the participants back
had with the wall. Participants were not permitted to stand or rest between angles. The test continued until voli-
tional exhaustion, the participant was unable to maintain the required knee angle, or completion of the 10-min
test8. Participants were monitored were monitored for signs of physical distress throughout the test and were
instructed to terminate the exercise at the first signs of dizziness or feeling unwell. Verbal encouragement was
given throughout, with instructions to maintain normal breathing to avoid the Valsalva manoeuvre. Heart rate
and BP were recorded continuously during the test; mean HR and BP (SBP, DBP and MAP) were calculated for
the last 5 s of each minute of the test.
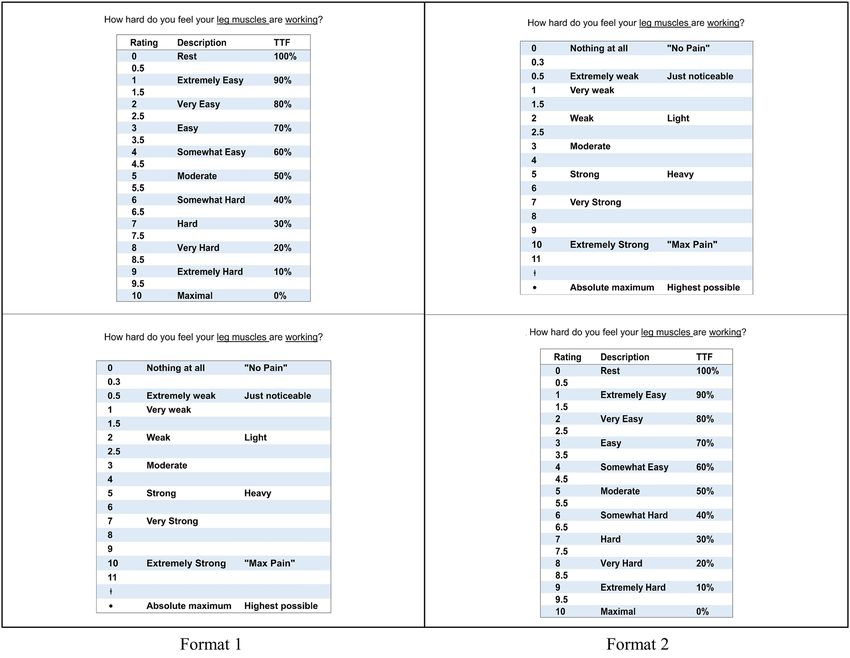
Ratings of perceived exertion. Participants were asked to rate the perceived exertion in their active muscles
using the IES and Borg’s CR-10 scales, 50 s into each minute of the test. Participants were cued to give their rat-
ings using the standardised questions: “How hard do you feel your leg muscles are working”. The participants
were randomly assigned into one of two groups: Group 1 were asked to rate their perceived exertion using the
IES first followed by the CR-10; group 2 rated using the CR-10 first and then the IES. The scales were in full view
of the participant for the entire test, presented one above the other, either IES on top or CR-10 on top (Fig. 2)
depending on group allocation. The scales were presented in this way, rather than side-to-side, to stop partici-
pants picking a rating on the first scale and then moving sideways to the corresponding value on the second
scale, without consideration of differences in the two values.
Scale instructions and anchoring. Standardised scaling instructions and anchoring procedures were explained
for both scales before testing. The standardised instructions and anchoring procedures for the CR-10 scale were
used, as previously published in Borg’s work26. The instructions for the IES were as follows: “This scale is used to
rate how hard you think your active muscles are working. This scale has 3 different columns: Rating, Description
and TTF. The ‘Rating’ numbers are from 0–10 and are used to rate the exertion or effort in the active muscle
group(s). The ‘Description’ words and ’TTF’ are used to help you choose a rating. 0 (Rest) is absolutely no effort,
as felt during complete rest. 5 (Moderate) is right in the middle of 0 and 10. It’s not especially hard and it is no
problem to continue; but it no longer feels comfortable. 10 (Maximal) is maximum effort; your muscles are
working as hard as they can, and you can only maintain this for seconds before you will have to stop.
TTF (Time to Failure) indicates the amount of time remaining, during an isometric contraction, before you
will be unable to continue. In other words, this describes how much you have left in your ’fuel tank’. 100%—your
muscles are fresh; you haven’t started the contraction yet (fuel tank is full). 50%—means you can continue to
hold the contraction for the same amount of time that you have already completed (fuel tank is half full). 0%—
your muscles are failing/have failed (fuel tank is empty). When you give your rating; focus only on the muscle
Scientific Reports | (2021) 11:5334 | https://doi.org/10.1038/s41598-021-84803-8 3
Vol.:(0123456789)www.nature.com/scientificreports/
Figure 2. RPE scales presentation formats.
group(s) that is working. You can use the ‘Description’ words, the Time to Failure (TTF), and/or you can simply
rate the exertion out of ten”.
Data analysis. All data were analysed using the statistical package for social sciences (SPSS 22 release ver-
sion for Windows; SPSS Inc., Chicago IL). Before analysis, all data were checked for conformity with the para-
metric assumptions30. Construct validity between the IES and CR-10 ratings was determined using linear regres-
sion analysis and Spearman’s Rank-Order Correlation. Concurrent validity of the IES and CR-10 results with
the criterion measures of exercise intensity was assessed using Spearman’s Rank-Order Correlations. To test for
differences in concurrent validity, between the IES and CR-10, validity coefficients underwent Fishers Z score
transformation followed by statistical analysis for differences in the Z-Scores. Reliability of the IES, CR-10, HR
and BP results across the four testing sessions were examined separately using: two-factor (Session × Intensity)
repeated measures ANOVA’s or Friedman’s test (normal distribution dependant); Intraclass Correlation Coef-
ficients (ICC); Standard Error of Measurement (SEM) and Coefficient of Variations (COV). For the difference
tests, the ‘Session’ factor had four levels (testing sessions 1–4), and the ‘Intensity’ factor had five levels (knee
angle—135°, 125°, 115°, 105° and 95°). Where main effects were found, post-hoc testing was conducted with
Bonferroni adjustment for multiple comparisons. The ICC (3,1)31,32 model was used to assess the agreement
between the repeated measures taken during consecutive sessions. Within-participant variance was calculated
as the SEM from the ICC analyses, and as COVs with 95% confidence interval, derived from log-transformed
two-way ANOVA for each variable30,33. ICC and COV results, for the IES and CR-10 scales, were considered to
be significantly different if the mean results for each scale lay outside of the 95% confidence interval of the other.
An alpha level of < 0.05 was set as the threshold for statistical significance. All data are expressed as mean ± S.D.
unless otherwise indicated.
Scientific Reports | (2021) 11:5334 | https://doi.org/10.1038/s41598-021-84803-8 4
Vol:.(1234567890)www.nature.com/scientificreports/
Figure 3. The relationship between the IES and CR-10 ratings of perceived exertion.
Figure 4. The relationships of the IES and CR-10 ratings with isometric exercise intensity (as a percentage of
maximum).
Results
Resting measures. At the start of each of the four testing sessions, resting measures were recorded for
each participant. The mean resting values for HR, SBP, DBP and MAP were: 61 ± 8 b min−1, 109 ± 7 mmHg,
63 ± 5 mmHg, and 80 ± 6 mmHg, respectively. There were no significant differences in any resting measures
between trials (P > 0.05). The Intra-class correlation coefficients for the resting measures ranged from r = 0.52
to 0.91. Coefficients of Variation (with 95% confidence intervals) were 4.0% (3.5–4.9%) for resting HR, 2.9%
(2.5–3.5%) for SBP, 6.2% (5.3–7.6%) for DBP, and 4.2% (3.6–5.1%) for MAP.
Construct validity. The construct validity of the IES was established by correlation and linear regression
analysis of the ratings from the IES and CR-10 scale. Spearman’s Rank-Order Correlation showed a strong pos-
itive linear relationship (r = 0.97, P < 0.001) between the CR-10 and IES ratings of exertion. Likewise, linear
regression analysis to assess the ability of the CR-10 results to predict the IES results, showed a significant linear
regression equation (F (1, 977) = 13,958, P < 0.001) with an r value of 0.97 (Fig. 3).
RPE and exercise intensity. The validity of the IES and CR-10 to represent isometric exercise intensity
was assessed by correlating the RPE ratings against percentage of maximum exercise intensity (workload × wall
squat duration). Strong positive correlations were shown for the IES (r = 0.89, P < 0.001) and CR-10 (r = 0.88,
P < 0.001) with exercise intensity (Fig. 4).
RPE and measures of physiological exertion. Significant positive relationships were found when cor-
relating the physiological measures of exercise intensity: HR (r = 0.82 and r = 0.81, P < 0.001), SBP (r = 0.84 and
r = 0.84, P < 0.001), DBP (r = 0.81 and r = 0.80, P < 0.001), and MAP (r = 0.84 and r = 0.83, P < 0.001) with RPE
ratings from the IES and CR-10 respectively (Fig. 5).
Scientific Reports | (2021) 11:5334 | https://doi.org/10.1038/s41598-021-84803-8 5
Vol.:(0123456789)www.nature.com/scientificreports/
Figure 5. The relationships of the IES and CR-10 ratings with the physiological measures of exercise intensity.
Session Number
Knee angle 1 2 3 4 ICC SEM COV
135° 1.9 ± 1.5 1.4 ± 1.3 1.3 ± 1.1 1.7 ± 1.5 0.81 (0.70–0.89) 0.67 54.0% (44.9–70.0%)
125° 3.9 ± 1.8 3.5 ± 1.8 3.3 ± 1.9 3.7 ± 2.2 0.86 (0.78–0.92) 0.87 33.1% (27.8–42.1%)
IES 115° 6.6 ± 1.7 6.2 ± 2.0 6.1 ± 2.0 6.1 ± 2.3 0.91 (0.85–0.95) 0.72 14.2% (12.0–17.6%)b
105° 8.6 ± 1.2 8.5 ± 1.2 8.2 ± 1.4 8.1 ± 1.5 0.83 (0.72–0.91) 0.56 8.1% (6.8–10.4%)b
95° 9.4 ± 0.5 9.3 ± 0.8 9.3 ± 0.8 9.1 ± 1.0 0.84 (0.66–0.93) 0.37 4.5% (3.5–6.7%)b
135° 1.2 ± 1.0 1.0 ± 1.0 0.9 ± 0.9 1.0 ± 0.9 0.90 (0.83–0.94)a 0.35 41.9% (35.0–53.7%)b
125° 3.0 ± 1.7 3.0 ± 1.7 2.7 ± 1.8 3.0 ± 2.1 0.87 (0.78–0.92) 0.76 38.9% (32.6–49.7%)
CR-10 115° 5.7 ± 2.3 5.4 ± 2.1 5.3 ± 2.3 5.4 ± 2.5 0.90 (0.83–0.94) 0.84 18.7% (15.9–23.5%)
105° 7.6 ± 1.8 8.0 ± 1.5 7.5 ± 1.8 7.5 ± 1.7 0.79 (0.64–0.88) 0.79 13.7% (11.4–17.7%)
95° 8.6 ± 1.1 9.0 ± 1.2 9.0 ± 1.5 8.9 ± 1.2 0.86 (0.69–0.94) 0.48 7.0% (5.4–10.3%)b
Table 1. IES and CR-10 results at each knee angle between sessions and the corresponding reliability statistics.
ICC intraclass correlation coefficients (95% confidence intervals), COV coefficient of variation (95% confidence
intervals). ICC and COV values for comparisons of sessions 2, 3 and 4 only. a Significantly greater ICC value
than the other RPE scale at the same knee angle. b Significantly lower variance than the other RPE scale at the
same knee angle.
Scientific Reports | (2021) 11:5334 | https://doi.org/10.1038/s41598-021-84803-8 6
Vol:.(1234567890)www.nature.com/scientificreports/
Reliability of exercise measures. There were no significant differences in IES or CR-10 ratings between
sessions at any knee angle (P > 0.05). The ICCs and COVs between sessions 1 and 2, fell outside of the confidence
intervals for the between sessions 2–4 comparisons; therefore, the reliability data for sessions 1 and 2 are pre-
sented separately to sessions 2–4. ICCs for sessions 1 and 2, across all knee joint angles, ranged from r = − 0.49
to 0.76 (SEM = 0.67–1.07) and r = 0.30–0.76 (SEM = 0.71–1.39) for the IES and CR-10 respectively. Additionally,
the COVs between sessions 1 and 2 ranged from 42.1 to 10.5% for the IES and 77.2–12.1% for the CR-10. The
ICCs for sessions 2–4 ranged from r = 0.81 to 0.91 and r = 0.79–0.90 for the IES and CR-10 respectively (Table 1).
The ICC for the 135° knee angle was significantly higher for the CR-10 scale when compared to the IES; no other
differences in ICCs were found. The SEMs calculated for Sessions 2–4 ranged from 0.37 to 0.87 for the IES and
0.35–0.84 for the CR-10 Scale. As such, The COVs ranged from 54 to 4.5% and 41.9–7% for the IES and CR-10
respectively, with the lowest variances seen at the higher intensity levels (Table 1).
Discussion
This study demonstrated that the IES is a valid and reproducible measure of RPE, exercise intensity and the physi-
ological responses to isometric wall squat exercise. The construct validity of the IES was assessed using the Borg
CR-10 scale, which has previously been shown to be a valid and reliable measure of RPE and exercise intensity
during resistance exercise34 and is the scale most commonly adopted for this type of exercise intervention14. The
IES ratings showed excellent agreement with the ratings from the Borg CR-10 (r = 0.97), during correlation and
linear regression analysis. In addition, there were no significant differences in the relationships shown with exer-
cise intensity and physiological measures of exertion (HR and BP) between the IES and CR-10 scales. The Borg
CR-10 scale has previously been used to validate the OMNI Elliptical Ergometer Scale, during aerobic exercise,
yielding similar construct validity coefficients to the present study (r = 0.96–0.98)28. During dynamic resistance
exercise, the CR-10 scale was also used to validate a novel Estimated Repetitions to Failure Scale, giving strong
sed35. Likewise, the now
validity coefficients ranging from r = 0.86 to r = 0.96, depending on the specific exercise u
widely used OMNI-RES scale was validated during resistance exercise using the Borg 6-20 s cale36; this analysis
showed validity coefficients from r = 0.94–0.97. The construct validity results of the current study, when compared
to previous research, suggest that the IES is a valid measure of RPE during isometric exercise.
Ratings from the IES were shown to be an accurate representation of exercise intensity during maximal iso-
metric wall squat exercise. This was shown through correlation of the IES results with wall squat duration, which
in this case represents an increase in both contraction time and workload throughout the test. The results of this
analysis showed a strong positive relationship between the two variables (r = 0.89). Previous research has shown
the OMNI-RES scale to be a valid measure of exercise intensity, with correlations ranging from r = 0.89 to 0.91
in males and f emales27. Similarly, the CR-10 was shown to be a valid measure of exercise intensity with validity
coefficients of r = 0.77 at baseline and r = 0.91 following a 12-week training i ntervention37. Likewise, in produc-
tion mode, the Borg 6-20 scale has also been shown to be valid when used by sedentary, active and strength
trained individuals alike (r = 0.83–0.92)38. As such, the validity coefficient shown for the IES is comparable to
those shown in previous resistance exercise research, suggesting it is an accurate measure of exercise intensity.
The IES also showed strong positive relationships with HR (r = 0.82) and BP (r = 0.81–0.84), indicating that
the IES can accurately represent the changes in physiological exertion caused during the incremental isometric
test, to the same extent as the CR-10 scale. The CR-10 scale has previously been shown to produce strong posi-
tive correlations with HR (r = 0.76) and blood lactate (r = 0.730) during dynamic weight training39, and with HR
(r = 0.71) during bodyweight suspension t raining40. Likewise, the CR-10 has shown comparable relationships
during aerobic t raining18. The strong relationships seen between the IES and physiological measures could allow
it to be used as an important additional safety measure during IET, to ensure that participants are working at
intensities that keep them within safe HR and BP limits8,41. However, this requires further investigation for
confirmation.
Reliability of the IES measures across the four testing sessions was examined by correlating the results from
consecutive sessions using intraclass correlation coefficients. The ICC measures of reliability between sessions 1–2
were significantly different, when compared to between sessions 2–3 and 3–4. These results indicate a learning
effect following the first session and suggests that habituation with the isometric wall squat exercise and RPE scale
may be required before a stable relationship is achieved. The ICC results for the IES showed excellent agreement
(r = 0.81–0.91) across sessions 2–4, indicating that the IES is a reliable measure of RPE and exercise intensity
over time. These reliability coefficients were closely matched by the ICCs for HR and BP, suggesting that the
relationship between the IES results and physiological exertion is stable over time. These results are comparable
to those shown previously for the OMNI-RES Thera-band (r = 0.72–0.76)42 and Borg CR-10 (r = 0.88)43 scales
during different forms of resistance exercise. Additionally, when the OMNI-RES scale was used in production
mode, where the participant selects/modifies the exercise intensity to elicit a specific RPE response, similar reli-
ability coefficients were found (r = 0.69–0.95)44.
The within participant variance was assessed using the SEM and COV. The CR-10 scale showed lower vari-
ance at the 135-workload (0.35 vs 0.67) when compared to the IES, corresponding to the significantly higher
ICC result seen with the CR-10 at that level. Whereas, the IES showed lower SEMs at the four higher workloads,
when compared to the CR-10. This translated to statistically lower COVs at the three highest workloads with the
IES. The COV results for the IES showed higher percentage variance at the lighter intensities and lower variances
at the higher intensities; this is to be expected as the lower average RPE values seen in the earlier stages of the
test (IES = 1.6 and CR-10 = 1.0 in the first stage) mean that even the smallest possible change between session
(0.5) would elicit 30–50% variance. Arguably, this high variance makes comparison of COVs from RPE with
COVs from other measurement methods, e.g. HR, inappropriate; however, this can still be a useful measure of
the variance/reliability when comparing two like measures, such as two RPE scales. The CR-10 scale produced
Scientific Reports | (2021) 11:5334 | https://doi.org/10.1038/s41598-021-84803-8 7
Vol.:(0123456789)www.nature.com/scientificreports/
significantly lower variance at the lowest intensity (135°), possibly due to the increased number of lower value
numbers and therefore smaller differences between values at the lower end of that scale (0, 0.3, 0.5 and 1), whereas
the IES showed significantly lower variance at the highest three intensities (115°, 105° and 95°), possibly due to
the simpler closed-ended nature of the IES as opposed to the open-ended CR-10. Since these intensities are more
representative of the intensities used during IET for reducing resting blood pressure14, this may suggest the IES is
more appropriate during this type of intervention. Furthermore, previous analysis of the reliability of the CR-10
showed a COV of 17%, for exercise eliciting an average RPE of approximately six for females and seven males45.
This RPE is approximately equivalent to the mean IES results seen at the 115° knee angle (6.3) which showed
between session variance of 14.2%. Similarly, Day et al.43 assessed the reliability of the CR-10 across 2-sessions
at three difference intensities, giving a COV of 14.5%. The three intensities used in Day’s study gave mean RPE
scores of 3.7, 5.6 and 6.9, approximating the mean IES ratings achieved across the 125° and 115° knee angles in
the current study (3.6–6.3); The IES COVs for these knee angles ranged from 14.2 to 33.1%. These results sug-
gest that the IES is reliable across sessions following habituation, especially at the higher workloads associated
with BP training interventions.
Further research is required to explore the validity of IES during discontinuous isometric exercise at sub-
maximal intensities, as is currently used during isometric wall squat training for the reduction of resting blood
pressure15. Additionally, research is needed to explore the potential use of RPE as a means of prescribing and
monitoring IET intensity, especially in pre-hypertensive and hypertensive populations.
Conclusion
The IES provides a valid and reliable measure of RPE and exercise intensity during maximal isometric wall squat
exercise. Additionally, the IES results produced strong positive relationships with the criterion measures of physi-
ological exertion (HR and BP). As such, the IES can be used as a valid measure of RPE and could be useful in
the selection and monitoring of workloads during IET interventions for the reduction of resting blood pressure.
Received: 20 March 2020; Accepted: 25 January 2021
References
1. Mancia, G. et al. ESH/ESC guidelines for the management of arterial hypertension: The Task Force for the Management of Arterial
Hypertension of the European Society of Hypertension (ESH) and of the European Society of Cardiology (ESC). Eur. Heart J. 34,
2159–2219 (2013).
2. Brook, R. D., Jackson, E. A., Giorgini, P. & McGowan, C. L. When and how to recommend “alternative approaches” in the manage-
ment of high blood pressure. Am. J. Med. 128, 567–570 (2015).
3. Wiles, J. D., Coleman, D. A. & Swaine, I. L. The effects of performing isometric training at two exercise intensities in healthy young
males. Eur. J. Appl. Physiol. 108(3), 419–428 (2010).
4. Cornelissen, V. A. & Smart, N. A. Exercise training for blood pressure: A systematic review and meta-analysis. J. Am. Heart Assoc.
2, e004473 (2013).
5. Devereux, G. R., Wiles, J. D. & Howden, R. Immediate post-isometric exercise cardiovascular responses are associated with
training-induced resting systolic blood pressure reductions. Eur. J. Appl. Physiol. 115(2), 327–333 (2015).
6. Taylor, K. A. et al. Neurohumoral and ambulatory haemodynamic adaptations following isometric exercise training in unmedicated
hypertensive patients. J. Hypertens. 37(4), 827–836 (2018).
7. Robertson, R. J. et al. Validation of the adult OMNI scale of perceived exertion for cycle ergometer exercise. Med. Sci. Sports Exerc.
36, 102–108 (2004).
8. Wiles, J. D., Taylor, K., Coleman, D., Sharma, R. & O’driscoll, J. M. The safety of isometric exercise: Rethinking the exercise pre-
scription paradigm for those with stage 1 hypertension. Medicine 97, 10 (2018).
9. Devereux, G. R., Wiles, J. D. & Swaine, I. L. Reductions in resting blood pressure after 4 weeks of isometric exercise training. Eur.
J. Appl. Physiol. 109(4), 601–606 (2010).
10. Baross, A. W., Wiles, J. D. & Swaine, I. L. Double-leg isometric exercise training in older men. Open Access J. Sports Med. 4, 33–40
(2013).
11. McGowan, C. L., Levy, A. S., McCartney, N. & MacDonald, M. J. Isometric handgrip training does not improve flow-mediated
dilation in subjects with normal blood pressure. Clin. Sci. 112, 403–409 (2007).
12. Millar, P. J., Paashuis, A. & McCartney, N. Isometric handgrip effects on hypertension. Curr. Hypertens. Rev. 5, 54–59 (2009).
13. Goldring, N., Wiles, J. D. & Coleman, D. The effects of isometric wall squat exercise on heart rate and blood pressure in a normo-
tensive population. J. Sports Sci. 32, 129–136 (2014).
14. Wiles, J. D., Goldring, N., O’Driscoll, J. M., Taylor, K. A. & Coleman, D. A. An alternative approach to isometric exercise training
prescription for cardiovascular health. Transl. J. Am. Coll. Sports Med. 3(2), 10–18 (2018).
15. Wiles, J. D., Goldring, N. & Coleman, D. Home-based isometric exercise training induced reductions resting blood pressure. Eur.
J. Appl. Physiol. 117, 8393 (2017).
16. Colado, J. C. et al. Construct and concurrent validation of a new resistance intensity scale for exercise with Thera-Band® elastic
bands. J. Sports Sci. Med. 13(4), 758 (2014).
17. Morrin, N. M., Stone, M. R., Swaine, I. L. & Henderson, K. J. The use of the CR-10 scale to allow self-regulation of isometric exercise
intensity in pre-hypertensive and hypertensive participants. Eur. J. Appl. Physiol. 118(2), 339–347 (2018).
18. Chen, M. J., Fan, X. & Moe, S. T. Criterion-related validity of the Borg ratings of perceived exertion scale in healthy individuals:
A meta-analysis. J. Sports Sci. 20(11), 873–899 (2002).
19. Lagally, K. M., McCaw, S. T., Young, G. T., Medema, H. C. & Thomas, D. Q. Ratings of perceived exertion and muscle activity
during the bench press exercise in recreational and novice lifters. J. Strength Condition. Res. 18(2), 359–364 (2004).
20. Aniceto, R. R. et al. Rating of perceived exertion during circuit weight training: A concurrent validation study. J. Strength Condi-
tion. Res. 29(12), 3336–3342 (2015).
21. Buckley, J. P. & Borg, G. A. Borg’s scales in strength training; from theory to practice in young and older adults. Appl. Physiol. Nutr.
Metab. 36(5), 682–692 (2011).
22. Robertson, R. J. et al. Validation of the children’s OMNI RPE scale for stepping exercise. Med. Sci. Sports Exerc. 37(2), 290–298
(2005).
23. Pincivero, D. M., Polen, R. R. & Byrd, B. N. Gender and contraction mode on perceived exertion. Int. J. Sports Med. 31(05), 359–363
(2010).
Scientific Reports | (2021) 11:5334 | https://doi.org/10.1038/s41598-021-84803-8 8
Vol:.(1234567890)www.nature.com/scientificreports/
24. Eston, R. & Evans, H. J. L. The validity of submaximal ratings of perceived exertion to predict one repetition maximum. J. Sports
Sci. Med. 8(4), 567 (2009).
25. Gearhart, R. F., Riechman, S. E., Lagally, K. M., Andrews, R. D. & Robertson, R. J. Safety of using the adult OMNI Resistance
Exercise Scale to determine 1-RM in older men and women. Percept. Mot. Skills 113(2), 671–676 (2011).
26. Borg, G. Perceived Exertion and Pain Scales (Human Kinetics, 1998).
27. Robertson, R. J. et al. Concurrent validation of the OMNI perceived exertion scale for resistance exercise. Med. Sci. Sports Exerc.
35(2), 333–341 (2003).
28. Mays, R. J. et al. Validation of adult OMNI perceived exertion scales for elliptical ergometry. Percept. Mot. Skills 111(3), 848–862
(2010).
29. Whelton P.K. et al. ACC/AHA/AAPA/ABC/ACPM/AGS/APhA/ASH/ASPC/NMA/PCNA guideline for the prevention, detection,
evaluation, and management of high blood pressure in adults. A Report of the American College of Cardiology/American Heart
Association Task Force on Clinical Practice Guidelines. (2017).
30. Atkinson, G. & Nevill, A. M. Selected issues in the design and analysis of sport performance research. J. Sports Sci. 19(10), 811–827
(2001).
31. Shrout, P. E. & Fleiss, J. L. Intraclass correlations: Uses in assessing rater reliability. Psychol. Bull. 86, 420–428 (1979).
32. Field, A. Discovering Statistic Using SPSS for Windows 3rd edn. (Sage, 2009).
33. Tate, R. F. & Klett, G. W. Optimal confidence intervals for the variance of a normal distribution. J. Am. Stat. Assoc. 54(287), 674–682
(1959).
34. Brown, D. M. & Bray, S. R. Isometric exercise and cognitive function: An investigation of acute dose–response effects during
submaximal fatiguing contractions. J. Sports Sci. 33(5), 487–497 (2015).
35. Hackett, D. A., Johnson, N. A., Halaki, M. & Chow, C. M. A novel scale to assess resistance-exercise effort. J. Sports Sci. 30(13),
1405–1413 (2012).
36. Lagally, K. M. & Robertson, R. J. Construct validity of the OMNI resistance exercise scale. J. Strength Condition. Res. 20(2), 252–256
(2006).
37. Desgorces, F. D., Thomasson, R., Aboueb, S., Toussaint, J. F. & Noirez, P. Prediction of one-repetition maximum from submaximal
ratings of perceived exertion in older adults pre-and post-training. Aging Clin. Exp. Res. 27(5), 603–609 (2015).
38. Tiggemann, C. L. et al. Perceived exertion in different strength exercise loads in sedentary, active, and trained adults. J. Strength
Condition. Res. 24(8), 2032–2041 (2010).
39. Hollander, D. B. et al. RPE, pain, and physiological adjustment to concentric and eccentric contractions. Med. Sci. Sports Exerc.
35(6), 1017–1025 (2003).
40. Giancotti, C.f., Foster, C., Pezzotta, C., Lecce, D., Rodio, A., Capranica, L. & Cortis, C. Evaluation of training load during Suspen-
sion Training: Is session-RPE a valid method? in Conference: 20th Annual Congress of the European College of Sport Science (ECSS),
Malmö (Sweden), (2015).
41. Williams, M. A. et al. American Heart Association Council on Clinical Cardiology; American Heart Association Council on
Nutrition, Physical Activity, and Metabolism. Resistance exercise in individuals with and without cardiovascular disease: 2007
update: A scientific statement from the American Heart Association Council on Clinical Cardiology and Council on Nutrition,
Physical Activity, and Metabolism. Circulation 31, 572–584 (2007).
42. Colado, J. C. et al. Concurrent validation of the OMNI-resistance exercise scale of perceived exertion with Thera-band resistance
bands. J. Strength Condition. Res. 26(11), 3018–3024 (2012).
43. Day, M. L., McGuigan, M. R., Brice, G. & Foster, C. Monitoring exercise intensity during resistance training using the session RPE
scale. J. Strength Condition. Res. 18(2), 353–358 (2004).
44. Lagally, K. M., Amorose, A. J. & Rock, B. Selection of resistance exercise intensity using ratings of perceived exertion from the
OMNI—RES. Percept. Mot. Skills. 108(2), 573–586 (2009).
45. Egan, A. D. Session rating of perceived exertion during high intensity and low intensity bouts of resistance exercise. UW-L J.
Undergrad. Res. 6, 1–6 (2003).
Author contributions
J.L., J.O., D.A. and J.W. conceived and designed research. J.L. conducted experiments and analysed data. J.L.
wrote the manuscript. All authors read and approved the manuscript.
Funding
This study was funded by Canterbury Christ Church University.
Competing interests
The authors declare no competing interests.
Additional information
Correspondence and requests for materials should be addressed to J.D.W.
Reprints and permissions information is available at www.nature.com/reprints.
Publisher’s note Springer Nature remains neutral with regard to jurisdictional claims in published maps and
institutional affiliations.
Open Access This article is licensed under a Creative Commons Attribution 4.0 International
License, which permits use, sharing, adaptation, distribution and reproduction in any medium or
format, as long as you give appropriate credit to the original author(s) and the source, provide a link to the
Creative Commons licence, and indicate if changes were made. The images or other third party material in this
article are included in the article’s Creative Commons licence, unless indicated otherwise in a credit line to the
material. If material is not included in the article’s Creative Commons licence and your intended use is not
permitted by statutory regulation or exceeds the permitted use, you will need to obtain permission directly from
the copyright holder. To view a copy of this licence, visit http://creativecommons.org/licenses/by/4.0/.
© The Author(s) 2021
Scientific Reports | (2021) 11:5334 | https://doi.org/10.1038/s41598-021-84803-8 9
Vol.:(0123456789)You can also read