Western Interconnection Gas - Electric Interface Study - Public Report Presentation
←
→
Page content transcription
If your browser does not render page correctly, please read the page content below

Western Interconnection Gas – Electric Interface Study
Public Report Presentation
2018

Trusted commercial intelligence                          woodmac.com

GAS-ELECTRIC INTERFACE STUDY
Overview
Project background
Drivers affecting the gas-electric interface in the Western
Interconnection
Potential disruptions to the gas supply
Mitigation options
2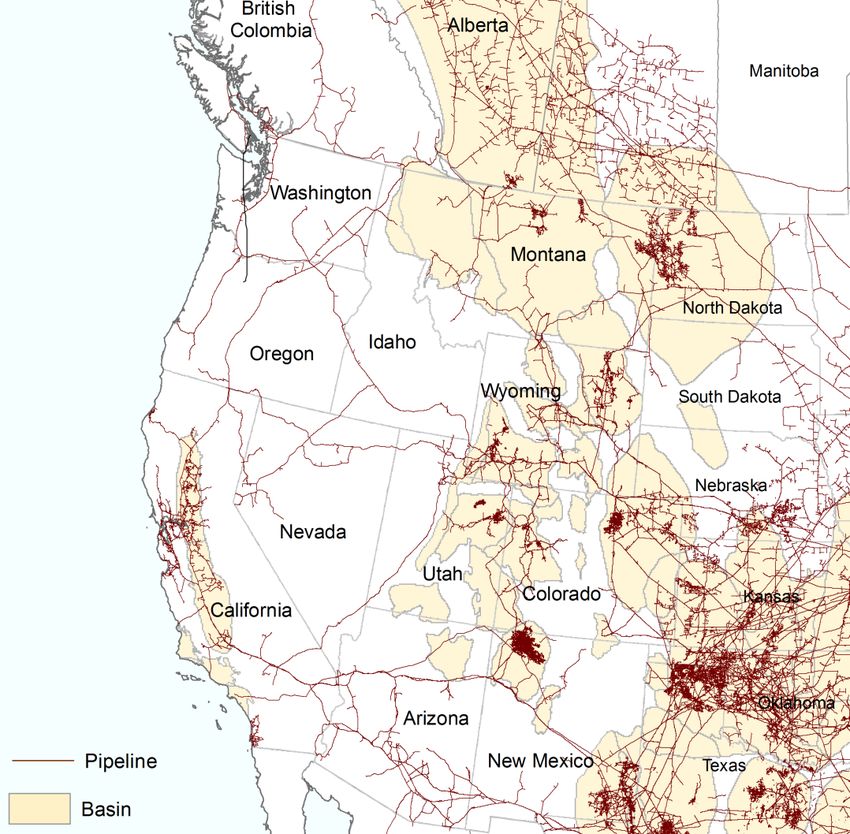
INTRODUCTION AND SUMMARY
Project Background & Context
Background Context
In 2017, WECC commissioned Wood
Mackenzie, E3, and Argonne National In the West, we have entered a period in which it is
Labs to undertake an evaluation of both possible and reasonable to aspire to low
the reliability of the gas/electric wholesale power costs and steady reductions in
interface in the Western emissions
Interconnection.
However, the transition away from large, baseload
This study consisted of multiple nuclear and coal generation towards more intermittent
work-streams: resources places a considerable potential strain on
1) Identifying and modelling the impact of overall system reliability
potential power system vulnerabilities
stemming from gas system disruptions In this context, natural gas generation will take on an
2) Evaluating potential mitigation options and increasingly important role due to its flexibility and
their associated costs and capabilities for ability to compensate for the variability of renewable
reducing such impacts resources
3) Identifying reliability risks associated with Consequently, the ability of the gas/electric systems
gas contracting strategies as well as to handle both everyday variability as well as
existing market rules & protocols
unforeseen disruptions becomes critical for ensuring
4) Providing reasonable and actionable energy security in the West
recommendations for WECC and key
stakeholders
3INTRODUCTION AND SUMMARY
The configuration of the gas/electric system combined with the loss of Aliso
Canyon will create region-wide reliability issues that need to be addressed
• Prior to the 2015 gas leak, the 86 bcf of market-area gas
storage available at Aliso Canyon played a key role in
Baseload retirements and load managing system volatility and reliability
growth will drive natural gas • Renewables additions help mitigate but do not replace the
demand growth, creating constraints increased need for firm, dependable resources stemming
from the 11 GW of coal and nuclear retirements
on the gas system
• Pipeline flow analysis indicate concerns around volumetric
constraints, which limits daily operational flexibility
• The Desert Southwest (DSW) and Southern California
regions are particularly at risk from disruptions of pipeline
Absent key balancing with storage, infrastructure or gas production
Southern California and the Desert • The Pacific Northwest (PNW) is more resilient to major gas
Southwest are at risk from system disruptions, largely owing to market area gas
disruptions of the gas system storage (in OR, WA and Northern CA) and electric
transmission connectivity
• A combination of physical solutions will be required:
investments in renewable generation, battery storage,
There is no silver bullet: a portfolio demand response programs, gas infrastructure and
of mitigation solutions will be storage as well as dual-fuel fired generation
necessary to address the reliability • Improved regional coordination, reserve adequacy
risk accounting, curtailment priorities and forecasting would
decrease market frictions and improve the ability of the
system to respond to disruptions and day-to-day variability
4THE SITUATION IN THE WEST – 2026 WECC COMMON CASE DYNAMICS
The Western grid is being transformed through retirements of baseload
resources and additions of solar and wind generation
Cumulative West Coal/Nuclear Retirements to 2026
30,000
Retired capacity (MW)
Coal
25,000
Nuclear 9 GW of coal and 2.2 GW of
20,000
nuclear generation is projected
12,364 15,000 to be retired by 2026
10,000
4,834
1,967 5,000
Up to 20 GW of new solar
0
2017 2020 2025 (utility & distributed
Cumulative New CA Solar Capacity through 2026 generation) is projected to be
installed in California by 2026
Installed capacity (MW)
25,000
18,705 20,000
Bulk electricity storage will
15,000
10,205
play an increasing role, but
6,455
10,000 there is little clarity on the
5,000 scale and timing
0
2017 2020 2025
Source: WECC 2026 Common Case
5THE SITUATION IN THE WEST – 2026 WECC COMMON CASE DYNAMICS
Gas burn for power could increase by ~21%* or slightly more than 1.0 bcfd
through 2021
Western Interconnection gas power burn (bcfd) Average CCGT capacity factors (%)
Baseload retirements
7 100 Planning to meet gas
increase gas demand for
power post-2024 burn in 2021 is the
+21% 90
6 immediate challenge
80
5 70
60
4
50
3
40
2 30
20
1
10
0 0
2018 2019 2020 2021 2022 2023 2024 2025 2026 2018 2019 2020 2021 2022 2023 2024 2025 2026
Canada California PNW
Basin PNW DSW
DSW Rockies Basin
California Rockies
Source: Wood Mackenzie, E3 based on 2026 WECC Common Case
*Purely on an energy, not capacity, basis keeping gas burn flat through 2021 would require 26 GW of solar power
6THE SITUATION IN THE WEST – 2026 WECC COMMON CASE DYNAMICS
The Western Interconnection and other West Coast natural gas markets
become increasingly dependent on 7 long-haul pipelines and 3 supply basins
West US & Canada Gas Pipes & Producing Basins
WCSB
Key (total production) The West is blessed with access to
XX (XX%) 18 diverse and economic supply
15
Aug. 2026 Gas flow sources between Western Canada,
bcfd
in bcfd (Aug. 2026 Permian and Rockies plays
utilization %)
» Combined reserves of 350 tcf available
Northwest PL at less than $4/mmbtu for dry gas and
GTN $50/bbl for associated gas
2017 2026
4.0 (95%)
Rockies & San Juan
Northwest PL (total production)
However, several major interstate
0.2 (30%) pipelines are already highly utilized
11 12
(THE CHALLENGE – DISRUPTION SCENARIO MODELLING ANALYSIS
The study evaluated 5 key base cases representing major disruptions to the
Western Interconnection as well as 5 additional sensitivities
Regional
Base (N-1) Case N-2 case
focus
Disruption on a PNW Pacific Disruption at the US/Canada border (or
Low hydro conditions
pipeline Northwest upstream) receipt point on the system
M6+ earthquake in the Rocky Mountain
Seismic event disrupting Pacific
House area, that disrupts natural gas Low hydro conditions
Alberta supply Northwest
production in Alberta
Disruption on the critical mainline section
Disruption on a Basin Basin/
downstream of the supply basin and Low hydro conditions
pipeline California
upstream of the demand centers
Desert
Disruption on a DSW Disruption on critical Southern NM section
Southwest/ NA
pipeline of DSW pipeline
Southern CA
Week-long winter supply freeze-off in the
Winter supply freeze-off Permian and San Juan basins reducing Low hydro conditions /
Desert
in the Permian & San Southwest
supply by 1.5 bcfd, higher residential gas Transmission outage from
Juan demand. 15% of generation in AZ/NM CA wildfire
unavailable due to freezing conditions
8THE CHALLENGE – DISRUPTION SCENARIO MODELLING ANALYSIS
The Southwest disruptions constitute the primary vulnerabilities
within the Western Interconnection that we have identified to date
Outage nameplate capacity (GW) Unserved energy & unmet reserves (GWh)
26 24 All at-risk scenarios are 450 428
24 exhibiting unmet spinning Limited risk Unserved energy
400
22 reserves throughout the At-risk Unmet spinning reserves
20 forecast Identified issue 350
18
16 300
16 15 14
14 14 250 236
14 13 12
12 200
10
8 150
8
6 100
4 52 59
50 23
2 1 6 4 0
0 0 27 GW
DSW Freeze Canada Canada Freeze Freeze PNW PNW Basin DSW Freeze Canada Canada Freeze Freeze Other
- base Off - - low - base Off - Off - - low - base - base Pipeline off - Low - Low - Avg off- Path off - Base cases
low hydro Path 26 stress hydro Rupture hydro hydro hydro 26 out
hydro outage stress
stress
Unrisked Economic Impact1 ($US bn) $27.4 $2.2 $3.4 $3.7 $0.8 $0.6 $0
Risked Economic Impact2 ($US bn) $1.1 $0.27 $0.002 $0.02 $0.6 $0
Unserved energy in the DSW scenarios results from the configuration of the gas network, which limits
deliverability in isolated “islands” of power plants in Phoenix and Southern California
Notes : (1) Economic impact estimated based on cost of unserved energy in each state for each type of demand sector
(2) Risked Economic Impact estimated based on probability of each disruption
Source: Argonne National Labs , E3, Wood Mackenzie
9MITIGATION OPTIONS & RECOMMENDATIONS
Meeting the future needs of the Bulk Power System in the Western
Interconnection reliably and at lowest cost will require a portfolio of options
Option Evaluation
Mitigation
Capabilities
Gas System Dual-Fired
Expansion Generation
Considerations
Economic Cost
1 2
Policy
Balanced Power
2018
Portfolio
DSR Renewables
3 Programs 4 & Batteries
Temporal
Considerations
101 MITIGATION OPTIONS & RECOMMENDATIONS
The availability of gas storage facilities located in key demand basins
significantly decreases the impact of a DSW pipeline disruption
Unserved energy & unmet reserves (GWh)
The study modelled two alternative cases of the
500 DSW pipeline disruption to examine the impact
450 428 of the availability of gas storage in key locations
400
» The first case keeps Aliso Canyon operating at the
350 current limitations on its working capacity and
300 withdrawal rate
250 236 236
» The second case models an additional underground
200 natural gas storage facility in the Phoenix, AZ area,
based on the open season proposed by Kinder Morgan
150
100 Working
56 Max withdrawal
Case capacity
50 rate (mmcfd)
0 10 (mmcf)
0
DSW Pipe DSW Pipe DSW base case Aliso Canyon decommissioned
DSW Pipe
Rupture Rupture with Aliso
Rupture with AZ Aliso Canyon
Canyon operational 24,000 800
gas storage facility operational
Unserved energy
AZ Gas Storage 4,000 400
Unmet spinning reserves
Source: Argonne National Labs , E3, Wood Mackenzie
114 MITIGATION OPTIONS & RECOMMENDATIONS
It will be necessary to bridge the path to battery storage implementation
with other mitigation options
Mitigation Capability of Battery & Solar Additions
450 We estimate that ~14 – 15 GW of 4-hr battery
Batteries Solar
storage would need to be installed to mitigate all
400 unserved energy in the EPNG scenario
» The associated capex of installing the battery storage
350 needed to compensate for the DSW pipeline disruption
scenario is estimated to be ~$12 – $18 bn
Unserved Energy (GWh)
300
The limitations of solar capacity to flex on peak
250 hour demand yield diminishing returns
» Consequently, solar capacity by itself is not able to
200 completely compensate for impacts from the EPNG
disruption
150
100
A feasible, explicitly articulated path forward
utilizing a combination of mitigation options is
50
critical for bridging to proposed renewables
targets in a safe and reliable manner
0
0 5000 10000 15000 20000 25000 30000 35000
MW Added
Source: E3
12MITIGATION OPTIONS & RECOMMENDATIONS
Reconciliation and improvement of natural gas/electric coordination will be
key to maximizing ability to manage increased gas demand
Recommendations Benefits
Improved Conduct regional contingency planning Maximizes compensation ability for
Regional exercises led by WECC to prepare for a utilities across the Western
number of disruption scenarios Interconnection
Coordination
Greater transparency of firm contracting Allows for more robust planning
Resource and linkage to power plants served in processes, especially as gas and power
Adequacy firm reserve reports capacity dynamics tighten
Assessment
Re-visit classification of electric Ensuring that critical power plants are
Curtailment generation as “non-core” end-use not the first to be curtailed allows for
Priorities Designation of plants critical to grid additional flexibility for compensation
reliability as core end-use via transmission
Require intra-day LDC core load Higher accountability for prior-day
Forecasting & balancing to ensure fair implementation forecasting allows easier utility
Execution of OFOs and penalties operation
Additional clarity around interstate Explicit interstate curtailment protocols
pipeline curtailment protocol allow for better contingency planning
Split weekend nomination period into A feasible step for both gas and electric
Gas-Electric daily blocks, resulting in a 7-day sides that would minimize response lead
Day Mismatch nomination cycle times over the weekend period
Source: Wood Mackenzie, E3
1314
WECC’s Next Steps
• Outreach
o Shine light
o Discussion forum(s)
• Assess
o WECC led
o Entity specific
• Monitor
o Regulatory trends
o Industry trends and response
W E S T E R N E L E C T R I C I T Y C O O R D I N A T I N G C O U N C I LDisclaimer
This report has been prepared for WECC by Wood Mackenzie Incorporated. The report
is intended solely for the benefit of WECC and its contents and conclusions are
confidential and may not be disclosed to any other persons or companies without Wood
Mackenzie’s prior written permission.
The information upon which this report is based has either been supplied to us by
WECC or comes from our own experience, knowledge and databases. The opinions
expressed in this report are those of Wood Mackenzie. They have been arrived at
following careful consideration and enquiry but we do not guarantee their fairness,
completeness or accuracy. The opinions, as of this date, are subject to change. We do
not accept any liability for your reliance upon them.
1516
Branden Sudduth – WECC Director, Reliability Risk Management branden@wecc.biz
Gas-Electric Interface Public Report click here
Gas-Electric Interface Public Presentation click here
W E S T E R N E L E C T R I C I T Y C O O R D I N A T I N G C O U N C I LEurope +44 131 243 4400
Americas +1 713 470 1600
Asia Pacific +65 6518 0800
Email contactus@woodmac.com
Website www.woodmac.com
Wood Mackenzie™, a Verisk Analytics business, is a trusted source of commercial intelligence for the world's
natural resources sector. We empower clients to make better strategic decisions, providing objective analysis
and advice on assets, companies and markets. For more information visit: www.woodmac.com
WOOD MACKENZIE is a trade mark of Wood Mackenzie Limited and is the subject of trade mark registrations
and/or applications in the European Community, the USA and other countries around the world.
17You can also read