The Uncertain Future For ANS LNG Exports - NET
←
→
Page content transcription
If your browser does not render page correctly, please read the page content below

The Uncertain Future For
                                              ANS LNG Exports
                                                           Presented to:
                                                  LSI Energy in Alaska Conference
                                                          Anchorage, AK

                                                             Presented by:
                                                          Paul R. Carpenter
                                                           Steven H. Levine
                                                              Anul Thapa
                                                          The Brattle Group
                                                           44 Brattle Street
                                                       Cambridge, Massachusetts

                                                               December 3, 2012
Copyright © 2012 The Brattle Group, Inc.                                                                                                    www.brattle.com

     Antitrust/Competition Commercial Damages Environmental Litigation and Regulation Forensic Economics Intellectual Property International Arbitration
 International Trade Product Liability Regulatory Finance and Accounting Risk Management Securities Tax Utility Regulatory Policy and Ratemaking Valuation
 Electric Power Financial Institutions Natural Gas Petroleum Pharmaceuticals, Medical Devices, and Biotechnology Telecommunications and Media Transportation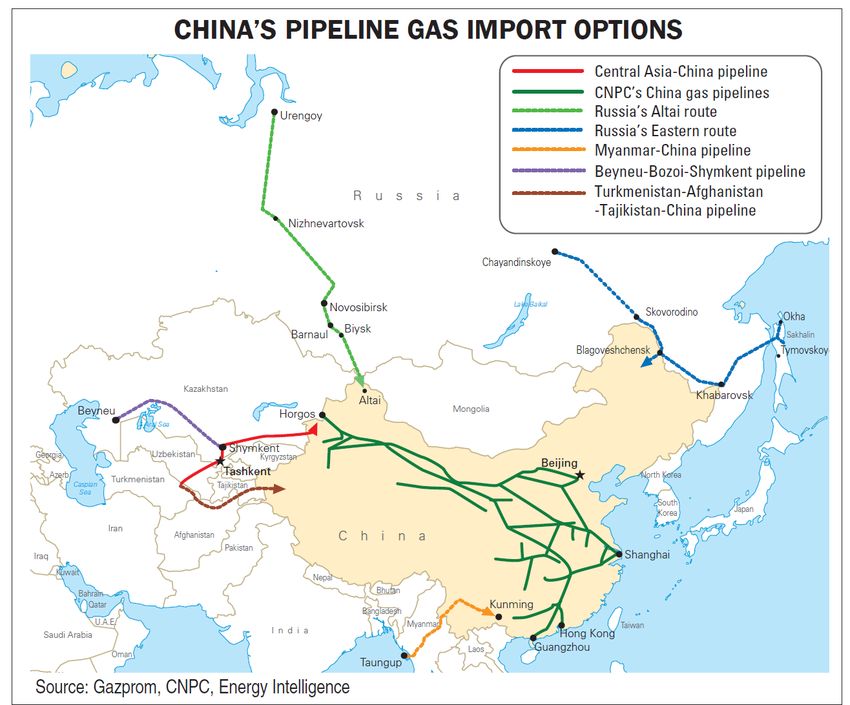
Overview

 ♦ Last year at this time, at this conference, we spoke about the uncertainty
   confronting ANS gas exports via pipeline to the lower-48. We discussed:

     • Shale gas: What is the shape of the long-run supply curve for natural gas
         in the lower-48?
     •   Demand growth: What will determine whether lower-48 demand growth will
         support 4-6 Bcf/day of incremental supply and at what future prices?
     •   Global gas prices:
            ■ What are the prospects for global gas price convergence?

            ■ What is the relationship of the long-run price of oil to that of natural
              gas?

 ♦ Since then, the Alaskan commercial and political winds have shifted to the
   promotion of an LNG export project to Asia. Are its prospects any less risky and
   what uncertainties must be resolved for that project to become a reality?

                                         2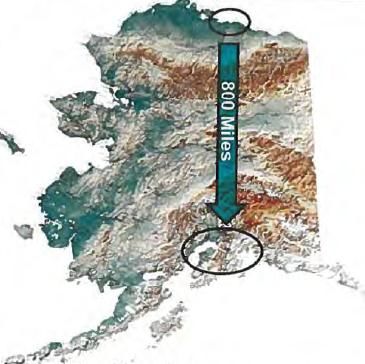
Overview of the ANS LNG Project

                Prudhoe Bay       Alaska Pipeline Project

                                   ♦ Sponsors:

                                   ♦ Est. Cost: $45 - $65+ Billion
                                       • 800 miles of pipeline (3-3.5 Bcf/d)
                                       • 1 gas treatment plant
                                       • 15-18 MTPA liquefaction plant
                                            ■   In comparison, current Australian
                                                liquefaction capacity ~20 MTPA
                                       • LNG storage/loading facilities

       LNG
       Export
                                   ♦ Est. Timeline: ~9 to 12 years
                                                        (i.e., post-2020)

                              3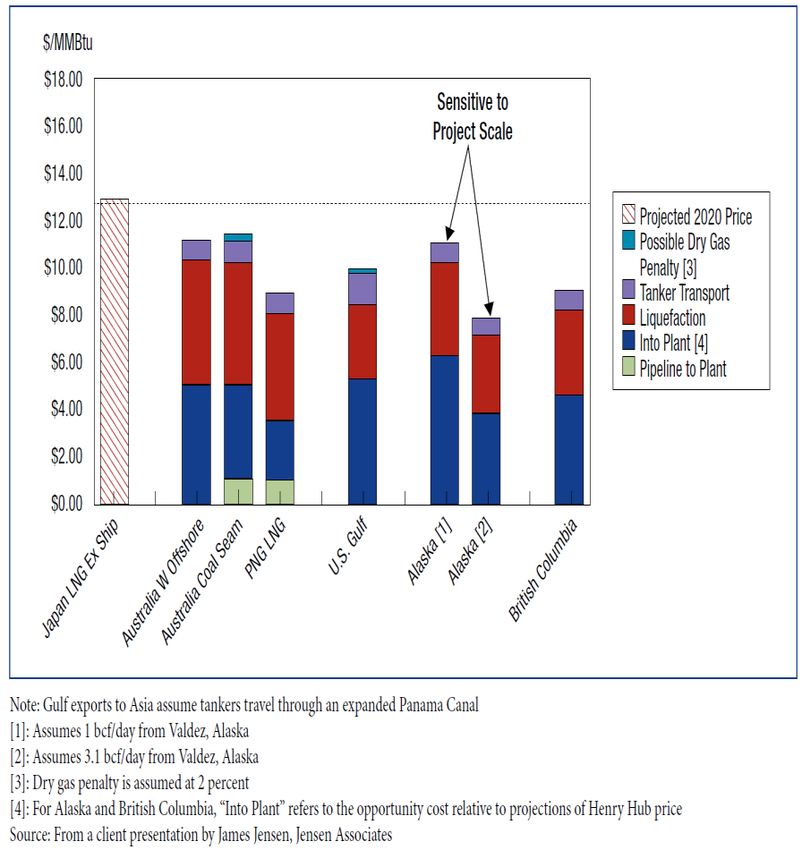
What is different about export as LNG instead of via
pipeline to lower-48?
  ♦ Different market – Asia -- where LNG prices have historically been
    linked to oil and unlinked to lower-48 or European prices. Will oil prices
    continue to dictate the price of LNG in Asia?

  ♦ Different competition – Australian, Middle-eastern, Russian, BC and
    Gulf Coast LNG development projects have a head start. Is it already
    too late for an Alaskan project?

  ♦ Different project – shorter pipeline but expensive liquefaction facility.
    Is it less costly than the competition? Is “stranded” ANS gas a
    competitive advantage for Alaskan LNG exports?

  Each of these differences carries a different set of risks/uncertainties for
  the project.

                                       4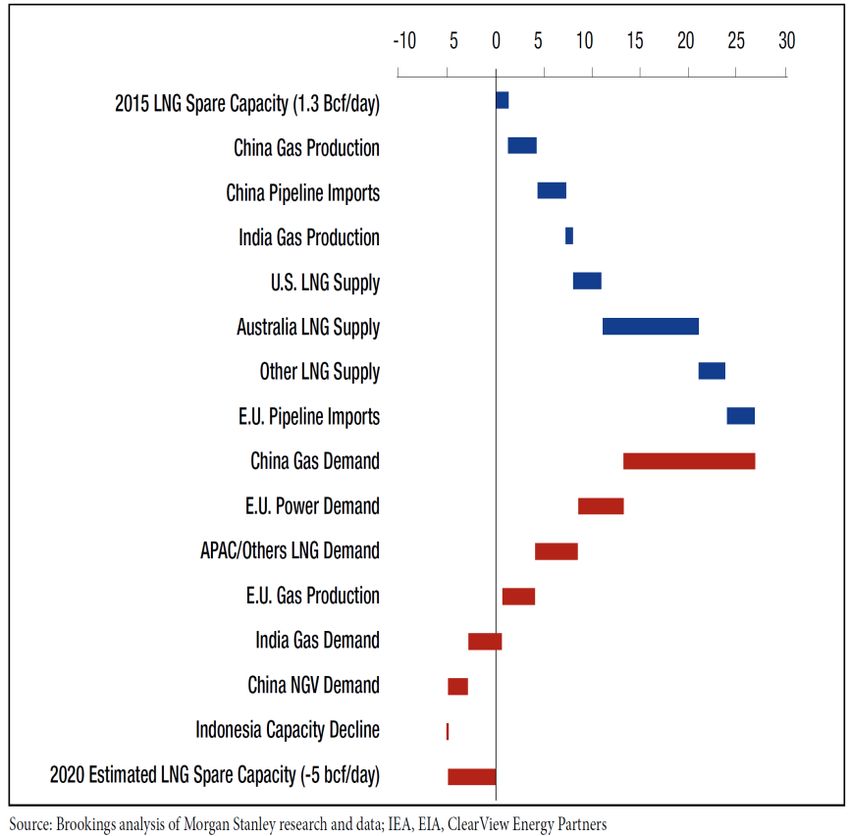
Large Oil/Gas Price Differential Makes Oil Price-
linked LNG Exports Potentially Attractive

                         5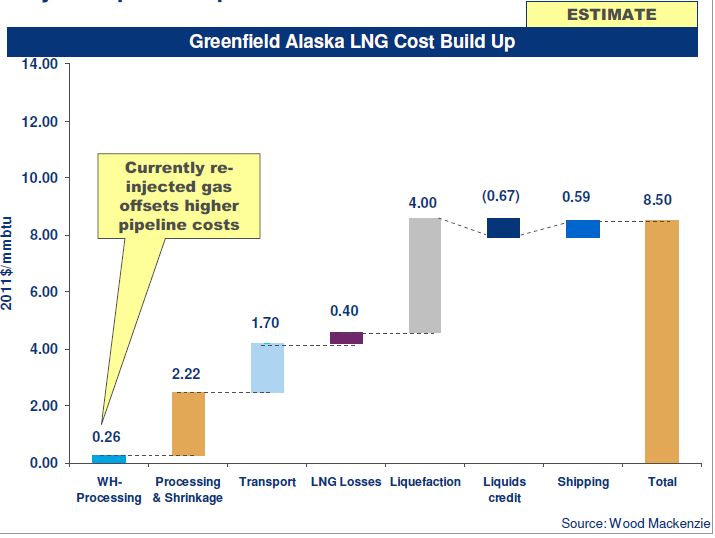
World Energy Outlook Unconventional Scenarios:
Golden Rules Case & Low Unconventional Case
International Energy Agency’s 2012 World Energy Outlook Special
Report on Unconventional Gas evaluated two scenarios:
   ♦ Golden Rules Case
      • Significant unconventional development globally (~1 million+ new
        unconventional wells drilled before 2035)
      • Diverse mix of sources of gas in most markets, suggesting an environment of
        growing confidence in the adequacy, reliability and affordability of natural gas
        supplies
      • An increased volume of gas, particularly LNG, looking for markets in the period
        after 2020 stimulates more liquid and competitive international markets
  ♦ Low Unconventional Case
      • Lack of public acceptance leads to only a small share of unconventional gas
        resources being accessible for development (unconventional gas production
        rises only slightly above 2010 levels by 2035)
      • The competitive position of gas in the global fuel mix deteriorates as a result of
        lower availability and higher prices
      • The requirement for imported gas is higher and some patterns of trade are
        reversed, with North America needing significant quantities of imported LNG,
        and the preeminent position in global supply of the main conventional gas
        resource-holders is reinforced

                                           6
Growth in Global Net Imports Also Makes LNG
Exports Attractive
Source: Golden Rules for a Golden Age of Gas, World Energy Outlook Special Report on Unconventional Gas, IEA, 2012, p.97
♦ Demand growth expected in non-OECD countries, particularly China
• China’s net gas imports only 14 bcm (~1.4 Bcf/d) in 2010
• IEA - China’ net imports could reach 77 bcm to 143 bcm (~7 Bcf/d to 14 Bcf/d) by 2020 and
119 bcm to 262 bcm (~ 12 Bcf/d to 25 Bcf/d) by 2035
7Potential Import Growth in Key Asian Countries
8Significant Uncertainty in Unmet Gas Demand Post-2020
Source: “Liquid Markets: Assessing the Case for U.S. Exports of Liquefied Natural Source: “China Keeps Import Options Wide Open,” World Gas Intelligence, July 25, 2012
Gas,” Brookings Energy Security Initiative, May 2012
♦ Brookings: In China, LNG shortfall of ~5 Bcf/d expected by 2020 (i.e., LNG supply < LNG demand)
♦ Global LNG outlook depends in part on supply-demand dynamics in China
• China potentially has competitive alternatives for gas supply
• Some estimates suggest China has 886 Tcf of shale gas reserves (~10x the size of Marcellus)
• China is exploring several import options apart from LNG (e.g., pipeline imports from Russia)
9Uncertainty in LNG Demand Driven by Uncertainty in Natural
Gas Demand and Indigenous Production Growth
10Alaskan LNG Success Will Depend On the Success of
Projects Ahead of It In Line
New LNG Projects
♦ In Australia, 9 Bcf/d already under construction = 3 “Alaskas”
♦ Others proposed for development before Alaska could be online = 10 “Alaskas”
• ~33.6 Bcf/d in North America (27.5 Bcf/d Lower-48 + 6.1 Bcf/d Canada) with at least 25 Bcf/d pre-Alaska
• ~4.5 Bcf/d in Australia
As discussed, LNG will also compete with indigenous production in the import
countries as well as other import options
Timing of this competition does not favor Alaska
♦ Wood Mackenzie: the “sweet spot” for LNG export projects to come online is between 2016-18
What will be the effect on LNG prices? Very difficult to predict.
♦ A supply glut by 2020 could led to a decline in Asian prices
♦ Indigenous unconventional development in import market could also dampen prices in Asia
♦ But high costs of these projects may continue to support high Asian prices
Irony that shift of ANS focus to LNG export to avoid direct competition with US
shale gas may be thwarted by the effects of shale gas on Asian prices via other
US/Canadian exports or indigenous shale development.
11~36 Bcf/d of Proposed LNG Export Capacity in
North America
Proposed North American LNG Export Terminals (As of Oct 16, 2012)
Capacity Status Status Announced Online
Project (Bcf/d) FTA non-FTA Date
[1] [2] [3] [4] [5]
United States:
Sabine Pass Liquefaction, LLC [a] 2.2 Approved Approved 2016/2018
Freeport LNG Expansion, L.P. and FLNG Liquefaction, LLC [b] 2.8 Approved Under DOE Review 2017
Lake Charles Exports, LLC [c] 2.0 Approved Under DOE Review 2016
Carib Energy (USA) LLC [d] 0.0 Approved Under DOE Review
Dominion Cove Point LNG, LP [e] 1.0 Approved Under DOE Review 2018
Jordan Cove Energy Project, L.P. [f] 1.2 Approved Under DOE Review 2017
Cameron LNG, LLC [g] 1.7 Approved Under DOE Review 2016/2017
Gulf Coast LNG Export, LLC [h] 2.8 Pending Approval Under DOE Review
Gulf LNG Liquefaction Company, LLC [i] 1.5 Approved Under DOE Review
LNG Development Company, LLC (d/b/a Oregon LNG) [j] 1.3 Approved Under DOE Review 2020
Southern LNG Company, L.L.C. [k] 0.5 Approved Under DOE Review
Excelerate Liquefaction Solutions I, LLC [l] 1.4 Approved Under DOE Review 2017
Golden Pass Products LLC [m] 2.6 Approved n/a
Cheniere Marketing, LLC [n] 2.1 Pending Approval Under DOE Review 2017
Main Pass Energy Hub, LLC [o] 3.2 Pending Approval n/a 2017
CE FLNG [p] 1.1 Pending Approval Under DOE Review 2017
Waller LNG Services, LLC [q] 0.2 Pending Approval n/a
Subtotal (Lower 48) [r] 27.5
Alaska [s] 2.5 2021/2024
Total United States [t] 30.0
Canada:
Kitimat [u] 2.0 Approved Approved 2016/2017
BC LNG Co-op [v] 0.3 Approved Approved 2014
Penn West [w] 0.5 2017
Progress Energy [x] 1.0 2018/2019
Shell [y] 1.8 2020
BG LNG [z] 0.6
Total Canada [aa] 6.1
Grand Total [ab] 36.1
Sources/Notes:
[a]-[r]: http://www.lngglobal.com/latest/applications-received-by-the-doe-to-export-domestically-produced-lng.html (accessed Nov 28, 2012)
[s]: Alaska Gas Port Authority Application to Export LNG (Docket No. 12-75-LNG) filed on July 12, 2012 before the Dept. of Energy.
[s]-[z]: EVA
12Australia Ahead of the Pack with ~9 Bcf/d Under
Construction
Australian LNG Projects
Capacity
Project Status Owner (Bcf/day) Cost Online
[1] [2] [3] [4] [5] [6]
North West Shelf Venture [a] Operational 2.20 1989
Darwin [b] Operational Conoco 0.48 Early 2006
Subtotal 2.68
Gorgon [c] Approved/Under Construction Chevron 2.00 $57 Billion 2014
Wheatstone [d] Approved/Under Construction Chevron 1.19 $35 Billion 2016
Curtis Island [e] Approved/Under Construction BG 1.13 $34 Billion 2014
Ichthys [f] Approved/Under Construction Inpex 1.12 $43 Billion Q4 2016
Gladstone [g] Approved/Under Construction Santos 1.04 $30 Billion 2015
PNG LNG [h] Approved/Under Construction Exxon 0.88 2014
Australia Pacific [i] Approved/Under Construction Conoco/Origin 0.60 $37 Billion 2015
Pluto [j] Approved/Under Construction Woodside 0.57
Prelude [k] Approved/Under Construction Shell 0.48
Subtotal 9.02
Browse [l] Proposed Woodside 1.60
Shell/Arrow [m] Proposed Shell/Petrochina 1.07
Interoil LNG [n] Proposed Interoil 0.67 2015
Asia Pacific [o] Proposed Conoco/Origin 0.60
Pluto 2 [p] Proposed Woodside 0.57
Subtotal 4.51
Grand Total 16.21
Sources:
Reuters and CNN Money.
13Many New Long Term Contracts Signed in 2011
Related to Australian LNG Projects
Long & Medium Term LNG Sales Contracts Concluded in 2011
Import Amount
Export Country/Exporter Purchaser Country (Bcf/d) Duration Extra Years Start
[1] [2] [3] [4] [5] [6] [7]
Australia & BG Portfolio [a] CHUBU ELECTRIC Japan 0.05 21 2014
Australia (QCLNG/BG) [b] TOKYO GAS Japan 0.16 20 2015
Australia (Gorgon) [c] KYUSHU ELECTRIC Japan 0.04 15 2015
Australia (APLNG) [d] KANSAI ELECTRIC Japan 0.13 20 2016
Australia (Wheatstone) [e] The Tokyo Electric Power Co. Japan 0.40 20 2017
Australia (Wheatstone) [f] KYUSHU ELECTRIC Japan 0.09 20 2017
Australia (Ichtys) [g] The Tokyo Electric Power Co. Japan 0.14 15 2017
Australia (Ichtys) [h] TOKYO GAS Japan 0.14 15 2017
Australia (Ichtys) [i] KANSAI ELECTRIC Japan 0.10 15 2017
Australia (Ichtys) [j] KYUSHU ELECTRIC Japan 0.04 15 2017
Australia (Ichtys) [k] OSAKA GAS Japan 0.10 15 2017
Australia (Ichtys) [l] TOTAL 0.12 15 2017
Australian LNG [m] = sum([a]-[l]) 1.51
Australian LNG % of Total [n] = [m]/[y] 40%
Qatar (QATARGAS) [o] CHUBU ELECTRIC/SHIZUOKA Japan 0.03 6 2014
Indonesia [p] KOGAS South Korea 0.09 13 2015
TOTAL Portfolio [q] KOGAS South Korea 0.26 18 2014
IBERDOLA Portfolio [r] BP Spain 0.05 10 January 2012
USA (CHENIERE) [s] BG GROUP 0.46 20 2015
USA (CHENIERE) [t] GASNATURAL FENOSA 0.46 20 12 2015
USA (CHENIERE) [u] GAIL 0.46 20 2017
USA (CHENIERE) [v] KOGAS 0.46 20 up to 10 2017
Other LNG [w] = sum([o]-[v]) 2.25
Other LNG % of Total [x] = [w]/[y] 60%
Total LNG [y] = sum([m],[w]) 3.77
Total LNG % [z] = [n]+[x] 100%
Source:
The LNG Industry in 2011 , GIIGNL, Page 6.
14Alaska LNG is Competitive But Stranded Gas
Advantage Offset by Infrastructure Requirements
Competition to Serve Asian LNG Markets
Source: “Alaska LNG Exports Competitiveness Study,” Wood Mackenzie, July 27, 2011
Source: “Liquid Markets: Assessing the Case for U.S. Exports of Liquefied Natural
Gas,” Brookings Energy Security Initiative, May 2012
♦ Brookings & Wood Mackenzie: Alaskan LNG competitive with other LNG suppliers
♦ But, significant uncertainty in project costs and timing
• Wood Mackenzie 2011 estimate ~$45 - $50 Billion project costs (21 million ton capacity)
• But, updated costs ~$45 - $65+ Billion (15-18 million ton capacity)
• Hence, delivered price might be higher than the $8.50/MMBtu due to updated project cost and scope
15Contract Pricing Uncertainty
Historically, LNG has served Asia priced under oil-linked
contracts
Asian buyers now looking for gas price-linked contracts
♦ Possibly Henry Hub-linked, or other Asian market index
♦ “Linkage”, of course, does not necessarily mean parity
But North American project developers want continuation of oil-
linked contracts
♦ Even Gulf Coast projects might require premium to Henry Hub
♦ Link to Henry Hub creates price volatility risk
Pricing uncertainty is creating project uncertainty since
contractual support is key to project success
16Summary of Uncertainties Facing Alaskan LNG
Export Project
Demand Uncertainty
♦ Need for LNG post-2020 is very uncertain (e.g., China’s needs will depend upon its
natural gas demand growth as well as growth in its indigenous production)
Competition Uncertainty
♦ Australia, British Columbia, Gulf Coast and other LNG and indigenous gas projects
Pricing/ Project Economics Uncertainty
♦ Oil-linked or gas-linked
♦ Panama Canal toll uncertainty may affect Gulf Coast competitors
Upstream Infrastructure Development Uncertainty
♦ Alaskan LNG exports contingent upon large pipeline build-out
• But, environmental and cost growth challenges seen in big pipeline projects
♦ Possible siting advantage in U.S. Gulf Coast due to existing infrastructure
Level of Government Support
♦ Large “stranded gas” advantage in British Columbia and Alaska, but pipeline
infrastructure disadvantage
♦ Uncertainty in U.S. export permit process
17Alaskan Project Evaluation Difficulty
♦ This set of risks creates a challenging project-evaluation problem for the
project developers and potential buyers deciding whether to commit to
long-term contracts.
♦ For private commercial parties, there is option value in waiting for
uncertainties to resolve.
♦ For the State, waiting for uncertainties to resolve may foreclose future
options and/or concede the market to competitors.
18Key Indicators of How Uncertainties Might Resolve
What should we be watching for over the next 12 months?
♦ DOE study release and US export permit process
• Politics of US LNG exports may get intense – will Alaska benefit?
♦ Cost “blowouts” in Australian projects
• Project delays and high costs may cause buyers to think Alaska
♦ Asian equity positions in competing projects and upstream assets
• Canadian government opposition may affect BC projects
• Possible for Alaska?
♦ Economic growth and indigenous gas supply (shales) and infrastructure
development in China.
• May take much longer to resolve
♦ US gas price rebound?
• Will we be talking again about the reemergence of the pipeline to the lower-48?
19The Brattle Group
The Brattle Group provides consulting and expert testimony in economics, finance, and regulation
to corporations, law firms, and governments around the world.
Many of our engagements are related to energy and utility regulation in such areas as:
Climate Change Policy and Planning Regulatory Strategy and Litigation Support
Cost of Capital Renewables
Energy Asset Valuation Risk Management
Fuel and Power Procurement Market Design and Competitive Analysis
Paul Carpenter specializes in the economics of the natural gas, oil and electric utility industries. He
holds a PhD in Applied Economics and an MS in Management from the Massachusetts Institute of
Technology, and a BA in economics from Stanford University. He is a Principal and past-Chairman of
The Brattle Group.
Steven Levine is a Principal of The Brattle Group who specializes in energy and regulatory economics,
with a particular focus on the natural gas and petroleum industries. He received a B.A. in economics
from Brandeis University and an M.B.A. with a concentration in finance from Columbia Business School.
Anul Thapa is an Associate of The Brattle Group with expertise in the regulation and economics of the
natural gas and electricity markets. He received an MBA with a concentration in finance from MIT Sloan
School of Management and a B.A. magna cum laude in Mathematics and Computer Science from
DePauw University.
20You can also read