ENERGY SAVING POTENTIAL OF PRIVATE ELECTRICITY CONSUMPTION BY FEEDBACK AND CONSULTING - FFE GMBH
←
→
Page content transcription
If your browser does not render page correctly, please read the page content below
1

ENERGY SAVING POTENTIAL OF PRIVATE ELECTRICITY
CONSUMPTION BY FEEDBACK AND CONSULTING
                         Dipl.-Ing. (FH) Anna Gruber: Forschungsgesellschaft für Energiewirtschaft mbH,
                                                                   Am Blütenanger 71, 80995 Munich,
                                                                    agruber@ffe.de, +49 89 158 121-62

                            Dr.-Ing. Serafin von Roon: Forschungsgesellschaft für Energiewirtschaft mbH

                    Dipl.-Ing. (FH) Marco Schwentzek: Forschungsgesellschaft für Energiewirtschaft mbH

                                                        BSc Johannes Frei: Vorarlberger Kraftwerke AG

                                                    Ing. Martin Schoenach: Vorarlberger Kraftwerke AG

Abstract
In the pilot project SM500 of the Vorarlberger Kraftwerke AG the impact of smart
metering and the simultaneous implementation of different advisory elements in private
households was to be identified. About 500 households were equipped with smart meters
and divided into three clusters, each with different advisory elements. In order to allow
comparison, two additional clusters (V1 with 140 customers and V2 with 630 customers)
were considered. The results show that the use of smart meters in combination with
different advisory elements exhibits potential energy savings, whose extent is depending
on the type, the quality and the usage intensity of the advisory elements.
The pilot project was academically accompanied by the Forschungsgesellschaft für
Energiewirtschaft mbH (Research Association for Energy Economics) in Munich. The
main task of the FfE was the development of the methodology, the plausibility check, the
processing of data and the reliable quantification of the energy savings.

Motivation
The use of smart meters offers several advantages for private consumers as well as for
power supply companies. For example, the consumers´ awareness regarding their energy
consumption can be increased by providing related information in a high time resolution.
For energy supply companies, smart meters may have a positive effect on power
distribution, tariff arrangement, the company’s strategic orientation and customer
loyalty. According to the EU directive 2009/72/EC, at least 80 % of the households have
to be equipped with smart meters until 2020, provided that the introduction of smart
meters is evaluated positively [1]. Within the scope of this project, the effect of chosen
advisory elements can be investigated systematically.
In Austria, the ordinance of smart metering was adopted on 24.04.2012 [2]. Austria will
implement this ordinance in several stages. By the end of 2015 10 % of all households
should be provided with smart meters by the power supply companies. By the end of
2017 70 % should be provided and by 2019 the minimum should be 95 %.

Approach and methodology
The major objective of the project is to determine the impact of the different advisory
elements on energy consumption of private households in Vorarlberg. Therefore, a
comparison of historical and current energy consumption and a comparison of clusters
with and without advisory elements are necessary.
2 Scientific monitoring of the SM500 project of the Vorarlberger Kraftwerke AG
At the beginning of the examination, the historical data has to be checked for
plausibility. For this purpose, the consumption in the years 2009 and 2010 is compared
to the consumption in 2011. In case of extreme deviations which cannot be explained by
behaviour modification nor by the use of new technologies, the customer is excluded from
further analyzes. If extreme consumption deviations are limited to only one of the years,
this year is excluded solely. Customers with an electric heating are excluded from the
analyses as well, as in their case weather conditions interfere with the effect of saving.
The validation of available customer’s information on electrical hot water generation is
based on a load and regression-analysis (figure 1). Thereby, the relation between
average consumption of every customer during the high-tariff (ht) period and the low-
tariff (lt) period in the summer months is formulated. The higher the lt-consumption in
comparison to the ht-consumption is during the summer, the higher the plausibility of
hot water generation by electricity is. The electrical hot water generation normally starts
at night because of the two tariff system used by the customers - with a differentiation of
high- and low tariff. The water heating takes place during the lt-period, in order to use a
more favorable price per kilowatt-hour. All customers, who are below the defined limit
curve, have an electrical water heating. In addition, the daily load curves of these
customers are analyzed in detail. Customers with a nightly peak are allocated to the
ones with an electrical water heating.
1,600 ht/lt consumption summer
1,400
1,200
average ht [kWh/month]
1,000
800 water heating: no
water heating: yes
600 limit curve
trend: no
400
trend: yes
200
0
-200
0 200 400 600 800 1,000
average lt [kWh/month]
Figure 1: Relation between ht- and lt-consumption (summer) of every customer
in the S-groups, limit curve for electrical water heating
For the analysis of energy consumption a maximum sample size is chosen to gain
reliable results. Then, the consumption figures of the different customers are
standardized, because the groups include customers with different consumption-levels. If
there was no standardizing, the energy savings of larger consumers would dominate the
smaller ones. This proceeding is explained in the following example. Figure 2 shows two
customers with significantly different consumption.Scientific monitoring of the SM500 project of the Vorarlberger Kraftwerke AG 3
consumption of the customer
18,000
16,000 15,600 15,050
14,500 14,600
consumption in kWh/a
14,000
12,000
10,000
8,000
6,000
4,000 2,550 2,450 2,375 2,500
2,000
©FfE Illwe-0001#P Smart Meter Versuch_mbH_00069
0
2009 2010 Apr 11 - Mar 12 historical mean
value of '09 and
customer 1 customer 2
'10
Figure 2: Comparison of the consumption during the period of 12 month
Figure 3 shows the absolute and standardized savings of each customer. If the absolute
savings are considered only, the influence of the larger consumer is stronger.
absolute saving of the customer standardized saving of the customer
500 6%
450
450 customer 1
5%
5% customer 2
absolute saving in kWh/a
400 customer 1
standardized saving
350 customer 2
4%
300
3%
250 3%
200
2%
150 125
100
1%
50
©FfE Illwe-0001#P Smart Meter Versuch_mbH_00070 ©FfE Illwe-0001#P Smart Meter Versuch_mbH_00071
0 0%
total savings 1
Figure 3: Absolute and standardized savings of both customers
Figure 4 shows the absolute and standardized savings of the group. If the standardized
savings are chosen, both customers have the same influence on group savings, although
individual savings are totally different.
absolute and standardized saving of the group
5%
absolute
absolute and standardized saving
standardized 4.0 %
4%
3.3 %
3%
2%
1%
©FfE Illwe-0001#P Smart Meter Versuch_mbH_00080
0%
1
Figure 4: Absolute and standardized savings of the group4 Scientific monitoring of the SM500 project of the Vorarlberger Kraftwerke AG Simultaneously to the standardized analysis, an analysis of absolute savings is prepared. The evaluation of the consumption data of the 12 months provides reliable results. Advisory elements The main advisory element is a smart meter from the Yello Strom GmbH. The consumption data is captured once a second. In this study, the analyses of the consumption and the load curves are based on summarized values in a range of 15 minutes, which were transmitted to the server of the Illwerke VKW. E’klar-Meter is an additional software tool for online visualization of energy consumption at the computer at home. The values are updated every second. When using the smart meter there is the possibility to utilize the e’klar- Stromtagebuch (“e’klar-consumption-diary”) via internet, which enables visualization of historical consumption data (minimum data rates; one value every 15 minutes) as a graph or a table. The customer can choose the period, for example a day, a week or a month. In addition to energy consumption, the customer has an overview over the costs. Another advisory element is the monthly invoice of the consumption of the month before. A more detailed feedback tool is an additional monthly information package composed of savings instructions and a consumption report. This monthly energy report presents the consumption data in daily or monthly values. Furthermore, the basic consumption of every day is shown and the days are separated into workdays and weekends. In addition, a comparison of historical consumption of the last few months is made in graphical and tabular form. There is a personal on-site energy consulting carried out by the employees of the Illwerke VKW. They are analyzing the consumption behavior of the customer by using a load-curve tool, which has been developed within the project. Finally, the customer is advised regarding energy efficiency and energy savings. Additional to the advisory elements, the consumption behavior of the participants of the „Stromsparmeisterschaft” (Energy-Saving-Competition) between Nütziders and Zwischenwasser was examined. This study has been started before the smart meter project. Participants of the competition had to fill in their consumption data on an internet platform and received a present as a reward. For collecting the data of those customers, an employee of the Illwerke VKW evaluated the energy meters of these customers each month. Definition of the customers In autumn 2009 the pilot project was presented to the public. Interested clients could apply for participation of the project at the Illwerke VKW. Nearly 1.000 private households were interested, but only 500 could be chosen and provided with smart meters. 10 per cent of the participants were employees of the Illwerke VKW. Two of the requirements for participation at the project were, for example, available historical consumption data of the last two years and the technical facilities to install a smart meter device.
Scientific monitoring of the SM500 project of the Vorarlberger Kraftwerke AG                          5

Definition of the cluster
Five clusters were defined for the determination of the consumption reduction caused by
smart meters and the effect of different advisory measures. The clusters S1, S2 and S3
consist of households with smart meters with different advisory elements. A monthly
invoice was delivered to all households of those smart meter clusters. The customers of
cluster S2 received an additional personalized energy report. Only customers of cluster
S3 received energy consulting. In order to enable comparison, two additional clusters
(V1, V2) without smart meters were defined. The customers of V1 participated in a
competition and were monitoring electricity savings and received a monthly invoice. A
sixth of V1 customers were provided by energy consulting as well. The customers, who
were clustered in V2, were not aware of their function as a control group. They got their
normal annual invoice. Table 1 shows the number of customers in the cluster, as well as
the advisory elements.

Table 1:          Smart meter- and comparison-cluster – the different advisory elements

                number of    feedback- & advisory       consumption
      Cluster                                                                    comments
                customers         elements                recording

                            · indication per second
        S1        211       · internet platform        every 15 minutes
                            · monthly invoice
                                                                           A part of the smart-
                            · similar to S1                               meter-users were VKW-
        S2        140       + monthly personal         every 15 minutes        employees.
                               energy report

                            · similar to S2
        S3        120                                  every 15 minutes
                            + energy consulting

                            · monthly invoice                                  Energy-saving-
        V1        142                                      monthly
                            · monthly local metering                            competition

                                                                          Selection consistent with
        V2        633                                      annually
                                                                                 S1-S3 & V1

Period of investigation
The period of investigation of the pilot project is about 15 months and started in March
2011 and came to an end in May 2012. The consumption data was collected in a range of
15 minutes for the clusters S1, S2 and S3. The data of the clusters V1 and V2 was
collected monthly respectively annually. In order to have a high number of installed
smart meters and a reliable real (no trend) data volume of V2 customers, the analysis
included the period from April 2011 to March 2012. These are exactly 12 month.

Results
The time-based development of the consumption in the different clusters is shown in
figure 5. There is a significantly stronger seasonal influence than an influence of the
6 Scientific monitoring of the SM500 project of the Vorarlberger Kraftwerke AG
advisory elements. Therefore, it is necessary to evaluate the consumption data over a
period of 12 month to receive reliable results.
140 %
consumption w.r.t. historical
120 %
100 %
consumption
80 %
60 %
40 %
20 %
©FfE Illwe-0001#P Smart Meter Versuch_mbH_00072
0%
Mar 11
Jan 11
Apr 11
Jul 11
Nov 11
Jan 12
Apr 12
Feb 11
Sep 11
Feb 12
Mar 12
Aug 11
Dec 11
Jun 11
Oct 11
Jun 12
May 11
May 12
S1 S2 S3 V1
Figure 5: Monthly consumption related to the historical consumption
Figure 6 shows the historical consumption and the consumption of the current
investigation period from April 2011 to March 2012. Comparing the period from April to
March with the historical basis (black line), it is obvious, that there are energy savings
within all clusters. However, the savings in the comparison group V2 are the smallest.Scientific monitoring of the SM500 project of the Vorarlberger Kraftwerke AG 7
relation to the historical basis 100 %
80 %
60 %
40 %
20 %
S1 S2 S3 V1 V2
©FfE Illwe-0001#P Smart Meter Versuch_mbH_00073
0%
2009 2010 April to March
Figure 6: Consumption during the investigation period and the years 2009 and
2010 related to the historical reference value
In conclusion, the higher the quality and the intensity of the advisory elements are, the
higher the energy savings are (table 2).
Table 2: Energy savings in each cluster
additional
Savings in
feedback- & consumption savings in
Cluster comments comparison to
advisory elements recording comparison to
2009 & 2010
cluster V2
· indication per
second
S1 every 15 minutes 3.38 % 0.63 %
· internet platform
· monthly invoice
A part of the
· similar to S1 smart-meter-users
S2 + monthly personal every 15 minutes were VKW- 6.62 % 3.87 %
energy report employees.
· similar to S2
S3 every 15 minutes 8.43 % 5.68 %
+ energy consulting
· monthly invoice
Energy-saving-
V1 · monthly local monthly 6.90 % 4.15 %
competition
metering
Selection
V2 annually consistent with S1- 2.75 %
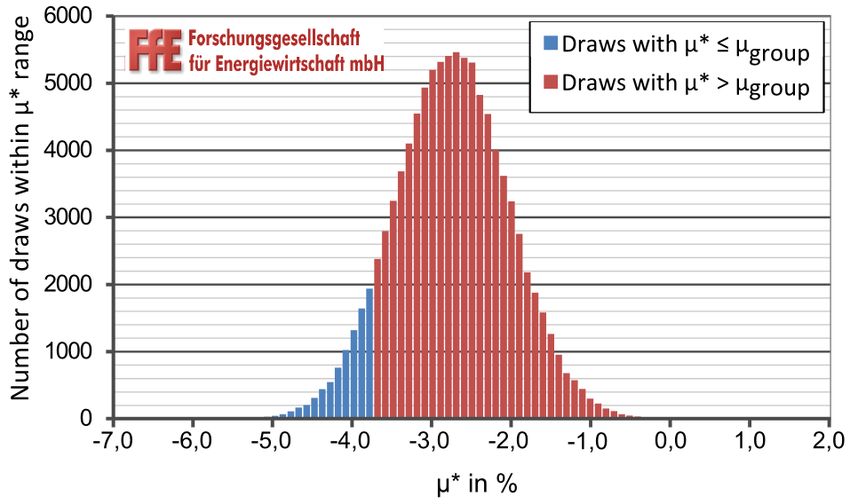
S3 & V18 Scientific monitoring of the SM500 project of the Vorarlberger Kraftwerke AG Cluster V2 shows general savings without the use of smart metering or advisory elements in comparison to 2009 and 2010. For that reason, the energy savings of the clusters S1, S2, S3 and V1, which refer to advisory measures, correlate with additional savings compared to the savings of cluster V2 (green column). Considering all smart meter clusters, the lowest savings (0.6 %) are achieved in cluster S1. The sending of a personal monthly energy report improves the savings to 3.9 % (cluster S2). Better results (4.2 %) are achieved by cluster V1, which is without smart metering but part of the energy competition. In cluster V1 the personal contact to the VKW meter-reader could have had a similar effect as the monthly energy report in cluster S2. This fact should be considered in further smart meter projects. The highest savings (5.7 %) are achieved via personal energy consulting in cluster S3. Even if the employees of Illwerke VKW are implicated, the results are basically the same. The savings of cluster S1 improve a little to 1.0 %, the additional savings of S2 decrease a little to 3.1 % and the cluster S3 is nearly stable with 5.6 %. Validity of the results The following described methodology is used in order to determine the significance of the observed consumption change in every cluster. In simple terms, this method defines the probability of the average observed consumption change µ in one group (µgroup) assuming that usually, only such consumption changes occur which are comparable to the average consumption change µV2 in cluster V2. For a group with N electricity consumers a random value for each consumer is chosen from a K-element pool of the comparison group V2. It is possible that the same value is chosen again (binominal distribution). For the pool the consumption change of the consumers in cluster V2 is measured, that is why a pool of 605 possible values exists. In other words, for a smart meter group with 150 participants (N=150) a consumption change is chosen randomly for each participant (150 times) from a pool of 605 possible values (K=605). The mean value µ* is formed out of the N selected values. This selection process is repeated 1.000.000 times. Finally, the measured mean value µgroup is compared to the calculated mean values µ* on the basis of the pool of the comparison group V2. Therefore, it is counted how many of the 1.000.000 calculated µ* have a greater absolute deviation from µV2 than µgroup from µV2. This number is divided by the number of selections. The following result gives an idea of the significance of the measured consumption change. Figure 7 shows a histogram of 1.000.000 selections of a group with 191 participants. The measured deviation is set to -3.7 %. Each selection with a mean deviation equal or less than -3.7 % is pigmented blue. Each selection with a mean deviation greater than -3.7 % is pigmented red. The relation of the number of red colored results to the number of all selections is equivalent to the significance of the deviation. For this example it is about 91.7 %.
Scientific monitoring of the SM500 project of the Vorarlberger Kraftwerke AG          9

Figure 7:             Distribution of the calculated mean value µ*

Table 3 shows the probability of a randomly appearing measured decrease of power
consumption.

Table 3:           Probability of the outcome

                                        Probability, that a deviation of the power
            Cluster       Savings     consumption occurs, which is greater than the
                                                observed deviation in V2
              S1           3.4 %                        9.281 %
              S2           6.6 %                        0.029 %
              S3           8.4 %                        0.000 %
              V1           6.9 %                        0.001 %

The probability that the consumption reduction in the measured or in a greater
dimension is randomly, is at 0.029 % for S2, less than 0.000 % for S3 and at 0.001 % for
V1. Therefore, the measured consumption reduction occurs particularly due to the use of
the feedback- and advisory elements. Solely the measured deviation in cluster S1 occurs
randomly and therefore the result cannot be explained by the usage of feedback and
consulting.

Extrapolation to Vorarlberg
The extrapolation of the saving potentials by the use of feedback- and advisory elements
in Vorarlberg is based on two scenarios. In both scenarios every household is provided
with smart meter. In addition, advisory elements like e’klar-Meter and e’klar
Stromtagebuch are used. Furthermore, every household gets a monthly invoice and an
energy report. Those advisory elements are highly automatable and have the highest
10 Scientific monitoring of the SM500 project of the Vorarlberger Kraftwerke AG
potential to be used in reality in case a smart meter is installed. The differences between
the two scenarios are the following:
1. In a “maximum scenario” every household achieves similar high-percentag
savings like the customers in cluster S2,
2. In a “moderate scenario” the customers are separated in sub-groups similar to the
Capgemini-Study [3]. This study is separated into 20 % of enthusiasts, 40 % of
followers and 40 % of uninterested persons. It is assumed that the enthusiasts
achieve equal savings to cluster S2 (3.9 percent). The uninterested persons
achieve no savings and the followers are in-between at 1.4 percent.
The power consumption for electric heating is subtracted from the private total power
consumption. For the residual power consumption the savings are calculated for both
scenarios. The absolute savings are between 8 GWh/a in the moderate scenario and
24 GWh/a in the maximum scenario. The cost savings for a household with an average
power consumption and a saving success like cluster S2 are about 30 € per year.
According to Illwerke vkw, the costs for the customers are at 8 to 23 € per year. The
savings for Illwerke vkw are just at 3 to 8 € per year (based on the assumption of a
wholesale price of 50 €/MWh) because of the almost constant costs of the grid.
Comparison of the results with other studies
In other smart meter projects and investigations about the influence of feedback- and
advisory elements, the savings are quite similar to those in cluster S1 and S2. In table 4
the savings of the other projects are shown. No smart metering was used in the Velix
project.
Table 4: Saving potentials in other studies
Velix Intelliekon E-Motivation IZES Praxistest
Reduction of the power 3 % to 4.5 %
consumption related to the 2.7 % 3.7 % The comparison group 1.7 %
comparison group also used smart meters
Source: Velix [4, 5]; Intelliekon [6, 7]; E-Motivation [8]: IZES-Praxistest [9]
Conclusion
Based on the academic supervision and the examination of the savings of the pilot
project, there is the following key message:
The use of smart meters in combination with feedback- and advisory elements causes a
consumption reduction. The amount of the reduction is dependent on the quantity, the
quality and the frequency of usage of these advisory elements. These parameters
influence the amount of savings essentially. Savings due to smart metering in
cooperation with a web portal and a monthly invoice are just at about 1 %. Savings
according to the PwC-Study [10] are at about 3.5 % and thus clearly higher. The
continuously external impulse (for example the meter-readers of the power competition
or the personal energy report in cluster S2 and S3) has a significant influence on the
amount of savings. An additional energy consulting (cluster S3) can clearly improve the
amount of savings once again. So far, one year has been investigated. That is whyScientific monitoring of the SM500 project of the Vorarlberger Kraftwerke AG 11
sustainability of the measured savings cannot be guaranteed. It has to be examined how
savings in the different clusters will develop regarding a longer investigation period.
Bibliography:
[1] Richtlinie 2009/72/EG des Europäischen Parlaments und des Rates über
gemeinsame Vorschriften für den Elektrizitätsbinnenmarkt und zur Aufhebung
der Richtlinie 2003/54/EG in: Amtsblatt der Europäischen Union. Brüssel:
Europäische Union, 2009
[2] Intelligente Messgeräte-Einführungsverordnung - IME-VO. Wien:
Bundesministerium für Wirtschaft, Familie und Jugend, 2012
[3] Analyse der Kosten - Nutzen einer österreichweiten Smart Meter Einführung.
Wien: Capgemini Consulting Österreich AG, 2010
[4] Staake, T.: Verbesserung der Kundenansprache und Steigerung der
Energieeffizienz mit Velix (Vortrag), Bits to Energy Lab, Frankfurt, 2011
[5] Staake, T.: Abschluss-Auswertung „Velix“ (Vortrag), Bits to Energy Lab, Zürich,
2012
[6] Birzle-Harder, B.; Deffner, J.; Götz, K.: Lust am Sparen oder totale Kontrolle?
Akzeptanz von Stromverbrauchs-Feedback. Ergebnisse einer explorativen Studie
zu Feedback-Systemen in vier Pilotgebieten im Rahmen des Projektes Intelliekon,
Institut für sozial-ökologische Forschung (ISOE), Frankfurt am Main, 2008
[7] Schleich, J.; Klobasa, M.; Brunner, M.; Gölz, S.; Götz, K.; Sunderer, G.: Smart
Metering in Germany and Austria – results of providing feedback information in
a field trial, Fraunhofer Institute for Systems and Innovation Research
(Fraunhofer ISI), Karlsruhe, 2011
[8] Kollmann, A.; Moser, S.; Markl, B.; Friedl, C.; Goers, S.; Greibl, E.; Schäffler, H.;
Ripfl, R.; Cieczynski, S.; Sametinger, K.; Wohlfarth, K.: Ergebnisse aus dem
Projekt E-MOTIVATION – Energieabrechnungs-Optimierung zur
Endverbrauchermotivation: Executive Summary zum Thema Effekte der
Verbrauchsinformation, Energieinstitut an der Johannes Kepler Universität
Linz; Forschungsgruppe Energie- & Kommunikationstechnologien, Linz, 2011
[9] Hoffmann, P.; Frey, G.; Friedrich, M. Dr.; Kerber-Clasen, S.; Marschall, J.;
Geiger, M. Dr.: Forschungsbericht Praxistest „Moderne Energiesparsysteme im
Haushalt“. Saarbrücken: IZES gGmbH, 2011
[10] Haider, B.; Smole, E.: Studie zur Analyse der Kosten- Nutzen einer
österreichweiten Einführung von Smart Metering. Wien:
PriceWaterhouseCoopers, 2010You can also read