What is the future of KTM?1 - By Dr. Ong Kian Ming Atticus Poon Teck Seong2 - Penang Institute
←
→
Page content transcription
If your browser does not render page correctly, please read the page content below
What is the future of KTM?1

                                                                   By

                                             Dr. Ong Kian Ming

                                   Atticus Poon Teck Seong2

                                                      Jurleo Jurit3

           Penang Institute in Kuala Lumpur (PI in KL)

1 Addition thanks to Sophia Jamal, Penang Institute intern, for research inputs.
2 Atticus was an intern with Penang Institute from January to March 2018.
3
  Jurleo was an intern with Penang Institute from August to September 2017.

                                                                                   1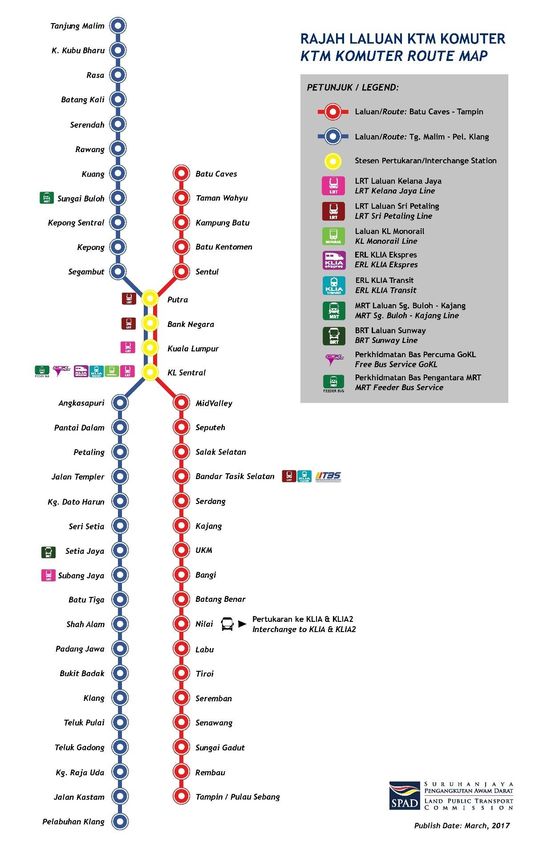
The recent hype over upcoming railway developments such as the Light Rail Transit (LRT) Extension,
the Mass Rapid Transit (MRT), the East Coast Rail Line (ECRL) and the High-Speed Rail (HSR) from Kuala
Lumpur to Singapore, appears to have cast the oldest railway operator in the country, Keretapi Tanah
Melayu, better known as KTM4, by the wayside. Ridership on the KTM Komuter Services in the Klang
Valley has been declining and could decline even further as it suffers from competition from the
further expansion of the LRT and MRT lines. On top of this, the expected rollout of the Rail Network
Access Agreement (RNAA) that will allow other cargo operators to use the train tracks currently used
exclusively by KTM will almost certainly reduce its cargo operations revenue. Currently, the only bright
spark in KTM’s ridership is the Electric Train Service (ETS), initially from Kuala Lumpur to Ipoh, and now
extended to the north up to Padang Besar, Perlis and to the south to Gemas in Negeri Sembilan.

How much will the completion of the double tracking and electrification project from Gemas to Johor
Bahru help increase KTM’s revenue and profitability? Will the double track project upgrading in the
Klang Valley increase the reliability of KTM’s service and attract more passengers and revenue for KTM?
Will KTM’s relationship with the Railway Asset Corporation (RAC), the statutory body which owns the
KTM stations and the tracks, help or harm KTM’s profitability moving forward, as RAC seeks to
monetize more and more of its physical assets?

This report will examine these issues and by doing so, shed some light on the answer to the question
of a viable future for KTM in this country.

4While KTM is the popular name, the actual name of the entity which currently exists is Keretapi Tanah Melayu Berhad (KTMB), a
company which is 100% owned by the Ministry of Finance Incorporated. This report will use the popular name which is KTM in place of the
name of the legal entity, KTMB.

                                                                                                                                     2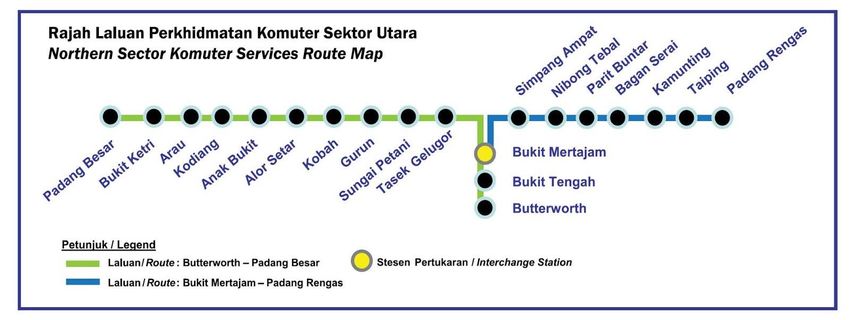
Table of Contents
1      History and Purpose of KTM ........................................................................................................... 5
2      Understanding the components of KTM’s revenue stream ........................................................... 7
    2.1       KTM Komuter .......................................................................................................................... 7
    2.2       KTM Intercity......................................................................................................................... 11
    2.3       KTM Cargo ............................................................................................................................. 13
    2.4       KTM Electric Train Service (ETS)............................................................................................ 16
    2.5       Other services ....................................................................................................................... 17
3      Evaluating the financial performance of KTM .............................................................................. 19
    3.1       Evaluating the financial performance of KTM Group ........................................................... 19
    3.2       Government subsidizing KTM’s Financing Costs................................................................... 24
    3.3       Evaluating the finances of KTMB’s subsidiaries .................................................................... 25
    3.4       KTM as a going-concern ........................................................................................................ 26
4 The Railway Asset Corporation (RAC), the Railway Network Access Agreement (RNAA) and the
impact on KTM ...................................................................................................................................... 27
5      Other challenges for KTM ............................................................................................................. 30
    5.1       Delays in Infrastructure Upgrades ........................................................................................ 30
    5.2       Recent delays and service disruptions .................................................................................. 33
    5.3       Ticket integration with other rail operators in the Klang Valley........................................... 35
    5.4       Competition to KTM from other public transport operators ............................................... 36
6      An alternative model to ensure KTM’s survival? .......................................................................... 39
7      Closing Remarks ............................................................................................................................ 42

                                                                                                                                                      3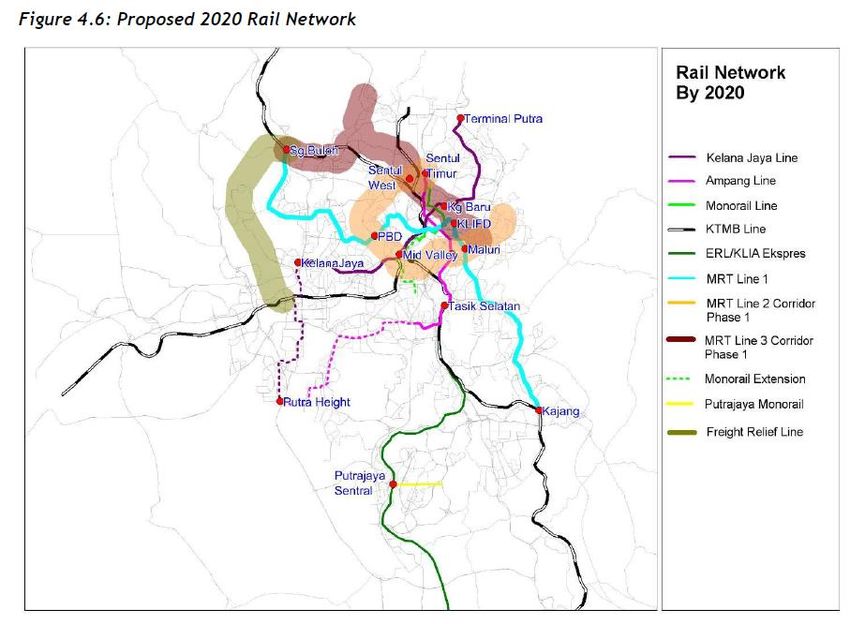
Table of Figures
Figure 1: Route Map for the KTM Komuter service in the Klang Valley. Source: Suruhanjaya
Pengangkutan Awam Darat (Land Public Transport Commission) ......................................................... 8
Figure 2: Route Map for the KTM Komuter Service in Norther Peninsular Malaysia. Source: KTM
website. ................................................................................................................................................... 9
Figure 3: Quarterly Ridership Figures for KTM Komuter ...................................................................... 10
Figure 4: Daily Ridership Figures for KTM Komuter .............................................................................. 10
Figure 5: Yearly Ridership Figures for KTM Diesel Intercity Train Service ............................................ 11
Figure 6: Freight Traffic for KTM Cargo................................................................................................. 14
Figure 7: Revenue for KTM Cargo ......................................................................................................... 15
Figure 8: ETS Ridership Figures from 2010 until 2017 .......................................................................... 17
Figure 9: KTMB's Finances 2000-2016 .................................................................................................. 19
Figure 10: Revenue for KTM Berhad Group for 2012-2016 .................................................................. 20
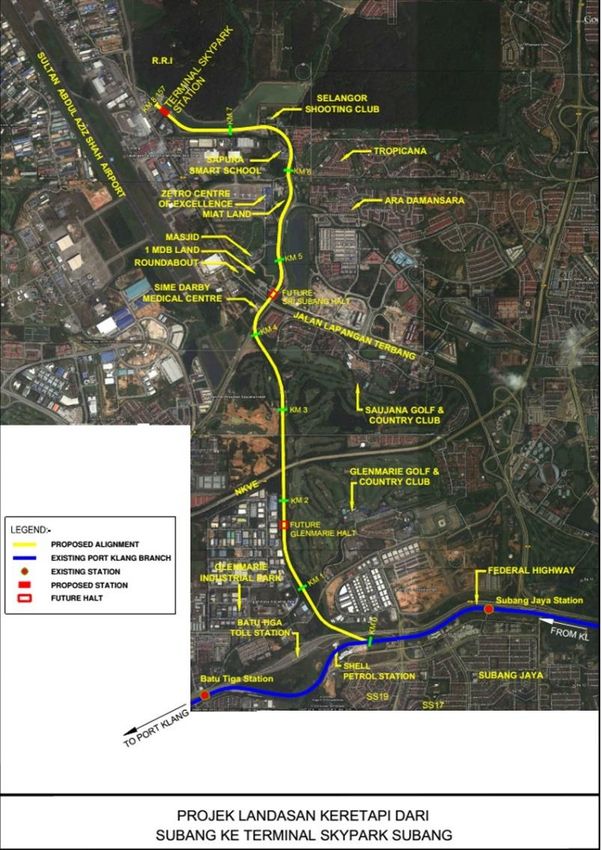
Figure 11: Delayed KTM extension from the old Subang Airport to the Subang Jaya KTM station ..... 32
Figure 12: The Proposed 2020 Rail Network in the Greater KL/KV Public Transportation Master Plan
which includes the Freight Relief Line from Sungai Buloh to Subang (highlighted in red) ................... 32
Figure 13: Ridership Figures for the KTM Komuter and the MRT SBK Line 1 ....................................... 37
Table of Tables
Table 1: Yearly Ridership Figures for KTM Diesel Intercity Train Service ............................................ 11
Table 2: Freight Traffic for KTM Cargo .................................................................................................. 14
Table 3: Freight Traffic for KTM Cargo .................................................................................................. 15
Table 4: Total Growth of GDP (Transportation & Storage Sector), KTM Cargo Revenue and KTM Cargo
Traffic from Year 2010 to 2016 ............................................................................................................. 16
Table 5: KTMB’s Revenue, Net Profit / Loss (After Tax) and Finance costs 2000-2016 ........................ 20
Table 6: Revenue Breakdown for KTM Berhad Group (%).................................................................... 21
Table 7: Percentage of contribution of different revenue streams (%)................................................ 21
Table 8: Government Compensation to KTM for Uneconomic Services .............................................. 22
Table 8: Income Statement of KTMB Group from 2010 to 2016 .......................................................... 23
Table 10: Summary of Details of Given Government Term Loans Provided to KTMB at ‘Subsidised’
Rates and Repayment Periods .............................................................................................................. 25
Table 11: Revenue for KTM Subsidiaries and KTM Joint Venture with MMC 2012-2016 .................... 25
Table 12: Disruptions in KTM Train Services in Recent Years ............................................................... 34
4
1 History and Purpose of KTM
The history of the railway network in Peninsular Malaysia can be traced back to the era of British
colonialism. Back then, the need for the transportation of natural resources like timber and tin ore
from the hinterland to coastal ports provided the raison d’etre for many of the early railways5. The
first railway line in Malaysia, opened in 1885, ran from Taiping to Port Weld, and was built for the
transportation of tin ore.6 These railways were owned and managed by separate companies such as
the Muar State Railway and the Selangor State Railway, to name a few. These separate railways were
then consolidated into a single company called the Federated Malay States Railways (FMSR) in 1901,
under the direction of the first British Resident-General, Frank Swettenham. The North-South line
connecting Seberang Prai in the North7 and Seremban in the south was completed in 1903.

The FMSR network came under Japanese control during the Japanese occupation of Singapore and
Malaya from December 1941 to September 1945. FMSR operated under its original name for up to
three years after the end of the war and changed its name to the Malayan Railway Administration
(MRA) to reflect the change of the Malayan Union to the Federation of Malaya. In 1962, its name was
translated into Malay as Keretapi Tanah Melayu or KTM for short. Three decades later, its name was
changed to Keretapi Tanah Melayu Berhad (KTMB) in 1992 as part of a corporation exercise.

In 1997, a consortium by the name of Merak Unggul, jointly owned by Renong (50%), DRB-Hicom
(25%), Bolton Bhd (20%) and Jasa Meta Sdn Bhd (5%), was allowed to manage KTM as part of a move
to reduce the government’s financial burden in enhancing and expanding the railway’s infrastructure.
However, in 2001, the government cancelled this arrangement and scuppered plans for a KTM
privatization due to the high debt levels of Renong and the failure of this consortium to inject capital
into KTM.8

Today, KTM is 100% owned by the Ministry of Finance Incorporated.

The main purpose of Peninsular Malaysia’s railway network has changed since its colonial origins.
Initially, railway companies were privately owned and served purely economic interests such as
transportation of tin and coal to the ports in the West coast. The emphasis on economic and extractive
functions reflected the priorities of the British administration. In contrast, little emphasis was placed
on intercity connectivity and passenger travel. However, when Malaya gained independence,
connectivity became a central element in the operation of the railway. In tandem with the growing

5 Source: Amarjit Kaur, "The Impact of Railroads on The Malayan Economy, 1874-1941," The Journal of Asian Studies 39, no. 4 (1980): 694,
doi:10.2307/2055178.
6 http://www.mysinchew.com/node/94363
7 Ibid, p. 695
8 https://www.thestar.com.my/business/business-news/2011/12/21/many-wonder-why-mmcs-interested-in-railway-and-how-it-can-turn-

it-around/

                                                                                                                                      5
population, the focus of KTM (then MRA) shifted away from transportation of natural resources to the
transportation of passengers and other types of cargo.
The reliance on KTM for long distance intercity travels, for example between Penang and KL, KL and
Singapore, and to Kota Bahru in the east coast, peaked in the first two decades of post-independence.
This was largely due to the limited and fragmented road network in Peninsular Malaysia. As Peninsular
Malaysia experienced rapid industrialization in the 1980s and 80s, the road network expanded
significantly. At the same time, the focus of economic activities also shifted from a resource-based
economy in areas which were connected by KTM to a manufacturing-based economy in areas along
the West Coast of Peninsular Malaysia.
By the time the North South Expressway (NSE) was fully operational in 1994, the transport landscape
has shifted almost completely to being automobile and road-based especially for intercity travel.
Towns like Kluang in Johor, an important commercial center that is serviced by KTM, were completely
bypassed by the NSE. The railway network in Peninsular Malaysia gradually shrunk as spur lines (short
secondary tracks branching out from the principal artery of the rail system) like the Batu-Arang, Port
Dickson and Teluk Intan tracks went out of service and were dismantled. For a period, there was little
or no new investment in rail infrastructure and rail modernisation. It was only after the launching of
the start of the double track and electrification project in the late 1990s that the railways started to
regain back some attention. Even then, railways were not envisioned to be playing a major role in both
passenger and freight transport moving forward.
Today KTM’s operations span all states except for Terengganu with two main rail lines running from
Padang Besar, Perlis to Johor Bahru along the West Coast of Peninsular Malaysia and from Gemas in
Negeri Sembilan to Tumpat in Kelantan. But its importance as a form of inter-city transportation has
waned considerably in the face of better road networks, greater competition from express buses and
more recently, cheaper air fares via low cost airlines.
62 Understanding the components of KTM’s revenue stream
To understand KTM’s future moving forward, we must firstly understand its present situation from a
business and service offering perspective. We need to understand the sources of KTM’s revenue,
changes in the segments of these revenue streams and future projects stemming from the various
service offerings.
Today, KTM has diversified revenue streams and operates a range of railway services in Peninsular
Malaysia. As mentioned previously, KTM is present in all states in Peninsular Malaysia except for
Terengganu. This section of the report will analyse the different components of KTM’s operations,
namely the intra-city commuter services, cargo, electric train services and intercity services as well as
some ancillary businesses such as advertising and car park management.
2.1 KTM Komuter
KTM Komuter is an intra-city commuter service introduced in 1995 to serve the Klang Valley region
(which includes Kuala Lumpur) and parts of southern Perak and Negeri Sembilan. Two lines currently
serve the Klang Valley, namely the Batu Caves – Tampin / Pulau Sebang line and the Tanjung Malim –
Port Klang line, with a total of 55 KTM Komuter stations: 29 stations along the Batu Caves – Gemas
route; and a further 22 stations along the Tanjung Malim – Port Klang route. Both lines are connected
by 4 stations (KL Sentral station, the Kuala Lumpur station, the Bank Negara station and the Putra
station) which are all located in the city centre of KL. Figure 1 below shows the route map for the KTM
Komuter intra-city service in the Klang Valley for all the stations at the time of writing.
7Figure 1: Route Map for the KTM Komuter service in the Klang Valley. Source: Suruhanjaya Pengangkutan Awam Darat
(Land Public Transport Commission)
8In 2015, with the completion of the double tracking and electrification project for the Ipoh-Padang
Besar route, KTM commuter services were introduced in the Northern region servicing mainland
Penang, Kedah, Perlis and Northern Perak. For the northern sector, there are two lines originating
from Butterworth, namely the Butterworth – Padang Besar line and the Butterworth – Padang Rengas
line (See Figure 2 below).
Figure 2: Route Map for the KTM Komuter Service in Norther Peninsular Malaysia. Source: KTM website.
Train frequency varies from route to route and is also contingent on the travel period. In the Klang
Valley, train frequency is every 15 minutes during peak hours and 30-90 minutes during off-peak hours,
whereas in the North, frequencies are between 30-60 minutes during peak hours and 2-3 hours during
off-peak hours. In the Klang Valley, waiting times are expected to be halved to 7.5 minutes during peak
hours after the completion of the RM1.4 billion Klang Valley Double Track (KVDT) project in 2019.9
(See discussion below on train delays affecting KTMB).
Figures 3 and 4 below show the monthly and daily ridership figures respectively for KTM Komuter from
Q1 2014 to Q4 201710. Based on these figures, ridership for the KTM Komuter has been declining since
Q4 2015. What are the possible reasons for this decline? Some reasons are raised here. Firstly, in
December 2015, travel fares for KTM Komuter were increased from 11 sen per km to 15 sen per km.
This increased the price of KTM Komuter tickets, with an increase of RM7.10 as the highest increase
for a single trip 11 . Secondly, in May 2016, KTM started its Klang Valley Double Tracking (KVDT)
upgrading project (expected to be fully completed in 2019). During this period, peak hour train
frequency remains at 15 minutes. However, off-peak frequency lengthens from 30 minutes to one
hour.12 Thirdly, the launch of the MRT Sungai Buloh-Kajang Line 1 in July 2017 took away passengers
9 http://www.thestar.com.my/news/nation/2016/12/14/liow-ktm-komuter-wait-times-to-be-reduced/
10
Unfortunately, the Ministry of Transportation does not provide a breakdown for the KTM Komuter services in the Klang Valley and in the
Norther Sector.
11 https://www.thestar.com.my/news/nation/2015/11/02/new-ktm-komuter-fares/
12 https://www.thestar.com.my/metro/community/2016/05/26/longer-waiting-time-for-train-users-tanjung-malimrawangport-klang-
routes-to-be-affected-by-project-t/
9from KTM Komuter, especially in places like Kajang and Sungai Buloh, where the KTM and MRT stations
are co-located. Daily ridership for the KTM Komuter peaked in Q1 2015 at 137,500 passengers. By Q4
2017, it had fallen to 89,554 passengers, translating to a 34.9% decline in a period of 3 years.
Quarterly Ridership of KTM Komuter ('000)
14000 12433 12375 12372 12599
11730 11516 11881
11278 11169
12000
10263 10254 10227
9783 9658
10000 9111
8239
8000 Dec 2015: May 2016:
Increased fare KVDT upgrading started
6000
4000 July 2017:
Full launch of
2000 MRT Line 1
0
Q1 Q2 Q3 Q4 Q1 Q2 Q3 Q4 Q1 Q2 Q3 Q4 Q1 Q2 Q3 Q4
2014 2014 2014 2014 2015 2015 2015 2015 2016 2016 2016 2016 2017 2017 2017 2017
Figure 3: Quarterly Ridership Figures for KTM Komuter13
Daily Ridership of KTM Komuter
150000
137500 136946
140000 135141 135956
128901 129141
130000 125311 125174
122736
120000 113633
112780111457
110000 106337 106132
99033
100000
89554
90000
80000
70000
Q1 Q2 Q3 Q4 Q1 Q2 Q3 Q4 Q1 Q2 Q3 Q4 Q1 Q2 Q3 Q4
2014 2014 2014 2014 2015 2015 2015 2015 2016 2016 2016 2016 2017 2017 2017 2017
Figure 4: Daily Ridership Figures for KTM Komuter14
13 http://www.mot.gov.my/en/resources/rail-statistic
14
http://www.mot.gov.my/en/resources/rail-statistic
102.2 KTM Intercity
Number of passenger (‘000)
Service Route Region 2010 2011 2012 2013 2014 2015 2016
Express JB Sentral – West 381 392 328 363 369 436.6 156.7
Rakyat15 Butterworth Coast
Express Hat Yai – KL West 477.1 388.1 376.2 400.5 391.3 482.6 152.3
Langkawi16 Sentral Coast
Senandung Ipoh – JB Sentral West 316.4 263 255.5 273 265.7 246.8 69
Sutera17 Coast
Express JB Sentral – KL West 235 368.7 354 208 177 107.4 0
Sinaran18 Sentral Coast
Express Wau KL Sentral – East 442.4 422.2 379.3 341 294.5 0 0
Tumpat Coast
Express JB Sentral – East 503 414.1 327.3 317 254 69.6 240
Timuran Tumpat Coast
Total: 2354.9 2248.1 2020.3 1902.5 1751.5 1343 618
Table 1: Yearly Ridership Figures for KTM Diesel Intercity Train Service
Yearly Ridership for KTM Diesel Intercity Train Service
('000 passengers)
2354.9 2248.1
2500
2020.3
1902.5
2000 1751.5
1343
1500
1000 618
500
0
2010 2011 2012 2013 2014 2015 2016
Express Rakyat Express Langkawi Senandung Sutera Express Sinaran
Express Wau Express Timuran Total
Figure 5: Yearly Ridership Figures for KTM Diesel Intercity Train Service
Table 1 and Figure 5 above show the names of the train services and the routes of the KTM Intercity
service. In general, KTM’s Intercity networks is divided into the North-South Sector and the East-West
sector which passes through the ‘Jungle Railway’19 on its way to Peninsular Malaysia’s East Coast.
15
Service was cancelled as of 9th May 2016; replaced by ETS
16 Service was cancelled as of 19th May 2016; replaced by ETS
17 Service was cancelled as of 19th May 2016; replaced by ETS
18 Service was cancelled as of 1st Sept 2015; replaced by ETS
19
A popular name for the Gemas-Tumpat East Coast line (https://wikitravel.org/en/Jungle_Railway)
11Overall, yearly ridership for the KTM Intercity services has been steadily decreasing from 2010 to 2016.
Going from 2.35 million passengers in 2010 to 618,000 passengers in 2016, there was a 73% drop in
ridership over a 7-year period.
On the West Coast route, the KTM Diesel Intercity train services were gradually phased out in stages
from 2015 to 2016 and replaced by the ETS service from Padang Besar (North) to Gemas (South). For
the East Coast region, the intercity train services have been very volatile. The Ekspres Wau service was
cancelled for the most of 2015 due to serious flooding in the East Coast of Malaysia, which damaged
KTM’s train tracks and stations.20 And has since remained inactive. 21 Meanwhile, ridership for the
Express Timuran service from JB to Tumpat plummeted from 503,000 in 2010 to 69,600 in 2015, also
due to the East Coast floods. In 2016, ridership climbed back up to 240,000, but this was still a lower
figure than the 254,000 ridership figure recorded in 2014. Currently, the East Coast railway is serviced
by Express Rakyat Timuran and a few shuttle trains between the rail stations in the East Coast region22.
The frequency of train services is very low. Express Timuran runs two services daily and there are ten
daily shuttle train services operating between the stations in the East Coast. As KTM intercity services
in the East Coast have become more unreliable and prone to delays, it is not unlikely that passengers
would turn to other alternatives including flying, driving and taking buses.
As of 1 August 2017, KTM Intercity only operates two services: Express Timuran (JB Sentral – Tumpat)
and Tebrau Shuttle (JB Sentral – Woodlands). The train leaves Tumpat, Kelantan at 1800hrs and arrives
at JB Sentral at 1110hrs the following day, while the train from JB Sentral departs at 1900hrs, arriving
at 1305hrs the following day. In total, it takes 17 hours to complete the Tumpat-JB Sentral route and
18 hours for the return leg. As a comparison, a quick search on the popular bus ticket booking website
www.catchthatbus.com revealed that the time taken to travel by express bus from Johor Bahru to
Kota Bharu ranges from 7 hours 15 minutes to 9 hours 30 minutes. KTM charges passengers RM50 for
a one-way adult ticket whereas a bus journey costs RM64-66 one way, depending on the bus operator.
The Tebrau Shuttle is becoming increasingly popular for passengers travelling from Johor Bahru,
Malaysia to Woodlands, Singapore. The train fares are SGD5 and RM 5, for departure from Woodlands
JB Sentral respectively. Initially, frequency of services amounted to 14 trains per day, but this has since
increased to 31 trains,23 to serve the growing demand for cross-border commuting. The Tebrau Shuttle
is an attractive alternative for users to cross the Causeway as it only takes 5 minutes from JB Sentral
to Woodlands. However, this shuttle is due to cease operations within the first six months following
20
http://www.utusan.com.my/berita/nasional/10-stesen-ktmb-ditenggelami-banjir-1.41416
21 Passengers who want to go from KL to Tumpat will have to buy two separate tickets – one ETS ticket from KL to Gemas and a non ETS
ticket from Gemas to Tumpat
22 http://intranet4.ktmb.com.my//ktmb/uploads/files/train%20schedule/Website_Jadual_Tren_ETS_Intercity_18_Dis_2017_5.pdf
23
https://www.thestar.com.my/news/nation/2018/01/17/second-link-toll-cut-will-ease-causeway/
12the commencement of operations of the Singapore-JB Rapid Transit System (RTS).24 The Singapore-JB
RTS is expected to be completed by year 2024 and will be operated by a joint venture between
Prasarana Malaysia and SMRT Singapore25. The cross-border urban railway service is an hourly service
that will connect the Bukit Chagar station, linked to JB Sentral, and the Woodlands North MRT station
in Singapore with a carrying capacity of up to 10,000 passengers per trip. In comparison, the Tebrau
Shuttle can only ferry 320 passengers per trip, with a total of 9,920 passengers with 31 trips every day.
2.3 KTM Cargo
KTM’s cargo operations are split into three main parts, namely container cargo, conventional cargo
and land bridge cargo. It is worth noting that a majority of its operations are focused in the Northern
region26. KTM’s container cargo operations may be further classified into three fields, namely South
Thai Cargo, land feeder transfer and inter-terminal transfer (ITT).
The South Thai Cargo operations link the Padang Besar Land Port to the North Butterworth Container
Terminal (NBCT) in Penang, mainly transporting goods from southern Thailand to be exported via the
NBCT. The KTMB land feeder services, on the other hand, are made up of railways connecting the sea
ports and land ports in Peninsular Malaysia, delivering containers used for import/export activities.
In 2015, KTM partnered with MMC Corp through its subsidiary KTM MMC Cargo Sdn Bhd to manage
its container cargo operations, focusing on inter-terminal transfer (ITT)27. KTM MMC Cargo manages
the linkage networks between shipping companies, freight companies and also KTM as a railway
operating company. Currently, the main routes operated by the subsidiary are the Port Klang – Johor
Port and Tanjung Pelepas – Port Klang route with a frequency of five trains per week, adjusted to
market needs.28
KTM also provides a conventional cargo service, transporting a variety of goods in bulk ranging from
cement and clinker (material produced in the kiln stage during cement production that is used as the
binder in many cement products) to processed foods. For example, KTM partners with manufacturers
such as MSM Holdings Malaysia to transport processed sugar from the main manufacturing plant in
Prai to the MSM Depot in Sungai Buloh and the Tampoi depot, for distribution in the Klang Valley and
the Southern region.
24 http://www.channelnewsasia.com/news/singapore/singapore-jb-rapid-transit-system-to-begin-passenger-service-by-9079116
25 http://www.straitstimes.com/politics/smrt-and-prasarana-to-form-joint-venture-by-june
26
http://www.spad.gov.my/land-public-transport/rail/freight-services-ktm
27 http://www.thestar.com.my/business/business-news/2015/12/01/ktm-and-mmc-in-rail-freight-transport-joint-venture/
28
https://www.mmc.com.my/04042016%20-%20KTMB%20MMC%20CARGO%20EXTENDS%20ITS%20CONNECTIVITY%20TO%20PORTS%20IN
%20JOHOR.pdf
13Figure 6 and Table 2 below show the freight traffic for KTM cargo services, by freight category, from
2010 to 2017. The two largest freight categories are the maritime container service and the cement &
clinker service. From 2010 to 2017, these two categories averaged 48.2% and 34.4% of the total KTM
cargo freight traffic, respectively.
Freight Traffic for KTM Cargo ('000 tonne)
10000
8000 7830
6621
6000 6098 6206 5989
5915
5398 5619
4000
2000
0
2010 2011 2012 2013 2014 2015 2016 2017
Cement & Clinker Maritime Container Landbridge
Processed Food & Drink Ore & Other Minerals Chemicals
Others Total
Figure 6: Freight Traffic for KTM Cargo29
Freight Traffic (‘000 tonne)
Type of Cargo 2010 2011 2012 2013 2014 2015 2016 2017
Cement & Clinker 1762 2224 2353 2594 2361 2166 1870 1727
Maritime Container 2622 2703 2691 2864 3773 3157 3138 2955
Landbridge 43 26 20 19 782 131 185 326
Processed Food & Drink 490 460 417 413 418 421 431 377
Ore & Other Minerals 3
Chemicals 300 287 338 341 378 327 348 234
Others 178 215 279 390 118 4 17
Total 5398 5915 6098 6621 7830 6206 5989 5619
Table 2: Freight Traffic for KTM Cargo30
Total freight traffic for KTM Cargo peaked in 2014 with 7.83 million tonnes of carried cargo. Prior to
that, the volume of cargo recorded a steady increase from 5.40 million tonnes in 2010 to 7.83 million
tonnes in 2014, or a 45% growth rate. Since 2014, however, the volume of freight traffic dropped
significantly, from 7.83 million tonnes in 2014 to 5.62 million tonnes in 2017, a fall of 28.2%. One
29 http://www.mot.gov.my/en/resources/rail-statistic
30
http://www.mot.gov.my/en/resources/rail-statistic
14possible reason for the decline in demand for KTM’s cargo services may be the increase in the cargo
fare in 201531, which likely diverted customers to other modes of freight transportation.
Revenue for KTM Cargo (RM '000)
160000 147107 150018 147212
138399
140000 124685 126987 126043
116094
120000
100000
80000
60000
40000
20000
0
2010 2011 2012 2013 2014 2015 2016 2017
Cement & Clinker Maritime Container Landbridge
Processed Food & Drink Ore & Other Minerals Chemicals
Others Total
Figure 7: Revenue for KTM Cargo32
Revenue of KTM Cargo (RM ‘000)
Type of Cargo 2010 2011 2012 2013 2014 2015 2016 2017
Cement & Clinker 32421 41627 45037 50722 55807 58473 46593 32969
Maritime Container 47217 48132 48326 52607 56454 55688 58585 41121
Landbridge 8054 5610 5366 4072 4893 5740 10929 10734
Processed Food &
12435 12232 10742 10606 12764 12027 11183 7963
Drink
Ore & Other
23 0 0 0 0 0 0 0
Minerals
Chemicals 3653 3459 3961 4678 5269 4255 6667 3838
Others 12291 13625 13555 15714 11920 13835 13255 1039
Total 116094 124685 126987 138399 147107 150018 147212 97664
Table 3: Freight Traffic for KTM Cargo33
The revenue of KTM Cargo peaked in the year 2015, a year after cargo volume peak, at RM150 million.
While the volume of cargo decreased 20.7% from 2014 to 2015, the revenue from cargo operations
increased slightly, from RM147.1 million to RM150 million or approximately 2% (See Figure 7 and
Table 3 above). This may have been due to the hike in cargo charges in 201534 which compensated for
31 http://www.therakyatpost.com/business/2014/11/20/ktmb-raising-cargo-rates-2015/
32 http://www.mot.gov.my/en/resources/rail-statistic
33 http://www.mot.gov.my/en/resources/rail-statistic
34
http://www.therakyatpost.com/business/2014/11/20/ktmb-raising-cargo-rates-2015/
15the drastic drop in the volume of freight traffic. In 2017, the revenue from KTM Cargo dropped down
to RM126 million.
2010 2016 Total Growth
GDP - Transportation & Storage (RM 29.0 42.9 48.1%
billion)
KTM Cargo Revenue (RM ‘000) 116,094 147,212 26.8%
KTM Cargo (Traffic) (‘000 tonne) 5,398 5,989 11.0%
Table 4: Total Growth of GDP (Transportation & Storage Sector), KTM Cargo Revenue and KTM Cargo Traffic from Year
2010 to 2016
The stagnation and subsequent decline of KTM Cargo’s volume and revenue figures are somewhat
surprising, given that the transportation & storage sector of the economy has been increasing healthily
since 2010. According to Table 4, transportation and storage sector GDP rose by 48.1% between 2010
to 2016, from RM29.0 billion to RM42.9 billion, while KTM Cargo volume and revenue increased by
merely 11.0% and 26.8% respectively during the same period. KTM Cargo was clearly unable to fully
exploit the opportunities from a growing transportation and storage sector GDP.
2.4 KTM Electric Train Service (ETS)
While declining ridership for the KTM Komuter and Intercity services, and declining volumes and
revenue for KTM Cargo, paints a rather a bleak picture, the outlook for the KTM ETS is largely positive.
The ETS service represents a new phase in KTM’s operations as it runs on fully electrified tracks and
newer trains. The service was first introduced in 2010, plying the KL-Ipoh route with an average
journey time of between 2.5 to 3 hours, depending on the type of train service. The service was
extended from Ipoh to Padang Besar via Butterworth in July 2015 and from KL Sentral to Gemas in
October 2015.
Total Number of Passengers for ETS Services ('000)
4500 4147
4000 3565
3500
3000
2500 2059
2000 1563 1692
1500 1180 July 2015: Opening of
913 ETS to Butterworth &
1000
Padang Besar
500 215
0
2010 2011 2012 2013 2014 2015 2016 2017
16Figure 8: ETS Ridership Figures from 2010 until 201735
Figure 8 above shows the total number of the ETS passengers since its introduction in 2010 until the
2017. Ridership increased by nearly tenfold, from 215,000 in 2010 to 2.06 million passengers in 2015,
with a further increase to 4.15 million passengers in 2017, after two years that ETS services were
extended to Padang Besar via Butterworth in the north and to Gemas via Seremban in the south. This
ridership figure was higher than the peak ridership figure for KTM Intercity services (2.354 million in
2010). The popularity of the ETS is further underscored by the fact that its ridership constituted two
thirds of the passenger volume for KTMB’s intercity train services. Over and above the safety of its
services, several factors may explain the popularity of the ETS.
At the time of writing, an ETS Silver and Gold one-way ticket from KL Sentral to Ipoh costs RM25 and
RM36 respectively compared to RM19 to RM25 for an express bus. Given the better connectivity (KL
Sentral is an integrated public transport hub) and the reliability, comfort and safety record of the ETS,
it is not surprising that it is a competitive and often preferred option than taking an express bus for a
slightly lower price.
In addition, passengers are able travel to Hat Yai, Thailand by shuttle trains via the Padang Besar
station. The train service is priced at 70 Thai Baht or RM10. The ETS is also a considerably cheaper
option compared to flying. This applies especially for “last minute” trips or during high demand
seasons, as flight tickets will be highly susceptible to price hikes.
In summary, ridership on the ETS is expected to increase in the coming years, especially after the
completion of the Gemas to Johor Bahru double tracking electrification project by early 2020
(assuming that there are no delays).36
2.5 Other services
Aside from providing rail services, KTM is also involved in some non-core non-rail business through
ownership of several subsidiaries. In this report, three KTM subsidiaries will be highlighted:
Multimodal Freight Services Sdn Bhd, KTM Distribution Sdn Bhd and KTM (Car Park) Sdn Bhd.
Multimodal Freight Services Sdn Bhd is a wholly owned subsidiary of KTM which operates out of five
locations across Peninsular Malaysia - Port Klang, Butterworth, Padang Besar, Pasir Gudang and KLIA.
According to its official website, Multimodal Freight is involved in four main activities, namely
container haulage, container terminal handling, warehouse and freight forwarding. This means that
35 http://www.mot.gov.my/en/resources/rail-statistic
36
https://www.thestar.com.my/news/nation/2018/01/13/rm94bil-gemasjb-rail-project-to-start-by-end-of-this-month/
17their business model relies on the transportation of cargo including containers and also storage
solutions to cargo.
KTM Distribution (KTMD), another wholly owned subsidiary of KTMB, was established in 1994. KTM
Distribution relies on KTM’s rail network to transport mail, parcels and goods, complemented by door-
to-door service delivery vehicles. KTMD also acts a courier company, providing Track and Trace
services at competitive rates. Customers drop off their parcels at most train stations within the KTM
network where KTMD offices are located.
Finally, KTM (Car Park) Sdn Bhd, incorporated in 1994 as KTM (Brick Yard) Sdn Bhd, and currently
known as KTM Parking, is a car park management company set up to manage car parks connected to
various train stations under the KTM network.
KTM has 10 dormant subsidiaries in various sectors, ranging from catering services – (KTM Catering
Services) to property investment - (KTM (Sentul), KTM (Brickfields), KTM (Sungai Petani), KTM (Railway
Village)) and hotel services - (KTM Heritage Hotel). It is likely that most of these subsidiaries were
failed business ventures that had to be wound down in order to prevent a drain on company resources.
Nevertheless, not all of KTM’s subsidiaries or joint ventures were unprofitable. For example, KTM’s
30% stake in Sentul Raya, a joint venture with YTL Land, was profitable and was sold back to YTL Land
for approximately RM252 million in 2016.37 (More on this in the next chapter)
37 https://www.thestar.com.my/business/business-news/2016/11/30/ytl-land-to-buy-remaining-30-stake-in-sentul-raya/
183 Evaluating the financial performance of KTM
The previous chapter analysed KTM’s various revenue streams, focussing on patterns of change within
these revenue streams, and evaluating several future projects.
This chapter will examine the profitability of KTM and the associated financial challenges. Specifically,
it will analyse KTM’s financial performance for the financial years 2000 to 2016. The detailed
breakdown of KTMB’s revenue figures, by type of operation and group profits / losses will also be
analysed.
3.1 Evaluating the financial performance of KTM Group
Table 5 and Figure 9 below show that KTMB had suffered financial losses from 2000 to 2015. Based
on the figures, accumulated losses from 2000 to 2015 totalled RM1.87 billion. Only in 2016 did KTMB
manage to achieve a profit of RM63.22 million, due largely to a one-off asset disposal (see below for
further discussion).
Total Revenue, Net Profit/(Loss) and Finance Costs of
KTMB Group (RM mil.)
700.00
600.00 611
500.00 492 499 516
455
400.00 405 410 410 429 399 424 441
350 383 365 360 359
300.00
200.00
100.00
-
63
(100.00) 2000 2001 2002 2003 2004 2005 2006 2007 2008 2009 2010 2011 2012 2013 2014 2015 2016
-43
-83 -82 -87 -96
(200.00) -125 -132 -108 -132 -99 -103 -128
-163
(300.00) -226
-238
(400.00)
-374
Revenue (Group) Net Profit/Loss (After Tax) Finance Costs
Figure 9: KTMB's Finances 2000-2016
KTMB's Finances (RM mil.)
Financial Year Revenue (Group) Net Profit/Loss (After Tax) Finance Costs
2000 349.80 (82.77) 27.35
2001 382.55 (163.20) 55.84
2002 364.70 (125.26) 51.57
2003 360.05 (132.21) 42.50
2004 405.29 (108.14) 47.77
2005 358.53 (131.60) 49.63
2006 410.06 (99.24) 63.09
2007 409.98 (82.32) 61.55
192008 429.25 (87.21) 29.94
2009 398.76 (96.21) 21.24
2010 424.05 (374.37) 24.31
2011 440.96 (103.45) 17.82
2012 454.67 (238.44) 29.68
2013 491.82 (128.23) 26.79
2014 498.95 (43.48) 27.78
2015 515.80 (226.25) 29.44
2016 610.68 63.22 30.04
Table 5: KTMB’s Revenue, Net Profit / Loss (After Tax) and Finance costs 2000-2016
That KTM has managed to survive despite prolonged financial losses is due to continued government
support. As will be discussed later, without this explicit government support, KTM would not have
been able to continue its operations.
Revenue of KTMB (RM '000)
700,000.00
610,681
600,000.00
498,954 515,798
491,823
500,000.00 440,963 454,671
424,049
400,000.00
300,000.00
200,000.00
100,000.00
-
2010 2011 2012 2013 2014 2015 2016
Freight & Haulage Passenger Commuter
Electric Train Parcel & Mail Car Parking Service
Compensation from Gov Total
Figure 10: Revenue for KTM Berhad Group for 2012-201638
Figure 10 shows the revenue breakdown from the different sectors of KTMB’s operations from 2010
until 2016. After a prolonged stagnation from 2005 to 2010, KTM’s revenues experienced a healthy
increase, from RM424.0 million in 2010 to RM610.7 million in 2016, at a growth of 44.0% in 7 years.
What were the key drivers of this healthy increase in KTM’s revenues?
38
Source: KTM Berhad Annual Reports 2010-2016
20Tables 6 and 7 give the breakdown of KTM’s revenue streams, according to different categories of
operations and the percentage breakdown of contributions from 2010 to 2016.
Revenue Breakdown for KTMB Group (RM 000)
Operation 2010 2011 2012 2013 2014 2015 2016
Freight & Haulage 191,706 192,913 198,945 203,180 204,885 215,733 208,205
Intercity 93,130 91,781 81,204 74,888 59,760 48,708 40,397
Commuter 82,729 82,824 79,309 105,490 112,853 120,541 151,568
ETS 6,377 23,939 31,886 40,624 44,328 59,916 145,526
Parcel & Mail 20,614 20,686 22,500 21,894 22,213 21,517 22,501
Car Parking Service - - - - - - 2,803
Compensation from Government 29,493 28,820 40,827 45,747 54,915 49,383 39,681
Total 424,049 440,963 454,671 491,823 498,954 515,798 610,681
Table 6: Revenue Breakdown for KTM Berhad Group (%)39
Percentage Breakdown for KTMB Revenue
Operation 2010 2011 2012 2013 2014 2015 2016
Freight & Haulage 45.2% 43.7% 43.8% 41.3% 41.1% 41.8% 34.1%
Intercity 22.0% 20.8% 17.9% 15.2% 12.0% 9.4% 6.6%
Commuter 19.5% 18.8% 17.4% 21.4% 22.6% 23.4% 24.8%
ETS 1.5% 5.4% 7.0% 8.3% 8.9% 11.6% 23.8%
Parcel & Mail 4.9% 4.7% 4.9% 4.5% 4.5% 4.2% 3.7%
Car Parking Service - - - - - - 0.5%
Compensation from Government 7.0% 6.5% 9.0% 9.3% 11.0% 9.6% 6.5%
Total 100.0% 100.0% 100.0% 100.0% 100.0% 100.0% 100.0%
Table 7: Percentage of contribution of different revenue streams (%)40
Freight and haulage (i.e. cargo) comprises the largest portion of KTM’s operations revenue. This
segment saw its share of contribution decreasing from 45.2% in 2010 to 34.1% in 2016, due to the
stagnation of cargo volumes and revenue that was highlighted in Section 2.3. Revenue share from
KTM’s Intercity services has also decreased, from 22.0% in 2010 to 6.6% in 2016, as a result of the shift
in ridership away from regular intercity train services to the ETS starting in 2010. During this time,
revenue from the ETS service increased significantly, jumping from RM6.4 million in 2010 (1.5% of
revenue share) to RM 145.5 million in 2016 (23.8% of revenue share). It would not be surprising if
revenue derived from the ETS surpasses that derived from freight & haulage as well as the commuter
services in the future. Meanwhile, revenue from commuter services has also grown significantly from
RM82.8 million in 2010 to RM151.6 million in 2016, but this growth will likely stagnate given the slump
in ridership since the end of 2015 and continued competition from the LRT and the MRT services.
39 Source: KTM Berhad Annual Reports 2010-2016
40
Ibid.
21Parcel and mail services, operated through the subsidiary KTM Distribution Sdn Bhd contributed, on
average, 4.5% of the yearly revenue and revenue figures for this category of operations has remained
relatively constant from 2010 to 2016.
KTM receives compensation from the government for un-economic activities, fare increases and
concession tickets41. This means that KTM receives financial aid from the government for running
unprofitable services including the intercity services in the East Coast. The amount of compensation
from the government has varied across the years. From a low of RM28.8 million in 2011, it rose to a
peak of RM54.9 million in 2014 before falling back down to RM39.7 million in 2016. The decline might
be attributed to the fare increase in December 2015, where fares were increased from 11 sen per km
to 15 sen per km 42. In the same year, the government provided compensation amounts of RM30
million and RM 7 million to KTM to manage the fare increase and to implement a KTM concession card
respectively.
Government compensation (RM 000)
2010 2011 2012 2013 2014 2015 2016
Compensation for Uneconomic
29,493 28,820 40,827 45,747 54,915 49,383 39,681
Services
Contribution to Total Revenue 7.0% 6.5% 9.0% 9.3% 11.0% 9.6% 6.5%
Compensation for Fare Increase - - - - - 30,000 -
Compensation for Concession
- - - - - 7,000 -
Card
Table 8: Government Compensation to KTM for Uneconomic Services43
Income Statement of KTM Group (RM million)
Financial Year 2010 2011 2012 2013 2014 2015 2016
Revenue 424.0 441.0 454.7 491.8 499.0 515.8 610.7
Cost of services -492.2 -494.8 -533.4 -516.5 -549.8 -579.9 -534.7
Gross Profit/(loss) -68.2 -53.9 -78.7 -24.6 -50.9 -64.1 76.0
Other operating income 89.3 76.0 103.1 50.7 45.2 62.9 201.4
Administrative expenses -53.8 -54.6 -162.5 -145.9 -143.1 -153.5 -134.4
Other operating expenses -335.4 -79.2 -98.8 -12.3 -14.0 -76.0 -74.4
Results from operating activities -368.1 -111.7 -236.9 -132.2 -162.7 -230.6 68.6
Finance income 3.6 2.3 1.3 1.3 1.4 1.5 1.5
Finance costs -24.3 -18.4 -29.7 -26.8 -27.8 -29.4 -30.0
Share of profit of equity-accounted investees, net of tax -388.8 -127.8 35.0 29.2 31.0 32.1 23.8
Return from joint venture arrangement - - - - 115.0 - -
41 Source: KTM Berhad Annual Reports 2012
42 https://www.thestar.com.my/news/nation/2015/11/01/ktm-fares-to-go-up-december/
43
Source: KTM Berhad Annual Reports 2010-2016
22Profit/(Loss) before tax -372.0 -103.7 -230.3 -128.5 -43.1 -226.4 63.8
Income tax credit/(expense) -2.4 0.2 -8.1 0.2 -0.4 0.2 -0.6
Profit/(Loss) for the year -374.4 -103.5 -238.4 -128.2 -43.5 -226.2 63.2
Without joint venture return -374.4 -103.5 -238.4 -128.2 -158.5 -226.2 63.2
Without disposal of the
-374.4 -103.5 -238.4 -128.2 -43.5 -226.2 -189.2
Sentul Raya Investment
Table 9: Income Statement of KTMB Group from 2010 to 201644
Despite the 44% increase in revenue from 2010 to 2016, KTMB still had trouble achieving profitability.
Table 8 shows details of KTM’s Group income statements from 2010 to 2016. The figures show that
cost of services was increasing together with increases in revenue. In fact, from 2010 to 2015, the cost
of services was greater than the revenue. In 2016, revenue exceeded cost of services, leading to a
gross profit of RM76.0 million. The main reason for this return to gross profitability was the significant
increase in ETS revenue from RM60 million in 2015 to RM145.5 million in 2016, without a
corresponding increase in the cost of services. Yet KTM would not have achieved net profitability after
paying tax expenses in 2016 if not for a ONE-OFF gain of RM162 million when it disposed of its 30%
stake in Sentul Raya Sdn Bhd to YTL Land.45 The last column in Table 8 shows that without the Sentul
Raya investment disposal, KTM would have made a loss of RM189.2 million. In other words, despite
the increase in revenue from the ETS, higher administrative and other operating expenses will likely
continue to keep KTM in the red for the foreseeable future. In the absence of serious cost cutting
efforts, it is hard to imagine KTM achieving net profits after taxes in the coming years.
The serious losses experienced by KTM also calls into question the argument that KTMB can only
return to profitability with fare increases. In December 2015, KTMB increased its KTM Komuter fares
for the first time in 12 years to cover increasing costs. 46 According to the then KTM President Sarbini
Tijan, the increase of 4 sen per kilometre was justified as it had then cost KTM 20 sen per kilometre
per passenger. Since the government had only allowed a 15 sen increase, KTM would need a further
5 sen per kilometre subsidy from the government to cover costs. The introduction of a fare increase
had helped boost KTM Komuter revenues from RM120 million in 2015 to RM151m in 2016. However,
one negative side-effect was a significant reduction in its ridership figures. To this day, KTM is still
struggling to recover from this (Figures 3 and 4). Should KTM decide to unilaterally hike its fares, its
ridership may tumble even further, especially since commuters nowadays have other alternatives such
44 Source: KTM Berhad Annual Reports 2010-2016
45 https://www.thestar.com.my/business/business-news/2016/11/30/ytl-land-to-buy-remaining-30-stake-in-sentul-raya/ and KTMB
Group’s statement on the disposal of its Sentul Raya investment in its 2016 Annual Report.
46
http://www.theedgemarkets.com/article/ktmb-mulls-fare-hike-mitigate-rising-operating-costs
23as the MRT Line 1 and soon, the LRT 3 line to Klang and the MRT Line 2 from Sungai Buloh to Putrajaya
via Serdang.
These profit and loss (P&L) statements do not tell the full story, which is that KTM’s financial losses
would be even greater without the government implicitly subsidizing the financing costs of KTM. These
details are described more fully in the notes to KTM’s annual reports.
3.2 Government subsidizing KTM’s Financing Costs
KTM’s financing costs of RM30 million for 2016 seems remarkably low given its non-current and
current loans and borrowings of RM1.4 billion as of 2016. Even at a reasonably low interest rate of 5%,
KTM’s annual financing cost should be approximately RM70 million which is more than double of what
it paid in 2016.
A closer examination of KTMB’s 2016 accounts reveals that the Government of Malaysia is effectively
subsidising its financing costs. Five term loans totalling RM880 million were provided to KTMB from
1990 to 2010. Three of these term loans, totalling RM575.5 million at an interest rate of 8% per annum,
were provided to KTMB for the purchase of 80 Electrical Multiple Unit (EMU) trains. The repayment
of these three loans, which would have totalled RM67.7 million per annum, was deferred for 23, 23
and 19 years respectively. These repayments start in September 2015, January 2019 and February
2015 respectively.
The fourth term loan of RM25 million for the upgrading of computer systems would require an annual
instalment of RM3.1 million (at a 4% interest rate per annum) beginning in July 2015. The fifth term
loan of RM280 million for working capital would require an annual instalment of RM34.5 million (at a
4% interest rate per annum) beginning in August 2024.
The details of these five term loans are summarized in Table 10 below.
Amount
Term (RM Loan Purpose Date of Interest Deferred First Annuity
Loan million) Purchase rate Period Payment Due Date
15 Sept,
1 97 Purchase 18 EMUs 1 Nov, 1990 8% p.a. 23 years 9,789,664
2015
Purchase 44 EMU 13 Jan,
2 404.55 30 Dec, 1995 8% p.a. 23 years 47,263,392
units 2019
1 Feb,
3 73.95 Purchase 18 EMUs 16 Jan, 1995 8% p.a. 19 years 7,532,407
2015
Upgrading Computer 16 July,
4 25 1 July, 1999 4% 14 years 3,082,274
Systems 2015
Working Capital 25 Aug,
5 280 15 July, 2010 4% 22 years 34,521,462
Financing 2024
24Table 10: Summary of Details of Given Government Term Loans Provided to KTMB at ‘Subsidised’ Rates and Repayment
Periods
Instalment payments have not begun on ANY of these give term loans, even for those loans where the
repayment should have started in 2015. KTM is appealing for the annual instalments for Term Loans
1-4 to begin only in 2021. The Government of Malaysia still has not made any decision with regards to
this KTM appeal. If these loan repayments were to start in Financial Year 2018 or 2019, it is almost
certain that KTM would sink further into the red and would remain in unprofitable territory in the
foreseeable future.
3.3 Evaluating the finances of KTMB’s subsidiaries
KTMB’s three subsidiaries and its joint venture with MMC also do not fare much better in terms of
generating profits. Table 11 details the revenue and profit / loss after tax figures for the three wholly-
owned subsidiaries of KTMB and the 51% KTM owned joint venture with MMC called KTM MMC Cargo.
Name of Company Revenue & Profit / Loss 2012 2013 2014 2015 2016
Revenue 22,491,814 21,935,147 NA NA 22,509,461
KTM Distribution
Profit / Loss after tax 500,140 (2,401,297) NA NA (2,245,817)
Revenue 1,690,730 2,318,394 2,713,216 3,055,866 2,802,578
KTMB Car Park
Profit / Loss after tax (120,856) 63,692 (30,987) (156,750) (89,195)
Multimodal Revenue 86,164,236 77,307,644 67,264,654 80,285,912 74,019,191
Freight Profit / Loss after tax 11,744,423 4,371,760 2,437,548 12,477,887 2,981,341
Revenue NA NA NA NA 2,150,789
KTM MMC Cargo
Profit / Loss after tax NA NA NA NA (322,327)
Table 11: Revenue for KTM Subsidiaries and KTM Joint Venture with MMC 2012-201647
Based on the 2016 financial statements, three out of the four companies listed above were suffering
after tax losses. Only Multimodal freight was profitable, with a RM2.98 million profit from RM74
million in total revenue in 2016. In contrast, KTM Distribution suffered a RM2.25 million loss from
RM22.5 million in revenue, KTM Car Park suffered a RM89,195 loss from RM2.8 million in revenue and
KTM MMC suffered a RM322,327 loss from RM2.151 million in revenue. All three KTMB subsidiaries
do not seem to be experiencing any significant growth in revenue. Even then, Multimodal Freight, the
only profitable KTM subsidiary, had a lower revenue of RM74.0 million in 2016 compared to RM86.1
million in 2012. KTM Distribution’s revenue of RM22.51 million in 2016 was barely higher than its
revenue of RM22.49 million in 2012. KTM Car Park’s revenue of RM2.8 million in 2016 was actually
lower than its 2015 revenue of RM3.055 million. All in all, these four companies earned RM101.5
million in revenue and contribute a net profit of RM324,002.
In short, while they contribute to the overall income of the KTM Group, KTM subsidiaries do not
contribute much to the overall profitability of the group.
47
Source: SSM Company Profiles of Respective Companies
253.4 KTM as a going-concern
According to the 2016 Annual Report, as of 31 December 2016, the current liabilities of KTM Group
have exceeded the current assets by RM326.7 million. As of 31 December 2016, KTM Group has a
capital deficiency of RM1.2 billion as a result of accumulated losses incurred in prior financial years.
The Group is also currently negotiating with the Minister of Finance Incorporated to reschedule the
repayment of its government loans and borrowings which totalled RM1.253 billion as of 31 December
2016.
Without the explicit backing of the Minister of Finance (Incorporated) and the Government of
Malaysia to continuously support KTM Group financially, the ability of KTM to survive as a going-
concern would be very much in doubt. This is acknowledged by auditors in the annual report.
264 The Railway Asset Corporation (RAC), the Railway Network Access
Agreement (RNAA) and the impact on KTM
The Railway Asset Corporation (RAC) is a federal statutory body established under Article 89 of Act
463 or the Railways Act 1991. Under the act, Railway Asset Corporation (RAC) was to be fully
operational by 1 August 1992 in line with the corporatisation of KTM.
RAC was established to manage the assets of the KTM railway, namely the track and the stations, in
order to free KTM from costs such as track and station maintenance and enhancement. RAC also has
a role to play in developing the railway infrastructure so that KTM can focus on its role as a railway
operating company48. Under this model, RAC would be the main asset manager of railway assets in
Malaysia and KTM would be the main service provider by utilising assets owned and managed by RAC.
The Railway Network Access Agreement (RNAA) was signed between KTM and RAC on 22 December
2016. This agreement, which runs for a period of 30 years and was targeted to come into effect on
January 2018, will see all land and rolling stocks ownership transferred from KTM to RAC by 2018,
whereby KTM would lease the rolling stock i.e. the trains to RAC. RAC will also manage properties
previously owned by KTM49. According to Deputy Transport Minister Datuk Abdul Aziz Kaprawi, this
agreement will enable KTM to focus on the operational aspects of its business such as the ETS50. Under
this agreement, there will be a clear demarcation of roles between RAC as the Rail Asset Owner
(overseeing asset maintenance) and KTM as a Rail Operator (overseeing asset operations). RAC will
bear the cost of major maintenance of the rolling stock while more minor maintenance works would
be borne by KTM.
This system of dividing rail assets management and railway operations between separate bodies is not
a concept unique to the RAC and KTM. The United Kingdom adopts a similar model under the
arrangement between Network Rail, train operating companies (TOCs) and freight operating
companies (FOCs). Network Rail is a public company, answerable to the Department of Transport. To
date, this company owns most of the railways in England, Scotland and Wales and also over 2500 rail
stations in the UK. Under this model, rail infrastructure is leased to TOCs and FOCs.
Network Rail is responsible for the upkeep and maintenance of railways. However, during the
privatisation of railways in 1995, Railtrack, Network Rail’s predecessor, was given the duty to manage
railway assets in the UK.51
48 http://www.rac.gov.my/index.php/pages/view/1?mid=158
49 http://www.theedgemarkets.com/article/transport-ministry-says-agreement-will-not-cost-4000-job-losses-ktmb
50 ibid
51
http://news.bbc.co.uk/1/hi/business/2267597.stm
27You can also read