What Twitter Profile and Posted Images Reveal About Depression and Anxiety - arXiv
←
→
Page content transcription
If your browser does not render page correctly, please read the page content below
What Twitter Profile and Posted Images Reveal
                                                                            About Depression and Anxiety

                                          Sharath Chandra Guntuku1 , Daniel Preotiuc-Pietro2 , Johannes C. Eichstaedt1 , Lyle H. Ungar1
                                                                                      1
                                                                                   University of Pennsylvania, 2 Bloomberg LP
                                                                 {sharathg@sas, jeich@sas, ungar@cis}.upenn.edu, dpreotiucpie@bloomberg.net
arXiv:1904.02670v1 [cs.HC] 4 Apr 2019

                                                                    Abstract
                                          Previous work has found strong links between the choice of
                                          social media images and users’ emotions, demographics and
                                          personality traits. In this study, we examine which attributes of
                                          profile and posted images are associated with depression and
                                          anxiety of Twitter users. We used a sample of 28,749 Facebook
                                          users to build a language prediction model of survey-reported
                                          depression and anxiety, and validated it on Twitter on a sample
                                          of 887 users who had taken anxiety and depression surveys.
                                          We then applied it to a different set of 4,132 Twitter users
                                          to impute language-based depression and anxiety labels, and
                                          extracted interpretable features of posted and profile pictures
                                          to uncover the associations with users’ depression and anxiety,
                                          controlling for demographics. For depression, we find that
                                          profile pictures suppress positive emotions rather than display
                                          more negative emotions, likely because of social media self-
                                          presentation biases. They also tend to show the single face of
                                          the user (rather than show her in groups of friends), marking
                                          increased focus on the self, emblematic for depression. Posted
                                          images are dominated by grayscale and low aesthetic cohesion
                                          across a variety of image features. Profile images of anxious
                                          users are similarly marked by grayscale and low aesthetic
                                          cohesion, but less so than those of depressed users. Finally,
                                          we show that image features can be used to predict depression
                                          and anxiety, and that multitask learning that includes a joint
                                          modeling of demographics improves prediction performance.
                                          Overall, we find that the image attributes that mark depression
                                          and anxiety offer a rich lens into these conditions largely
                                          congruent with the psychological literature, and that images
                                          on Twitter allow inferences about the mental health status of
                                          users.
                                                                                                              Figure 1: Overview of data flow, models and analysis in the paper
                                                                Introduction
                                        Depression continues to be under-diagnosed with only 13-              often gaps between data collection and depression onset.
                                        49% receiving minimally adequate treatment (Wang et al.               Automated analysis of user generated content can potentially
                                        2005). This is caused by a complex set of factors such as             provide methods for early detection of depression (Guntuku
                                        imperfect screening methods, social stigma associated with            et al. 2017b). If an automated process could detect elevated
                                        the diagnosis, and lack of cost-effective resources for and           depression or anxiety levels in a person, that individual could
                                        access to diagnosis and treatment. Efforts to detect depression       be targeted for a more thorough assessment (and provided
                                        predominantly rely on online and phone surveys. However,              with digitized forms of support and treatment), alleviating
                                        these surveys are resource intensive, both in terms of cost           many of the constraints associated with traditional assessment
                                        and time, and insufficiently reach all at risk (Suchman 1962).        methods.
                                        The single time point of assessment also means there are
                                                                                                                The last few years have seen an increased interest in study-
                                        Copyright c 2019, Association for the Advancement of Artificial       ing mental health through social media. Recent studies have
                                        Intelligence (www.aaai.org). All rights reserved.                     investigated the association of language and social media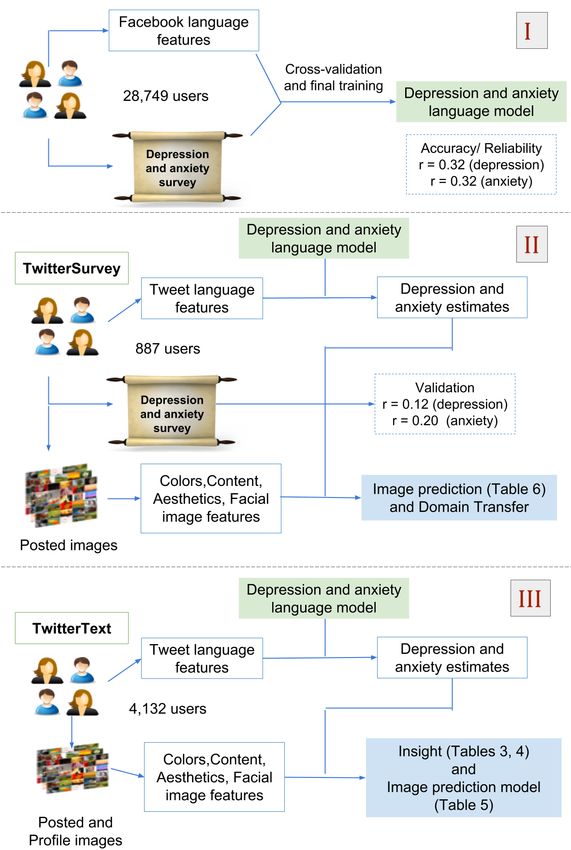
Study                                      # Users                   Traits                                Image Type                                    Image Features
 Our Work                                 887 + 4,132         Depression & Anxiety                Twitter Posted & Profile Images          Color, Facial, Aesthetics, Content, VGG-Net
 (Reece and Danforth 2017)                    166                  Depression                             Instagram Photos                                    Colors
 (Andalibi, Ozturk, and Forte 2015)             –                  Depression                   500 ‘#depression’ Instagram Photos                      Manual Annotation
 (Ferwerda and Tkalcic 2018)                  193            Personality (continuous)                     Instagram Photos                                    Content
 (Nie et al. 2018)                           2238       Perceived Personality (continuous)              Web Portrait Images                         Facial, Social information
 (Samani et al. 2018)                         300            Personality (continuous)        Twitter and Flickr Posts, Likes, & Profiles            Colors, Content, VGG-Net
 (Farnadi et al. 2018)                       5670              Personality (binary)                   Facebook Profile Images                           Facial, Text, Likes
 (Guntuku et al. 2017a)                   4132 + 161         Personality (continuous)         Posted, liked images and text on Twitter        Color, Bag of Imagga tags, VGG-Net
 (Segalin et al. 2017)                      11,736      Personality (continuous & binary)             Facebook Profile Images                 Aesthetics, BOVW, VGG-Net, IATO
 (Liu et al. 2016)                          66,502           Personality (continuous)                  Twitter Profile Images                              Color, Facial
 (Ferwerda, Schedl, and Tkalčič 2016)       113              Personality (binary)                       Instagram Photos                            Colors, #Faces, Filters
 (Skowron et al. 2016)                         62              Personality (binary)                       Instagram Photos                                    Colors
 (Guntuku et al. 2016)                        300            Personality (continuous)             Liked (‘Fave’) images on Flickr              Colors, semantic features, aesthetics
 (Guntuku et al. 2015)                        123            Personality (continuous)                     Selfies on Weibo                    Color, Aesthetics, BOVW, Emotions
 (Al Moubayed et al. 2014)                    829              Personality (binary)                         Face Images                                     Eigenfaces
 (Celli, Bruni, and Lepri 2014)               112              Personality (binary)                   Facebook Profile Images                     Bag-of-Visual-Words (BOVW)
                          Table 1: Summary of data and methods used in previous work analyzing images of individual users.

use patterns with several mental illnesses, including stress,                                                                   Related Work
depression and suicidality. Such studies can be grouped into
two categories: a) studies aimed at detecting mental illnesses                                 Researchers have used images to study personality, mea-
and their symptoms from social media (the focus of this pa-                                    sured using the Big Five model (McCrae and John 1992),
per); and b) studies that examine how the use of social media                                  based on profile pictures (with facial features). Others have
contributes to or alleviates distress in users. Most prior works                               also used posted images. One of the earliest works predicted
explored the use of linguistic attributes to predict mental                                    self-assessed personalities of 100 users using their Facebook
health conditions with reasonable success. (Guntuku et al.                                     profile images (Celli, Bruni, and Lepri 2014) with ∼65%
2017b) review the use of social media text-based features in                                   accuracy using bag-of-visual-words (BoVW) features. Ran-
detecting mental health conditions.                                                            dom portraits from the web (Nie et al. 2014) and existing
                                                                                               face recognition data sets (Al Moubayed et al. 2014) were
   With the ubiquity of camera-enabled mobile devices and                                      also used to model users’ personality. Recently, aesthetic fea-
growth of image-based social media platforms (such as Twit-                                    tures (Datta et al. 2006; Machajdik and Hanbury 2010) (apart
ter, Instagram or Snapchat) social media content is increas-                                   from facial features) were also used to predict personality
ingly in image form (Burdick et al. 2012), and preliminary                                     on a ∼66,000 user data set (Liu et al. 2016) from Twitter.
work suggests that users are increasingly communicating                                        Further, (Segalin et al. 2017) used multiple sets of features
their emotions using images (Reece and Danforth 2017). Cur-                                    extracted from Facebook images of 11,736 users and built
rent computer vision algorithms allow us to automatically                                      computational models which have better predictive power
analyze large scale data sets and extract shallow color fea-                                   than human raters in predicting personality traits, specifically
tures as well as semantic content such as objects or scenes.                                   Extraversion and Neuroticism.
Previous work has studied the variation in colors and use of
                                                                                                 However, in the health domain manifestation of mental
filters of posted images in depressed individuals and has not
                                                                                               health conditions in individual users based on social media
studied the diverse content associated with posted images or
                                                                                               images is under explored, despite recent work being done
the characteristics of profile images for users with depression
                                                                                               on studying public health of communities (Manikonda and
and anxiety (Reece and Danforth 2017).
                                                                                               De Choudhury 2017; Chancellor et al. 2017; Garimella, Al-
   Moreover, prior works typically study mental health con-                                    fayad, and Weber 2016a). Table 1 presents a summary of the
ditions in isolation, not exploiting the underlying implicit                                   relevant works: number of users, traits, image types studied
correlations in conditions and demographic factors. Tasks                                      and features used.
with underlying commonalities have been shown to bene-                                           (Andalibi, Ozturk, and Forte 2015) examined the distribu-
fit from multi-task learning, e.g. action recognition (Wang                                    tion of themes in 500 images with the hash-tag #depression
et al. 2016), chronic disease prediction (Nie et al. 2015).                                    uncovering themes posted by depressed users. However, lim-
Particularly user demographics (age and gender) and the                                        ited to a small set of images, further work is required to
co-morbidity between mental health conditions have been                                        study the generalisability of the findings. (Reece and Dan-
used to diagnose patients by clinicians (Bijl, Ravelli, and                                    forth 2017) looked for the markers of depression in Insta-
Van Zessen 1998). We use multi-task learning to take these                                     gram posts. However, the study aggregates images by days of
strong associations into account.                                                              posting instead of participants even though depression was
   In summary, we examine the following questions:                                             measured a single time as a trait using a questionnaire. It also
• What meaningful, relevant and interpretable patterns do                                      looks at a limited set of image features on posted images.
    images that users post and choose as profile pictures reveal                                 The aim of our work is to use social media images to study
    about users’ depression and anxiety?                                                       how depression and anxiety are related to the content of im-
• What effect does joint learning of demographics along with                                   ages that people post or choose as profile pictures on social
    co-morbid mental health conditions have on prediction                                      media. We explore if incorporating author attributes such
    performance?                                                                               as age and gender in the joint modeling of depression and
• Do text-predicted labels help when predicting survey-                                        anxiety can improve prediction performance. Further, we ex-
    based ground-truth labels from images?                                                     amine if weak text-predicted labels can improve performance
in predicting reliable survey based outcomes. TwitterSurvey TwitterText
Dep Score Anx Score Dep Score Anx Score
Min -1.323 -2.390 Min -2.644 -3.052
Data 25% -0.758 -0.693 25% -0.719 -0.729
50% -0.194 0.155 50% -0.084 -0.077
We use a Facebook dataset (where we have language data but 75% 0.629 0.791 75% 0.702 0.662
not image data from users) and two Twitter datasets (where Max 3.851 1.852 Max 3.492 3.967
we have both language and image data from users) in this Table 2: Descriptive statistics of outcomes in both data sets. Scores
study (overview in Figure 1). This study received approval are z-normalized
from the University of Pennsylvania Institutional Review
Board (IRB).
The Facebook data is from a previous study (Schwartz et set, we use the language-prediction model from Facebook
al. 2014), consisting of 28,749 users who had taken the IPIP to impute depression and anxiety scores. We downloaded
NEO-PI-R survey (Costa and McCrae 2008) that contains the 3200 most recent user tweets for each user, leading to
the Depression and Anxiety Facets of the Neuroticism Factor. a data set of 5,547,510 tweets, out of which 700,630 posts
These users also consented to share access to their status contained images and 1 profile image each across 3498 users.
updates which was used to build a text-regression model. The We exclude the texts associated with the tweets which contain
text model was trained using 1-,2-, and 3-grams used by at images when predicting depression and anxiety to limit any
least 5% of users (resulting in 10,450 ngrams), 2000 LDA potential confound. Then, for our analysis, we excluded users
derived topics, and 64 LIWC features extracted from status who posted less than 20 photos.
updates and a linear regression with L2 ridge penalization
on 10% principal component features. In the original valida- Feature Extraction
tion, the model achieved a Pearson correlation of r = .32
predictive performance, which is considered a high correla- Since we are dealing with both posted images and profile
tion in psychology, especially when measuring internal states pictures, we extract different sets of features to capture the
(Meyer et al. 2001). We did not have access to image data for representations associated with both. From posted images, we
the Facebook cohort. extract colors, aesthetics and image content related features,
TwitterSurvey was collected by deploying a survey on and from profile images, in addition to the three sets, we
Qualtrics1 (a platform similar to Amazon Mechanical Turk), also extract facial-related features considering the literature
comprising several demographic questions (age, gender, race, linking facial expressions to emotions and mental states (Gur
education, and income) and the Beck’s Depression Inventory et al. 1992).
(Beck, Steer, and Brown 1996) to measure depression and
Colors
Anxiety facet from the International Personality Item Pool
proxy for the NEO Personality Inventory Revised (NEO-PI- The colors of an image represent the most notable features to
R) (Costa and McCrae 2008). Users received an incentive a human. Research has shown that colors can invoke emotions
for their participation, and we obtained their informed con- (Wexner 1954), psychological traits (Huang, Wang, and Wu
sent to access their Twitter posts. All users were based in the 2006) or, on social media, reflect the personality of the person
US. Out of 887 users who took the survey, 766 users posted posting the image (Skowron et al. 2016) and even mental
241,683 images. We excluded users who posted fewer than health states (Reece and Danforth 2017).
20 images, resulting in 560 users with 145,436 posted images. Colors can be expressed in various color spaces. We use
We used continuous depression and anxiety scores (descrip- the HSV (Hue–Saturation–Value), which provides a more
tive statistics in Table 2) and, for regression, we standardized intuitive representation of colors for humans (Bigun 2006).
the scores by converting them to have mean 0 and standard A pixel in the HSV space is characterized by three numbers:
deviation 1. As the distribution of all psychological traits is (1) Hue: the color type ranging between 0 and 360 degrees
approximately normal with basically no exceptions, we pre- e.g., 0 is red, 60 is yellow; (2) Saturation: the intensity of the
ferred not to threshold continuous distributions, to have the color ranging from 0 to 1 e.g., 0 represents no color and is a
largest amount of useful variance available when considering shade of gray; (3) Value: the brightness of the color ranging
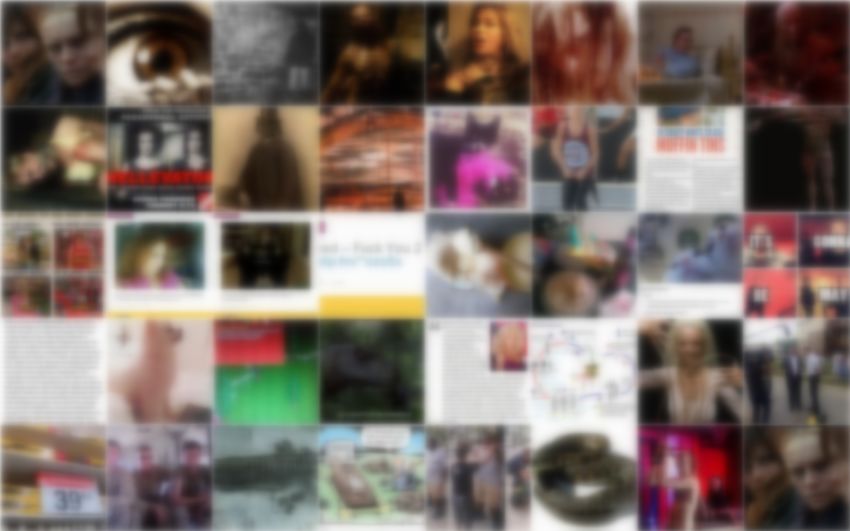
covariances and correlations. In Figure 2, we visualize ran- from 0 to 1 e.g., 0 represents black.
dom images from users with top and bottom 25% percentile Using the images converted to the HSV space, we first deter-
of both depression and anxiety scores. The distribution of mine whether an image is grayscale. A picture is considered
scores are shown in Table 2. grayscale if there is no pixel for which hue can be calculated
TwitterText is a domain related dataset which has self- with accuracy i.e., V ∈ [0.15, 0.95], S > 0.2 (Ke, Tang, and
reported age and gender for all users. We used it to be Jing 2006). We ignore grayscale images (216 profile images,
able to control for and use demographics for multi-task 4.99% of posted images) from subsequent color analysis only,
modeling of mental health conditions. This dataset was as their presence may bias the results. We compute saturation
used in previous works by (Preoţiuc-Pietro et al. 2017; and brightness as the average saturation and value respec-
Guntuku et al. 2017a). It is an order of magnitude larger data tively of the pixels in the image. An experimental study of col-
set consisting of 4132 Twitter users. Since we do not have ors established the relationship between saturation and bright-
depression and anxiety computed via surveys for this data ness and the dimensional model of affect containing three fac-
tors: Pleasure = .69·V +.22·S, Arousal = −.31·V +.60·S,
1
www.qualtrics.com/Survey-Software Dominance = −.76·V +.32·S (Mehrabian and Russell 1974;Valdez and Mehrabian 1994). We compute the standard devia- Image Content
tion of the HSV values, which we will use only for prediction.
Using the hues of an image, we compute the hue count Images posted in tweets can have diverse content beyond
of a photo as a measure of its simplicity (Ke, Tang, and faces. Therefore, apart from color features, as used in prior
Jing 2006). Professional photos usually have a lower number works (Reece and Danforth 2017) and (Ferwerda, Schedl, and
of unique hues, although each color may be rich in tones, Tkalčič 2016)), we use automatic content analysis techniques
leading to a simpler composition. To compute the hue count to generate tags for these images. We labeled all images
defined in (Ke, Tang, and Jing 2006), we obtain the 20-bin with the Imagga Tagging API2 and generated for each image
hue histogram from each pixel for which we can accurately a bag-of-tags out of the top-10 predicted tags, following
compute its hue (see above) and compute the number of bins the developers’ recommendations. We removed all tags that
containing at least 5% of the pixels of the maximum bin size. occurred less than 200 times in our data set, leaving us with
As the hue count distribution is skewed towards a low number 1,299 distinct tags. Imagga was successfully used in previous
of hues, we log-scale this value for our analysis. research (Garimella, Alfayad, and Weber 2016b).
We also compute a 6-bin histogram which splits pixels We found multiple tags which were very similar and usu-
into the primary and secondary colors and a 12-bin his- ally co-occurred together (e.g., glass, drink, beverage; waves,
togram to count the proportion of pixels from the primary, shoreline, seascape, seaside). We therefore reduce the fea-
secondary and tertiary colors. Finally, we compute percentage ture space by learning tag clusters that contain frequently
of warm and cold color pixels using the hue values: Warm: co-occurring tags. This decreases sparsity and increases inter-
H ∈ [285, 75], Cold: H ∈ [105, 255]. A combination of pretability. We use a clustering procedure that was originally
contrast and hue count was used as a proxy for sharpness. applied to words in tweets, which produced very accurate
After extracting features from individual posted images, we prediction results (Lampos et al. 2014). First, we compute the
aggregate them to the users using mean pooling. Normalised Pointwise Mutual Information (NPMI) between
all pairs of tags (Bouma 2009). NPMI measures the degree
Aesthetics to which two tags are likely co-occur in the same context
(image) and takes a maximum value of 1 if two tags always
Using pair-wise ranking of image pairs as well as the image co-occur and a value of 0 if they occur as according to chance.
attribute and content information, (Kong et al. 2016) propose We use NPMI as a similarity measure; negative values are re-
to learn aesthetics. Two base networks of the Siamese archi- placed with 0 as in (Lampos et al. 2014) and compute a tag ×
tecture for each of the two images (in the pair) adopt the tag similarity matrix. We feed this matrix to the spectral clus-
AlexNet configurations with the final fully connected layer tering algorithm, a hard-clustering method appropriate for
removed. The base network is fine-tuned using aesthetics generating non-convex clusters (Ng, Jordan, and Weiss 2002;
data with an Euclidean Loss regression layer followed by the Shi and Malik 2000; von Luxburg 2007), which performs a
Siamese network ranking the loss for every sampled image graph partitioning on the Laplacian of the similarity matrix.
pairs. The fine-tuned network is used as a preliminary feature The number of clusters needs to be specified in advance. We
extractor. These features are then used for an attribute pre- use 400 clusters throughout this study, based on preliminary
diction task which is trained in a multi-task manner by com- experiments.
bining the rating regression Euclidean loss, attribute classifi- Once these clusters of semantically similar tags are created,
cation loss and ranking loss. Finally, a content classification we represent each image as a vector containing the normal-
softmax layer is added to predict a predefined set of category ized number of times each tag cluster is detected. For each
labels. The categories are defined as: ‘balancing element’ - user, we derive a feature vector of image content topics as
whether the image contains balanced elements; ‘content’ - the normalized number of times each topic cluster is present
whether the image has good/interesting content; ‘color har- in the tweet-embedded images. We also calculated the per-
mony’ - whether the overall color of the image is harmonious; centage of image posts and percentage of posts with people
‘object emphasis’ - whether the image emphasizes foreground (based on Imagga tags).
objects; ‘rule of thirds’ - whether the photography follows
rule of thirds; ‘vivid color’ - whether the photo has vivid color, VGG-Net We use a pre-trained version of the 19-layer ver-
not necessarily harmonious color; ‘repetition’ - whether the sion of the VGG-Net image classifier based on convolutional
image has repetitive patterns; ‘symmetry’ - whether the photo neural networks (Simonyan and Zisserman ). This classifier
has symmetric patterns; ‘depth of field’ - whether the image achieved the best results in the ImageNet Large Scale Visual
has shallow depth of field; ‘lighting’ - whether the image Recognition Challenge 2014 in the object classification and
has good/interesting lighting; ‘motion blur’ - whether the localization challenge. It predicts a class probability for the
image has motion blur. The various categories labeled are 1,000 objects in the ImageNet tagset. We also extract the fea-
photographic attributes and image content information which tures from the last fully connected layer (fc7) for prediction.
help regularize the photo aesthetic score, which is modeled as After extracting features from individual posted images, we
a complex non-linear combination of each of the categories. aggregate them to the users using mean pooling.
The network also outputs an aesthetic score. After extracting
features from individual posted images, we aggregate them
2
to the users using mean pooling. http://docs.imagga.com/\#auto-tagging(a) High level of depression and anxiety (b) Low level of depression and anxiety
Figure 2: A random sampling of images posted by users with top and bottom 25% percentile of both depression and anxiety scores, blurred for
privacy reasons.
Face-related features. We control for age and gender using partial cor-
relation so that our analysis is not skewed by any potential
For profile photo analysis, we use the Face++3 and EmoVu4 demographic bias in the data. Additionally, in content anal-
APIs for facial feature extraction, as profile photos on Twitter ysis, as depression and anxiety are highly inter-correlated
usually contain one or more faces. Previous research has (r=.67), we control for the other trait in order to isolate the
shown facial features can predict personality of users (Liu unique attributes of each dimension. We adjust for multiple
et al. 2016) and has used Face++ as a proxy for extracting comparisons using Benjamini-Hochberg multi-test correc-
user demographics from profile images (An and Weber 2016; tion.
Zagheni et al. 2014). Results for our analysis on posted images using image
Facial Presentation & Expression This category contains colors and aesthetic features on TwitterText data set are pre-
facial features that try to capture the self-presentation charac- sented in Tables 3a, using 50 Imagga topics in Table 4, and
teristics of the user. Features include the face ratio (the size analysis on profile images are presented in 3b. The same set
of the face divided by the size of the image), whether the of experiments on mental health outcomes was conducted
face features any type of glasses (reading or sunglasses), the on the TwitterSurvey data set, but were no longer significant
closeness of the subject’s face from the acquisition sensor when controlling for multiple comparisons. This shows the
provided by EmoVU’s attention measurement, the eye open- need for these behaviors to be studied using larger samples.
ness and the 3D face posture, which includes the pitch, roll However, we validated the language prediction model to pre-
and yaw angle of the face. dict scores on TwitterSurvey, which yielded a correlation of
For facial emotion detection, we use Ekman’s model of .12 and .20 with depression and anxiety respectively. Com-
six discrete basic emotions: anger, disgust, fear, joy, sadness pared to other psychological outcomes such as personality,
and surprise, which were originally identified based on facial these correlations are consistent e.g. (Segalin et al. 2017;
expressions (Ekman and Friesen 1971). We use the EmoVU Reece and Danforth 2017; Jaidka et al. 2018).
API to automatically extract these emotions, as well as neutral
expression (Batty and Taylor 2003), from the largest detected Posted Images
face in each profile image. The six basic emotions can be In Figure 2, we visualize random images from users with top
categorized as either positive (joy and surprise) or negative and bottom 25% percentile of both depression and anxiety
(anger, disgust, fear, sadness). Along with the basic emo- scores. Users scoring high in both depression and anxiety
tional expressions, EmoVU also gives composite features: have a preference to post images which are grayscale, less
Expressiveness is the highest value of the six basic emotions; intense in colors (low saturation) and in the diversity of col-
Negative and positive mood are calculated as the maximum ors (low hue count), low in arousal and low on all attributes
value of the positive and negative emotions respectively; va- of aesthetics. Further, users high in depression post images
lence is the average of the negative mood and positive mood. which emphasize foreground objects and are low in bright-
Also, we add the smiling degree provided by Face++. ness. Content analysis shows that users high in both traits are
posting images containing text (3d, alphabet..), images of
Analysis animals (animals, cat..), while users low in depression and
anxiety post images of sports (action,audience..), nature
We perform univariate correlation tests between each feature (artistic, astrology), every day things (apartment, bed..),
and mental health condition to uncover the associated image meals (cuisine, delicious..), motor vehicles (automobile,
car..), outdoor activities (bicycle, bike..). We note that the
3
http://faceplusplus.com/ associations are stronger for most topics for depression, indi-
4
http://emovu.com/ cating this outcome is more strongly associated with imageFeature Demographics MentalHealth posting preferences.
Colors Gender Age Dep Anx Apart from these themes, anxious users specifically are seen
Grayscale .157 -.237 .301 .258 to post portraits and selfies (tagged as adult, attractive..),
Brightness -.113 -.099 -.109
Saturation -.167 .317 -.178 -.112
corporate environments (businessman, corporate..), and
Pleasure .216 -.103 .093 .060 depressed users are seen to post more animal related images
Arousal -.170 .169 -.155 -.097 (ape, aquatic mammal..). Whereas people low in depres-
Dominance -.154 .052 .052 .011 sion score post vacation related images (beach,coast..).
Hue Count -.151 .057 -.229 -.127
Warm Colors .156 -.091 .083 Profile Images
Aesthetics Gender Age Dep Anx
Color Harmony .201 -.151 -.135
Choice of profile pictures uncovers more insight into the
Motion Blur -.153 .260 -.090 -.142 behavior of users with mental health conditions; while de-
Lighting -.062 .236 -.212 -.151 pressed users preferred images which are not sharp and which
Content .176 -.109 -.068 do not show face, anxious users usually chose sharper images
Repetition -.121 .157 -.096 -.087 with multiple people in them.
Depth of Field -.067 .154 -.102 -.061
Vivid Color -.162 .283 -.275 -.189 Prediction
Symmetry .120 .282 -.274 -.189
Object Emphasis .136 .093 Finally, we investigate the accuracy of visual features in
Balancing Element .039 .089 predicting the mental health conditions. We use linear regres-
Overall Aesth. Score -.067 .239 -.155 -.124 sion with ElasticNet regularization (Zou and Hastie 2005) as
Meta Gender Age Dep Anx our prediction algorithm and report results on 10 fold cross-
% Image posts .049 -.136 .128 .276 validation (sampled such that users in the training set are
% Posts with People -.195 .066 not present in the test set). Performance is measured using
(a) Posted Images Pearson correlation (and Mean Squared Error in brackets)
Feature Demographics MentalHealth across the 10 folds.
Colors Gender Age Dep Anx We also explore whether incorporating author attributes
Brightness .043 .045 such as age and gender in the joint modeling of depression
Contrast .033 -.08 -.011 and anxiety can improve prediction performance. We achieve
Hue .044 this by introducing a different set of regularization constraints
Image Composition Gender Age Dep Anx in the ElasticNet optimization function, a method known as
Hue Count .045 l2/1 norm regularization (Liu, Ji, and Ye 2009) (denoted
Visual Weight .043 .045 as MT in the results). In single-task learning, we used im-
Image Type Gender Age Dep Anx age features as predictors and each mental health variable
One Face -.532 -.300 .142 .077
as outcome in a separate regression with ElasticNet regular-
Num. of Faces .165 -.242 -.121
Facial Presentation Gender Age Dep Anx ization. For multi-task learning, we used both demographics
Reading Glasses .091 -.581 .064 .064 (age and gender) and mental health outcomes (depression or
Sunglasses -.758 .068 .071 anxiety) in the same regression using L1/L2 mixed-norm as
Pitch Angle .274 -.518 regularizer to exploit the underlying implicit correlations in
Yaw Angle .052 mental health and demographic factors. The performance on
Face Ratio .136 .083 the TwitterText data set is shown in Table 5 and on the Twit-
Facial Expressions Gender Age Dep Anx terSurvey data set is shown in Table 6. For single-task (ST),
Smiling -.185 .074 we tried support vector regression and L1 and L2 regulariza-
Anger -.258 .349 .082 tion for linear regression and found no significant difference
Disgust -.431 -.137 in results. To be consistent in comparing the same methods
Fear -.281 .148 in ST and MT, we used ElasticNet regularization and linear
Joy .135 -.066 -.149
Neutral .237 .149 .064
regression for both. Combination of several feature sets is
Expressiveness -.082 -.143 also tested and termed as Combination in the Tables.
Negative Mood -.166 -.078 We find that multi-task learning offers significant gains over
Positive Mood .126 -.136 single task learning for posted images (see Table 5a). While
VGG penultimate features do not perform as well as others
(b) Profile Images at predicting depression, multi-task learning boosts the per-
Table 3: Pearson correlations between color and aesthetic features formance by almost 80%. MT shows an advantage for both
extracted from posted and profile images and mental health condi-
depression (r = .619 for MT vs .554 for ST) and anxiety (r =
tions, and with age and gender (coded as 1 for female, 0 for male)
separately and used age as a continuous variable. Correlations for .580 vs .532) in Table 5a. While colors and aesthetics do not
mental health conditions are controlled for age, gender and other see a big jump from single-task to multi-task learning, deep
mental health condition. Positive correlations are highlighted with learning based methods see a drastic improvement. However,
green (p < .01, two-tailed t-test) and negative correlations with red this is not the case with profile images; multi-task learning
(p < .01, two-tailed t-test). Correlations which are not significant shows very similar performance as single-task learning.
are not presented. On profile images, image-based demographic predictionsr dep r anx Image Tag Clusters r dep r anx Image Tag Clusters
(More depressed and anxious) (Less depressed and anxious)
3d, alphabet, book, capital, document, font, pen, text, action, active, aerobics, athlete, balance beam, ball,
.196 .163 .243 .151
typescript ballplayer, barbell, baseball
affenpinscher, american staffordshire terrier, and, ap- audience, championship, cheering, competition,
.120 .124 .233 .129
penzeller, arctic fox, australian terrier crowd, event, flag, lights, match
adult, attractive, beard, brunette, caucasian, face, fash- artistic, astrology, astronomy, atmosphere, azure,
—- .122 .057 .114
ion, glamour, gorgeous buildings, business district
animals, cat, domestic cat, egyptian cat, eye, feline, apartment, bed, bedclothes, bedroom, bed-
.147 .109 .134 .100
fur room furniture, blanket
angora, badger, bunny, cavy, easter, footed ferret, asphalt, avenue, broom, cleaning implement, express-
.141 .096 .096 .083
fox squirrel, guinea pig way, highway
businessman, businesspeople, confident, corporate, ex- button, buttons, circle, design, glossy, graphic, icon,
—- .062 —- .076
ecutive, handsome, manager icons, internet
baby, boy, boyfriend, brother, buddy, child, childhood, alp, alpine, alps, autumn, canyon, cascade, cold, creek,
—- .059 .053 .073
children, couple crystal
african chameleon, african crocodile, agama, agamid, aroma, caffeine, cappuccino, china, coffee, cof-
.110 .057 .079 .064
alligator, american alligator fee mug, crockery, cup
bank, banking, bill, book jacket, cash, comic book, cuisine, delicious, dinner, dish, gourmet, lunch, meal,
.063 —- .057 .056
currency, finance, financial meat, plate, restaurant, tasty, vegetable
aquatic mammal, dugong, eared seal, electric ray, automobile, car, convertible, drive, motor, mo-
.052 —- .064 .052
great white shark, hammerhead, ray tor vehicle, speed, sports car
ape, capuchin, chimpanzee, gorilla, macaque, mar- bicycle, bike, built, carriage, cart, horse cart, moun-
.050 —- .054 .048
moset, monkey, orangutan, primate tain bike, minibike, moped
bagel, baked, baked goods, bakery, bread, breakfast,
.052 .051
bun, burger, cheeseburger, cracker
bay, beach, coast, coastline, fence, idyllic, island, ob-
.061 —-
struction, ocean, palm, paradise, relaxation, resort
Table 4: Pearson correlations between Imagga tag clusters extracted from posted pictures and mental health conditions. All correlations are
significant at p < .05, two-tailed t-test, Benjamini-Hochberg corrected. Results for depression and anxiety are controlled for age and gender.
Tags are sorted by occurrence in our data set within a cluster. ‘–‘ indicates that the tag cluster is not significantly associated with Depression
(dep) and/or Anxiety (anx).
Depression Anxiety
outperform other features, due to the dependence of mental Feature set # Feat
ST MT ST MT
health conditions on age, gender and race, followed by facial Colors 44 .446 (.811) .449 (.802) .441 (.815) .446 (.803)
Aesthetics 10 .434 (.818) .434 (.810) .380 (.866) .377 (.857)
expressions and the aesthetic attributed of the profile image. Imagga 500 .443 (.836) .509 (.742) .426 (.837) .483 (.766)
Predicting anxiety using profile images is more accurate than VGG Penultimate (fc7) 4096 .343 (1.022) .603 (.644) .351 (.890) .555 (.693)
VGG Classes 1000 .438 (.821) .520 (.731) .442 (.811) .505 (.747)
predicting depression, suggesting that a single profile image Combination 5 .554 (.689) .619 (.613) .532 (.715) .580 (.661)
might be able to provide more information about anxiety. (a) Posted Images
However, a set of posted images are required to predict de- Depression Anxiety
Feature set # Feat
pression with a reasonable accuracy. ST MT ST MT
Colors 44 .084 (.997) .101 (.989) .133 (.986) .146 (.978)
We then examine if using text-predicted outcomes as prox- Image Composition 10 .038 (1.006) .046 (.997) .056 (1.001) .059 (.996)
ies for survey labels can improve performance in predicting Image Type 5 .069 (1.001) .070 (.995) .046 (1.002) .049 (.997)
Image Demographics 5 .254 (.939) .255 (.922) .403 (.839) .403 (.846)
more reliable survey based outcomes (not shown in any Ta- Facial Presentation 7 .056 (1.001) .056 (.984) .059 (1.000) .061 (1.007)
Facial Expressions 14 .170 (.976) .174 (.938) .133 (.989) .137 (.979)
ble). We evaluated the performance of models trained on Aesthetics 12 .111 (.993) .114 (.986) .100 (.994) .108 (.988)
TwitterText when tested on TwitterSurvey, and found that Combination 7 .305 (.880) .311 (.873) .427 (.815) .429 (.813)
the performance (r = .164 using aesthetics) is similar to the (b) Profile Images
best performing model trained and tested on TwitterSurvey Table 5: TwitterText: Prediction results for mental health con-
(r = .167) for depression, but however outperforms the corre- ditions with all features. Performance is measured using Pearson
sponding model for anxiety (r = .223 when transfer learning correlation (and MSE in parenthesis) in 10-fold cross-validation.
from TwitterText to TwitterSurvey vs. r = .175 when trained ST represents Single-Task learning and MT represents Multi-Task
and tested on TwitterSurvey). This shows that text-predicted learning
labels can be used as proxies in analyzing image-posting
behavior when studying mental health.
ety.
Discussion Regarding depression, perhaps with the highest face valid-
In this paper, we explored how depression and anxiety traits ity, in profile images of depressed users the facial expressions
can be automatically inferred by just looking at images that show fewer signs of positive mood (less joy and smiling),
users post and set as profile pictures. We compared five dif- and are appear more neutral and less expressive. Previous
ferent visual feature sets (extracted from posted images and findings suggest that social desirability and self-presentation
profile pictures) and the findings about image features as- biases generally discourage the sharing of negative informa-
sociated with mental illness in large part confirm previous tion about the self (such as negative emotion in a society that
findings about the manifestations about depression and anxi- values positivity), instead, negative emotion is often mani-Depression Anxiety
Feature set # Feat
ST MT ST MT less clearer set of associations that could distinguish them
Colors 44 .070 (1.06) .113 (.996) .120 (1.03) .086 (1.02) from the norm (all correlations < .1). Similar to depressed
Aesthetics 10 .065 (1.07) .068 (1.01) .038 (1.00) .130 (.998)
Imagga 500 .157 (1.06) .160 (1.00) .104 (1.23) .128 (1.01) users, anxious users images are more grayscale and lack aes-
VGG Penultimate (fc7)
VGG Classes
4096
1000
.062 (1.06) .143 (.999)
.036 (1.11) .045 (.999)
.118 (1.16) .126 (1.02)
.140 (1.01) .148 (1.00)
thetic cohesion across a variety of image features here too
Combination 5 .151 (1.01) .167 (.975) .167 (1.01) .175 (1.00) suggesting a lack of responsiveness to traditional markers
Table 6: TwitterSurvey: Prediction results for mental health condi- of beauty and emotional balance. Again, the emotional cir-
tions with all features on posted images. Performance is measured cumplex image features (pleasure and arousal) fail to fully
using Pearson correlation (and MSE in parenthesis) in 10-fold cross- capture the anxious experience, as anxious individuals are
validation. ST represents Single-Task learning and MT represents generally understood to experience more (not less) arousal,
Multi-Task learning and less (not more) pleasure.
In terms of Imagga tag clusters of posted images, the profile
in large part overlaps with that of depression with generally
fested as a lack of expression of positive emotion (Dibble lower effect sizes compared to normative users, suggesting
and Levine 2013), as evident in this study. Additionally, de- that anxiety is not as observable in the image choices as de-
pressed individuals profile pictures are marked by the fact pression. Anxious users additionally seem to post marginally
that they are more likely to contain a single face (that of the more content related to family and work; aspects of social
user), rather than show the user surrounded by friends. In anxiety may here manifest as the wish to signal fulfillment
fact, focus on the self is one of the most consistent markers of of typical role obligations.
negative emotionality and depression in particular (Tackman We observe that multi-task learning improves the perfor-
et al. 2018); in language studies of depression, the use of first mance of mental health assessment confirming the need to
personal singular pronouns has emerged as one of the most include the personal characteristics of users while building
dependable markers of depression (Edwards and Nicholas S automatic models (Degens et al. 2017). Even though profile
2017) the single user profile picture may very well be its images do not offer high performance in terms of predicting
analogue in the world of image posts. mental health conditions, they offer insights as described
In posted images, depressed individuals post pictures that above. Combined with the findings from posted images, such
are generally less aesthetically pleasing, extending across cues could be used in improving the automatic assessment of
features such as color harmony, lighting, content, repetition, mental health conditions.
depth of field, vividness of color and symmetry in the pictures. A recent meta-analysis of predicting Big-Five personality
These findings suggest perceptual symptoms of depression, from digital traces (Settanni, Azucar, and Marengo 2018)
leading to picture choices that lack coherence and traditional shows that the Big-Five personality dimensions can be pre-
markers of beauty – likely because such lack of order is expe- dicted from social media traces at accuracies ranging from
rienced to be more representative of the psychological reality r = .29 to .40 (generally in cross-validation frameworks on
of depression, which is often without orientation, order and the same data), which roughly match the highest correlations
appreciation of beauty. Finally, the nominally highest corre- that are generally found between psychological traits and ob-
lation among all image features associated with depression servable behaviors in the large psychological literature (r .̃3).
is observed in the increased use of grayscale images, which Depression is more nuanced and a less broad characteristic
may again be the visual expression of the undifferentiated, than any of the Big-Five personality traits, therefore, observ-
monotone emotional experience that marks depression. The ing a cross-validated prediction performance of r = .32 sug-
automatically extracted image features that track the emo- gests very decent model performance. When the same Face-
tional circumplex (pleasure and arousal) fail to fully capture book model is applied to the TwitterSurvey dataset, the ob-
the depressed experience, as depressed posted images show served correlations with the TwitterSurvey survey estimates
less arousal (very much as expected in depression), but nomi- are lower (r = .12 and .20 for depression and anxiety, respec-
nally more pleasure. tively). This is likely due to the fact that Twitter and Facebook
In terms of Imagga tag clusters of posted images, depressed have differences in language, both in terms of vocabulary
users choose images with more text content and animals, (e.g. emoticons) and subject matter use (Jaidka et al. 2018;
neither of which is an obvious marker of depression. Again Zhong et al. 2017; Guntuku et al. 2019). Importantly, these
depression is more strongly manifested in what posted image highly significant correlations (p < .01) nevertheless demon-
content does not cover, which includes a variety of markers strate that the Facebook prediction models encode significant
of the psychologically well-adjusted life: sports (specifically mental health information that can be used to estimate the
team sports), recreational activities that include outdoor activ- mental health status of Twitter users.
ities, driving, bicycles and beaches and vacation, in addition
few references to food and beverages. Limitations and Future Work
Regarding anxiety, the facial expression in profile picture Our work has some limitations: first, though we show that
do not show fewer positive emotions, in fact, nominally more the weak text-labeled mental health scores on TwitterText
smiling is observed. Frequently, anxiety includes elements are reliable, by testing a model trained on TwitterText on
of social anxiety, which may interact with the social desir- TwitterSurvey, where ground truth was collected using sur-
ability biases inherent in social media sharing to generate a veys, further work on creating large-scale datasets is required
facade of well-being anxious people are frequently referred to uncover other dimensions of depressed and anxious be-
to as “the worried well;” their profile images show a much havior using stronger measures. Further, we use only oneprofile picture per user in our analysis. It would be a promis- social media to glean insight and develop predictive models to
ing research direction to conduct a study with experience automatically assess users’ mental health conditions. While
sampling where images across time are collected along with there are several flip sides of such technologies when used
users’ response to questionnaires to study the temporal ori- for incorrect motives such as pre-screening by insurance or
entation of mental health conditions and how their social employers to discriminate against specific individuals, this
media imagery changes as a consequence, potentially using research is very useful to develop techniques of providing
smartphone based data collection (Singh and Agarwal 2016). summarized feedback both to social media users and their
Further, we consider only the image-based features due to clinicians about social media activity to help them quantify
the initial premise, which we’ve seen to be true in our re- the extent to which their mental health condition has shown
sults, that visual imagery can uncover several strong signals its footprint in the digital world; we hypothesize that such a
for mental health conditions. Users’ social network features, consent-based sharing can help in more productive therapy
coupled with image posting behavior and also text, could sessions, apart from the opportunity that the user has to self-
further enhance the understanding about the manifestation of regulate. Thus, data collection, processing and dissemination
depression and anxiety (Hong et al. 2017). of resulting models has to keep the privacy of users as top
Another direction of work could assess if predic- priority and should be for discovering new insights into the
tive/automatic assessments of mental health could outper- manifestation of mental health conditions and to better assist
form third-party human assessments, as has been seen in clinicians.
other works (Segalin et al. 2017). Also, we did not collect the
date of first onset of depression from the users; this data could Conclusion
be used to test if social-media based machine assessments
We analyzed image posting and profile picture preferences
could be used as an early screening tools to help clinicians
using interpretable Imagga tag clusters, colors. aesthetic and
in identifying at patients at risk of mental health disorders,
facial features with the aim of identifying the way and extent
which usually manifest early on platforms like social me-
to which they reveal users’ mental health conditions based on
dia (De Choudhury, Counts, and Horvitz 2013). Finally, we
the images they post and select as profile pictures on Twitter.
also do not consider predicting depression and anxiety as a
For example, images posted by depressed and anxious users
classification task as it is not easy to binarise mental health
tend to be dominated by grayscale, low arousal images lack-
conditions using median or quartile-split (Beck, Steer, and
ing in aesthetic sense, while anxious users are characterized
Brown 1996) and a continuous score can often be helpful in
by posting more images compared to regular users and users
personalizing the diagnosis and treatment for patients, and
with depression. The choice of profile pictures uncovers that
also serve as a risk assessment tool for providers.
depressed users prefer images which are not sharp and which
As a benchmark, the diagnosis and differentiation of mental do not contain a face, anxious users usually chose sharper
health conditions is difficult and costly. The gold standard of images with multiple faces in them. Results indicate that
clinical psychological diagnosis used in the therapy effective- multi-task learning gives significant improvements in perfor-
ness literature are Structured Clinical Interviews for the Di- mance for modelling mental health conditions jointly with
agnostic and Statistical Manual of Mental Disorders (SCIDs). demographics (here age and gender), factors which clinicians
They involve a trained clinicians interviewing the patient in usually consider while diagnosing patients. Further, models
person for at least about an hour, using a guide that serves as trained on larger data sets using text-predicted outcomes show
a decision tree. Passive approaches that analyze digital traces reliable performance when predicting more reliable survey
left online are at this point substantially less powerful in their based mental health outcomes. Our results offer new insights
ability to detect the presence of mental health conditions, in and a promising avenue for future mental health research of
part because they are unobtrusive (unlike validated clinical individuals.
surveys like the PHQ-9, which have 80%+ sensitivity and
90%+ specificity compared to the SCID baselines (Gilbody
et al. 2007)). In terms of improving the unobtrusive detection
References
of mental health conditions, the next step for the field ap- Al Moubayed, N.; Vazquez-Alvarez, Y.; McKay, A.; and
pears to be multi-modal approaches that combine the relative Vinciarelli, A. 2014. Face-Based Automatic Personality
power of different feature spaces. Specifically, text-based Perception. MM.
analyses of social media ought be combined with those of An, J., and Weber, I. 2016. # greysanatomy vs.# yankees:
text messages and other instant messaging communication, Demographics and Hashtag Use on Twitter. ICWSM.
and with analyses of image content being shared, as in this
Andalibi, N.; Ozturk, P.; and Forte, A. 2015. Depression-
study. Importantly, the more domains of communication are
related imagery on instagram. In Proceedings of the 18th
covered outside of social media, the more such data feeds
ACM Conference Companion on Computer Supported Coop-
can cover lack of information being shared on social media,
erative work & social computing, 231–234. ACM.
as may occur during sensor depression. In addition, phone or
wearable data can give estimates as to the users activity levels Batty, M., and Taylor, M. J. 2003. Early Processing of the
and sleeping hours (which are closely related to diagnosis Six Basic Facial Emotional Expressions. Cognitive Brain
criteria for depression). Further, the results in this study do Research 17(3).
not imply causality, but are correlational. Beck, A. T.; Steer, R. A.; and Brown, G. K. 1996. Beck
Our paper studies the significance of using visual traces on depression inventory-ii. San Antonio 78(2):490–8.Bigun, J. 2006. Vision with Direction: A Systematic Intro- Gilbody, S.; Richards, D.; Brealey, S.; and Hewitt, C. 2007.
duction to Image Processing and Vision. Screening for depression in medical settings with the pa-
Bijl, R. V.; Ravelli, A.; and Van Zessen, G. 1998. Prevalence tient health questionnaire (phq): a diagnostic meta-analysis.
of psychiatric disorder in the general population: results of Journal of general internal medicine 22(11):1596–1602.
the netherlands mental health survey and incidence study Guntuku, S. C.; Qiu, L.; Roy, S.; Lin, W.; and Jakhetiya,
(nemesis). Social psychiatry and psychiatric epidemiology V. 2015. Do others perceive you as you want them to?:
33(12):587–595. Modeling personality based on selfies. In Proceedings of
Bouma, G. 2009. Normalized (Pointwise) Mutual Informa- the 1st International Workshop on Affect & Sentiment in
tion in Collocation Extraction. GSCL. Multimedia, 21–26. ACM.
Burdick, A.; Drucker, J.; Lunenfeld, P.; Presner, T.; and Guntuku, S. C.; Zhou, J. T.; Roy, S.; Weisi, L.; and Tsang,
Schnapp, J. 2012. Digital Humanities. I. W. 2016. Who likes what, and why? insights into person-
ality modeling based on imagelikes’. IEEE Transactions on
Celli, F.; Bruni, E.; and Lepri, B. 2014. Automatic Personality Affective Computing.
and Interaction Style Recognition from Facebook Profile
Pictures. MM. Guntuku, S. C.; Lin, W.; Carpenter, J.; Ng, W. K.; Ungar,
L. H.; and Preoţiuc-Pietro, D. 2017a. Studying personality
Chancellor, S.; Kalantidis, Y.; Pater, J. A.; De Choudhury, through the content of posted and liked images on twitter. In
M.; and Shamma, D. A. 2017. Multimodal classification of Proceedings of the 2017 ACM on web science conference,
moderated online pro-eating disorder content. In CHI. 223–227. ACM.
Costa, P., and McCrae, R. 2008. The Revised NEO Personal- Guntuku, S. C.; Yaden, D. B.; Kern, M. L.; Ungar, L. H.; and
ity Inventory (NEO-PI-R). SAGE Publications Ltd. Eichstaedt, J. C. 2017b. Detecting depression and mental ill-
Datta, R.; Joshi, D.; Li, J.; and Wang, J. Z. 2006. Studying ness on social media: an integrative review. Current Opinion
Aesthetics in Photographic Images Using a Computational in Behavioral Sciences 18:43–49.
Approach. ECCV. Guntuku, S. C.; Buffone, A.; Jaidka, K.; Eichstaedt, J.; and
De Choudhury, M.; Counts, S.; and Horvitz, E. 2013. Social Ungar, L. 2019. Understanding and measuring psychological
media as a measurement tool of depression in populations. In stress using social media.
Proceedings of the 5th Annual ACM Web Science Conference, Gur, R. C.; Erwin, R. J.; Gur, R. E.; Zwil, A. S.; Heimberg,
WebScience, 47–56. C.; and Kraemer, H. C. 1992. Facial emotion discrimination:
Degens, N.; Endrass, B.; Hofstede, G. J.; Beulens, A.; and Ii. behavioral findings in depression. Psychiatry research
André, E. 2017. what i see is not what you get: why 42(3):241–251.
culture-specific behaviours for virtual characters should be Hong, R.; He, C.; Ge, Y.; Wang, M.; and Wu, X. 2017.
user-tested across cultures. AI & society 32(1):37–49. User vitality ranking and prediction in social networking
Dibble, J. L., and Levine, T. R. 2013. Sharing good and bad services: A dynamic network perspective. IEEE Transactions
news with friends and strangers: Reasons for and communi- on Knowledge and Data Engineering 29(6):1343–1356.
cation behaviors associated with the mum effect. Communi- Huang, K.-Q.; Wang, Q.; and Wu, Z.-Y. 2006. Natural Color
cation Studies 64(4):431–452. Image Enhancement and Evaluation Algorithm Based on
Edwards, T., and Nicholas S, H. 2017. A meta-analysis Human Visual System. Computer Vision and Image Under-
of correlations between depression and first person singular standing 103(1).
pronoun use. Journal of Research in Personality 68:63–68. Jaidka, K.; Guntuku, S. C.; Buffone, A.; Schwartz, H. A.;
Ekman, P., and Friesen, W. V. 1971. Constants across Cul- and Ungar, L. 2018. Facebook vs. twitter: Differences in
tures in the Face and Emotion. Journal of Personality and self-disclosure and trait prediction. In Proceedings of the
Social Psychology 17(2). International AAAI Conference on Web and Social Media.
Farnadi, G.; Tang, J.; De Cock, M.; and Moens, M.-F. 2018. Ke, Y.; Tang, X.; and Jing, F. 2006. The Design of High-level
User profiling through deep multimodal fusion. In Pro- Features for Photo Quality Assessment. CVPR.
ceedings of the 11th ACM International Conference on Web Kong, S.; Shen, X.; Lin, Z.; Mech, R.; and Fowlkes, C. 2016.
Search and Data Mining. ACM. Photo aesthetics ranking network with attributes and content
Ferwerda, B., and Tkalcic, M. 2018. You are what you adaptation. In ECCV.
post: What the content of instagram pictures tells about users Lampos, V.; Aletras, N.; Preoţiuc-Pietro, D.; and Cohn, T.
personality. In The 23rd International on Intelligent User 2014. Predicting and Characterising User Impact on Twitter.
Interfaces. EACL.
Ferwerda, B.; Schedl, M.; and Tkalčič, M. 2016. Using Insta- Liu, L.; Preoţiuc-Pietro, D.; Riahi, Z.; Moghaddam, M. E.;
gram Picture Features to Predict Users’ Personality. MMM. and Ungar, L. 2016. Analyzing Personality through Social
Garimella, V. R. K.; Alfayad, A.; and Weber, I. 2016a. Social Media Profile Picture Choice. ICWSM.
Media Image Analysis for Public Health. CHI. Liu, J.; Ji, S.; and Ye, J. 2009. Multi-task feature learning
Garimella, V. R. K.; Alfayad, A.; and Weber, I. 2016b. Social via efficient l 2, 1-norm minimization. UAI, 339–348.
Media Image Analysis for Public Health. CHI. Machajdik, J., and Hanbury, A. 2010. Affective ImageClassification Using Features Inspired by Psychology and A meta-analysis. Cyberpsychology, Behavior, and Social
Art Theory. MM. Networking 21(4):217–228.
Manikonda, L., and De Choudhury, M. 2017. Modeling and Shi, J., and Malik, J. 2000. Normalized Cuts and Image
understanding visual attributes of mental health disclosures Segmentation. Transactions on Pattern Analysis and Machine
in social media. In Proceedings of the 2017 CHI Conference Intelligence 22(8).
on Human Factors in Computing Systems, CHI, 170–181. Simonyan, K., and Zisserman, A. Very Deep Convolutional
McCrae, R. R., and John, O. P. 1992. An Introduction Networks for Large-Scale Image Recognition. CoRR.
to the Five-factor Model and its Applications. Journal of Singh, V. K., and Agarwal, R. R. 2016. Cooperative pho-
Personality 60. neotypes: exploring phone-based behavioral markers of co-
Mehrabian, A., and Russell, J. A. 1974. An Approach to operation. In Proceedings of the 2016 ACM International
Environmental Psychology. MIT Press. Joint Conference on Pervasive and Ubiquitous Computing,
Meyer, G. J.; Finn, S. E.; Eyde, L. D.; Kay, G. G.; More- 646–657. ACM.
land, K. L.; Dies, R. R.; Eisman, E. J.; Kubiszyn, T. W.; and Skowron, M.; Tkalčič, M.; Ferwerda, B.; and Schedl, M.
Reed, G. M. 2001. Psychological testing and psychologi- 2016. Fusing Social Media Cues: Personality Prediction
cal assessment: A review of evidence and issues. American from Twitter and Instagram. WWW Companion.
psychologist 56(2):128. Suchman, E. A. 1962. An analysis of ‘bias’ in survey re-
Ng, A. Y.; Jordan, M. I.; and Weiss, Y. 2002. On Spectral search. Public Opinion Quarterly 102–111.
Clustering: Analysis and an Algorithm. NIPS. Tackman, A. M.; Sbarra, D. A.; Carey, A. L.; Donnellan,
Nie, J.; Cui, P.; Yan, Y.; Huang, L.; Li, Z.; and Wei, Z. 2014. M. B.; Horn, A. B.; Holtzman, N. S.; Edwards, T. S.; Pen-
How your Portrait Impresses People?: Inferring Personality nebaker, J. W.; and Mehl, M. R. 2018. Depression, nega-
Impressions from Portrait Contents. In Proceedings of the tive emotionality, and self-referential language: A multi-lab,
22nd ACM International Conference on Multimedia, MM, multi-measure, and multi-language-task research synthesis.
905–908. Journal of personality and social psychology.
Nie, L.; Zhang, L.; Yang, Y.; Wang, M.; Hong, R.; and Chua, Valdez, P., and Mehrabian, A. 1994. Effects of Color on
T.-S. 2015. Beyond doctors: Future health prediction from Emotions. Journal of Experimental Psychology 123(4).
multimedia and multimodal observations. In Proceedings von Luxburg, U. 2007. A Tutorial on Spectral Clustering.
of the 23rd ACM international conference on Multimedia, Statistics and Computing 17(4).
591–600. ACM. Wang, P. S.; Lane, M.; Olfson, M.; Pincus, H. A.; Wells,
Nie, J.; Wei, Z.; Li, Z.; Yan, Y.; and Huang, L. 2018. Under- K. B.; and Kessler, R. C. 2005. Twelve-month use of mental
standing personality of portrait by social embedding visual health services in the united states: results from the national
features. Multimedia Tools and Applications 1–20. comorbidity survey replication. Archives of general psychia-
Preoţiuc-Pietro, D.; Liu, Y.; Hopkins, D.; and Ungar, L. 2017. try 62(6):629–640.
Beyond binary labels: political ideology prediction of twitter Wang, K.; Zhai, S.; Cheng, H.; Liang, X.; and Lin, L. 2016.
users. In Proceedings of the 55th Annual Meeting of the Human pose estimation from depth images via inference
Association for Computational Linguistics (Volume 1: Long embedded multi-task learning. In Proceedings of the 2016
Papers), volume 1, 729–740. ACM on Multimedia Conference, 1227–1236. ACM.
Reece, A. G., and Danforth, C. M. 2017. Instagram photos Wexner, L. B. 1954. The Degree to which Colors (hues) are
reveal predictive markers of depression. EPJ Data Science. Associated with Mood-tones. Journal of Applied Psychology
38(6).
Samani, Z. R.; Guntuku, S. C.; Moghaddam, M. E.; Preoţiuc-
Pietro, D.; and Ungar, L. H. 2018. Cross-platform and Zagheni, E.; Garimella, V. R. K.; Weber, I.; and State, B.
cross-interaction study of user personality based on images 2014. Inferring International and Internal Migration Patterns
on twitter and flickr. PloS one 13(7):e0198660. from Twitter Data. WWW Companion.
Schwartz, H. A.; Eichstaedt, J.; Kern, M. L.; Park, G.; Sap, Zhong, C.; Chan, H.-w.; Karamshuk, D.; Lee, D.; and Sas-
M.; Stillwell, D.; Kosinski, M.; and Ungar, L. 2014. To- try, N. 2017. Wearing many (social) hats: How different
wards assessing changes in degree of depression through are your different social network personae? arXiv preprint
facebook. In Proceedings of the Workshop on Computational arXiv:1703.04791.
Linguistics and Clinical Psychology: From Linguistic Signal Zou, H., and Hastie, T. 2005. Regularization and Variable
to Clinical Reality, 118–125. Selection via the Elastic Net. Journal of the Royal Statistical
Segalin, C.; Celli, F.; Polonio, L.; Kosinski, M.; Stillwell, Society, Series B.
D.; Sebe, N.; Cristani, M.; and Lepri, B. 2017. What your
facebook profile picture reveals about your personality. In
Proceedings of the 2017 ACM on Multimedia Conference,
460–468. ACM.
Settanni, M.; Azucar, D.; and Marengo, D. 2018. Predicting
individual characteristics from digital traces on social media:You can also read