WHITE OAK CAPITAL MANAGEMENT - White Oak India Top 200 PMS
←
→
Page content transcription
If your browser does not render page correctly, please read the page content below
WHITE OAK CAPITAL MANAGEMENT
 White Oak India Top 200 PMS

 August 2021

 CONFIDENTIAL- DO NOT REPRODUCE OR DISTRIBUTE
 These materials are provided solely on the basis of request received from the recipient and it should not be construed as an investment advice and form a primary basis for any
 person’s or investor’s investment decisions. See the important disclaimer at the end of this presentation.

STRICTLY PRIVATE AND CONFIDENTIAL - DO NOT REPRODUCE OR DISTRIBUTE
Agenda

 i. Introduction, Portfolio Manager Profile & Portfolio Strategy
 ii. Investment Culture & Team Structure
 iii. Portfolio Construction & Risk Management
 iv. White Oak India Top 200 PMS
 v. Case Studies
 vi. Summary of Terms
 vii. Appendix

STRICTLY PRIVATE AND CONFIDENTIAL - DO NOT REPRODUCE OR DISTRIBUTE

White Oak Overview
 Firmwide AUM Split (%) – By Geography
 Company Overview
 Offices:
 AUM 2 : Headcount:
 India, Mauritius, Singapore,
 ~ US$5.3 bn 114
 Switzerland and UK
 20%

• Founded by Prashant Khemka in June 2017

• Prior to White Oak Prashant served as the CIO and Lead PM of
 80%
 both Goldman Sachs India since March 2007, and Global
 Emerging Markets Equity since June 2013
 India Offshore % India Onshore %

• Research underpinned on a ‘proprietary analytical model’ 1

 Firmwide AUM Split (%) – By Type of Investors
 honed over two decades; replicable across markets and
 businesses 5%
 4%

 7%
• Performance first culture built-upon:
 45%
 (a) team of local experts with global experience

 (b) bottom-up stock selection philosophy 39%

 (c) disciplined fundamental research
 Segregated Institutional Accounts
 PB, WM, FO, Retail & HNWI
 (d) balanced portfolio construction Asset Managers, FoF
 Endowment, Foundation
1Trademarked
 Others
 as OpcoFinco™ framework . 2AUM as of 31 August 2021.

STRICTLY PRIVATE AND CONFIDENTIAL - DO NOT REPRODUCE OR DISTRIBUTE 3

Founder’s Profile and Track Record
Extensive investing record across India, GEM and the US
 ▪ Prashant joined Goldman Sachs Asset Management (GSAM) in 2000 in the US Growth Equity team
 ▪ In 2004, he became Senior PM and Co-Chair of the Investment Committee on the US Growth Equity team which managed US$25 bn
 ▪ Returned to Mumbai in 2006 to start GSAM India business, where he served as CIO and CEO / Co-CEO until 2013
 ▪ In 2013, Prashant moved to Singapore as CIO and Lead PM of both India and Global Emerging Markets
 ▪ Directly managed more than US$5.0 bn out of the USD$6.5 bn managed by his team
 ▪ Prashant and the funds managed by him at GSAM earned several awards including Citywire AAA rating and FundCalibre Elite rating
 ▪ Prashant is AAA rated by Citywire based on the three year risk-adjusted performance across all funds he is managing to 31st July 2021

 CIO and Lead PM of GS India Equity CIO and Lead PM of GS GEM Equity
 ▪ Prashant launched GS India Equity strategy in March 2007 with US$ ▪ Prashant took over as CIO and Lead PM of GS GEM Strategy in 2013
 5.0mn seed capital from Goldman Sachs with approximately US$600 mn in total assets
 ▪ Scaled GS India Equity business to US$2.5 bn with distribution ▪ Scaled GEM business to US$2.6 bn with distribution across multiple
 across multiple channels in Europe, Asia, and USA channels in Europe, Asia and USA
 ▪ Since inception the strategy delivered peer group leading ▪ During his tenure, the strategy delivered peer group leading
 cumulative 265.8% gross USD returns1 vs. 66.1% for its benchmark cumulative 36.3% gross USD returns2 vs. 13.1% for its benchmark
 3000 ~ 2.5bn 3000 ~ 2.6bn
 2500 2500
 2000 2000
 1500 1500
 1000 1000 ~ 675mn
 500 0 500
 0
 0
 2007 2017
 2013 2017
 GSAM India Equity AUM (US$ mn) GSAM GEM Equity AUM (US$ mn)
1Past performance Gross of Fees in US$ for GS India Equity Portfolio. 2Past performance Gross of Fees in US$ for GS EM Equity Portfolio.
“Past performance is not a reliable indicator of future results and returns may increase or decrease as a result of currency fluctuations. There can be no assurance that comparable results can be achieved or that
similar investment strategy can be implemented or that investment objectives can be achieved.”

STRICTLY PRIVATE AND CONFIDENTIAL - DO NOT REPRODUCE OR DISTRIBUTE 4
Investment Culture:
 Team, Philosophy, Process &
 Portfolio Construction

STRICTLY PRIVATE AND CONFIDENTIAL - DO NOT REPRODUCE OR DISTRIBUTE
Focused Investment Culture
Performance first

 Team of local experts with global experience Bottom up stock selection based Philosophy
 Strong culture of performance Buy great businesses at attractive values
 Aligned with client portfolio Invest in business, don’t bet on macro
 Judgment
 Edge

 Information India Analytical
 India Portfolio Edge
 Edge
 Portfolio

 Knowledge
 Edge
 Time tested Process Balanced Portfolio Construction
 Disciplined fundamental research Aim to avoid top down bets on macro factors
 Proprietary OpcoFinco™ analytical framework honed over two decades Aim to ensure performance a function of stock selection

STRICTLY PRIVATE AND CONFIDENTIAL - DO NOT REPRODUCE OR DISTRIBUTE 6
Our Team
Well resourced team of local experts with global experience
 Team1 Years of Coverage Team1 Years of Coverage Team1 Years of Coverage
 Experience Experience Experience
 Prashant 23 Founder Manoj Garg 25 Pharma, Sanjay 32 Trading
 Khemka 3 Chemicals, Vaid Advisor
 Auto

 Team2 Years of Coverage Team2 Years of Coverage Team2 Years of Coverage Team2 Coverage
 Experience Experience Experience

 Ramesh 18 Technology, Ayush 9 Technology, Neeraj 4 Industrials Darshak Financials
 Mantri Industrials, Abhijeet Consumer Parkash Lodhiya
 Building Discretionary
 Materials

 Parag 14 Financials Trupti 13 Retail, Chaitanya 3 Trading Srishti Healthcare,
 Jariwala Agrawal Building Kapur Advisor Bhandari Pharma and
 Materials Chemicals

 Rishi 17 Healthcare, Akshay 7 Financials, Dhanashree 2 Trading Divyanshu Metals and
 Maheshwari Consumer, Jogani Telecom Chityala Advisor Sachdeva Building
 Realty Materials

 Rohit 17 Consumer, Aman 3 Forensics, Vishwamithra Technology, Rishab Consumer
 Chordia Telecom Kapadia ESG, Primary Shashishekara Industrials Kothari
 Research

 Sagar Arya 7 Auto, Anand 9 Financials Vineet Narang Pharma, Yash Infrastructure
 Pharma, Bhavnani Auto Verma and
 Chemicals, Industrials
 Consumer

 1Employees of White Oak Capital Partners Pte.. 2White Oak Capital Management Consultants LLP (WOCM) in Mumbai. WOCM also acts as the Investment Advisor, providing non-binding, non-exclusive
 investment research advice to offshore mandates involving Indian securities. 3 The Ratings are based on the manager’s three year risk-adjusted performance across all funds the manager is managing to 31st July
 2021

STRICTLY PRIVATE AND CONFIDENTIAL - DO NOT REPRODUCE OR DISTRIBUTE 7
Investment Philosophy
Outsized returns can be earned over time by investing in great businesses at attractive valuations

 Attributes we look for Factors we evaluate

 Great Business Superior returns on incremental • Industry competitive intensity
 Well managed and
 capital • Sustainable competitive advantage

 scalable business,
 • Industry potential versus current size
 Scalable long term opportunity • Expanding market share and scope
 with superior
 returns on capital
 Strong execution and • Drive to create long-term value
 governance • Interests aligned with minority shareholders

 Our Valuation Framework Insights we derive

 Valuation
 Intrinsic value = present value • Economic FCF rather than accounting one
 Current price at a of future cash flows • Terminal value based on greatness of business

 substantial discount
 Value excess returns on capital • Assess cash flows net of cost of capital
 to intrinsic value vs capital employed • OpcoFinco™ multiples for relative comps

 =
 −

STRICTLY PRIVATE AND CONFIDENTIAL - DO NOT REPRODUCE OR DISTRIBUTE 8
OpcoFinco™ Framework
 ABC Company

 ABC FinCo
 ABC OpCo
 Financing Company
 Operating Company
 Owns all capital investments of
 ABC Capital-light

 PPE PPE rental charge (Operating lease cost)

 Working Working capital financing charge
 Capital
 Taxes Government

 EROIC FCF(Year1, Year2, . . . .)

 Invested Capital (IC) V(ABC Opco) = V(EROIC)
 V(ABC FinCo) = IC V(EROIC) = PV(Excess ROIC cash
 flows)

 = +

 =

STRICTLY PRIVATE AND CONFIDENTIAL - DO NOT REPRODUCE OR DISTRIBUTE 9
Investment Philosophy
Aim to avoid businesses with weaker characteristics

 Poor Weak returns on Substitution or
 corporate governance incremental capital obsolescence risk

 Siphoning of cash or value Excessive competition in Existential threat from
 capital-intensive industry technological developments
 Manipulation of stock prices
 Misallocation of capital
 Unethical business practices
 Empire building Examples
 Misaligned interests Print media from online
 Examples Wind energy from solar
 Examples Conglomeration without Combustion engine from
 Numerous across sectors capabilities electric vehicles
 Certain commodity
 companies
 State-owned enterprises

 Beware of value traps

STRICTLY PRIVATE AND CONFIDENTIAL - DO NOT REPRODUCE OR DISTRIBUTE 10
Investment Process
We distil from a broad investible universe

 Observe a broad universe
 Screen out poor governance
 Avoid weak characteristics
 Investment Universe Stay alert to structural changes
 ~ 750 with MCAP > US$150mn Look for desired attributes

 Identify and research
 great businesses
 Analyse in depth
 Maintain ongoing research
 Great Businesses Assess relative greatness
 ~ 150

 Invest in the attractively valued
 Attractive Value Wait until value emerges
 30 - 50 Act when opportunity presents

STRICTLY PRIVATE AND CONFIDENTIAL - DO NOT REPRODUCE OR DISTRIBUTE 11
Investment Process
We aim to avoid misgoverned companies

 Forms of Misgovernance

 Cheating existing Cheating Investors Unethical or Illegal Misaligned Interests Poor
 Partners Business Conduct or objectives Accounting

 ▪ Siphoning off cash or ▪ Stock price ▪ Unethical means of ▪ Business run for benefit ▪ Aggressive accounting
 value manipulation procuring of promoters assumptions
 contracts
 ▪ Conflicted covert ▪ Price rigging followed ▪ Limited concern for ▪ Transactions without
 related-party by bespoke ▪ Illegal links with shareholder interests business merit
 transactions placements authorities
 ▪ Abusing companies for ▪ Front-loading
 ▪ Different ownership in ▪ Talking up prospects ▪ Illegitimate family planning reasons revenues, back-
 similar businesses ahead of insider sales cartelization ending expenses
 ▪ Different ownership of ▪ Talking up prospects ▪ Earnings smoothing
 new ventures before secondary
 offering

 He that lieth down with dogs shall rise up with fleas – Benjamin Franklin

STRICTLY PRIVATE AND CONFIDENTIAL - DO NOT REPRODUCE OR DISTRIBUTE 12
Investment Process
We aim to adhere to a time tested analytical framework in a disciplined manner

 Company visits & field work Business Assessment
 Supply chain meetings Financial modelling

 Idea
 Analysis
 Generation

 Ongoing Decision &
 Evaluation Sizing

 Business evolution Combination of business & value
 Monitor value gap Compare across opportunities

 Keep perspective of business cycles, rather than accounting years

STRICTLY PRIVATE AND CONFIDENTIAL - DO NOT REPRODUCE OR DISTRIBUTE 13
Portfolio Construction
 & Risk Management

STRICTLY PRIVATE AND CONFIDENTIAL - DO NOT REPRODUCE OR DISTRIBUTE
Portfolio Construction & Risk Management
We aim to ensure performance is a result of skill rather than chance

 • Balanced portfolio of select companies Pro-cyclical companies*
 agnostic to benchmark Counter-cyclical companies*
 Market cycle*
 • Focus on ensuring alpha generation is a
 function of stock selection

 • Aim to consciously avoid market timing or
 sector rotation or other such top-down bets
 Outperformance

 Market Returns
 over the cycle*
 • Understand, monitor, and aim to contain
 residual factor risks that are by-product of
 stock selection

 • Typical exposure limits
 Single stock: 10% at market value
 Single promoter group: 25%
 Single industry: 30%

 We never forget that in macro, we only have hunches: in the micro, we can develop justifiably deep conviction
 - Seth Klarman
 *For Illustration Purpose only

STRICTLY PRIVATE AND CONFIDENTIAL - DO NOT REPRODUCE OR DISTRIBUTE 15
Opportunity Funnel
Higher inefficiencies in mid and small cap

 Overvalued

 Fairly valued Large Cap Mid Cap Small Cap

 Investment opportunities

 Undervalued

STRICTLY PRIVATE AND CONFIDENTIAL - DO NOT REPRODUCE OR DISTRIBUTE 16
Portfolio Strategy

 Investment Objective Sustained capital appreciation through superior returns over time

 Benchmark S&P BSE 200 TR

 Inception Date TBD

 Investment Approach Bottom-up

 Investment Style Style Agnostic

 Market Cap Large and Mid Cap

 Estimated Holdings 30 – 50

STRICTLY PRIVATE AND CONFIDENTIAL - DO NOT REPRODUCE OR DISTRIBUTE 17
White Oak India Top 200 PMS

STRICTLY PRIVATE AND CONFIDENTIAL - DO NOT REPRODUCE OR DISTRIBUTE
Portfolio Performance
22 January 2021 - 31 August 2021

 Benchmark % Excess Returns S&P BSE 100 S&P BSE 150 S&P BSE 250
 ` Fund
 BSE 200 TR (bps) Large cap Mid cap Small cap

 August 2021 6.4% 7.4% -104 8.4% 1.9% -2.8%

 Q2 2021 10.4% 8.9% +153 8.2% 14.4% 20.8%

 S.I. (Cumulative) 24.7% 22.5% +222 21.1% 34.3% 39.9%

 1All indices are Net Total Return. Fund performance in INR v/s S&P BSE 200 TR Index. Performance related information provided herein is not verified by SEBI. Past performance is not a
 reliable indicator of future results.

STRICTLY PRIVATE AND CONFIDENTIAL - DO NOT REPRODUCE OR DISTRIBUTE 19
Market Cap Attribution Analysis
Stock selection drives performance : 22 January 2021 - 31 August 2021

 Attribution by Market Cap1
 Sector Fund Benchmark Attribution
 Average Total Average Total Selection Allocation Total
 Large Cap Weight Return Weight Return Effect Effect Attribution
 (%) (%) (%) (%) (%) (%) (%)

 Large Cap 65.0 21.0 87.3 22.1 -1.0 0.1 -0.8
 Mid Cap

 Mid Cap 29.1 49.9 12.7 24.8 6.0 0.6 6.6

 Small Cap Small Cap 0.6 -2.5 0.0 30.0 0.0 0.0 -0.1

 -2 - 2 4 6 8 Cash/Futures/Others 5.3 0.0 0.0 0.0 - - -0.3

 Total Attribution (%) Allocation Effect (%) Selection Effect (%) Total 100.0 27.9 100.0 22.5 5.0 0.4 5.4

 1Bloomberg Attribution Analysis. Performance is gross of fees, taxes and expenses. Market Cap Classification as per Securities and Exchange Board of India (SEBI) guidelines for
 Mutual Funds. Performance related information provided herein is not verified by SEBI. Past performance is not a reliable indicator of future results.

STRICTLY PRIVATE AND CONFIDENTIAL - DO NOT REPRODUCE OR DISTRIBUTE 20
Sector Attribution Analysis
Stock selection drives performance : 22 January 2021 - 31 August 2021

 Attribution by Sector1
 Sector Fund Benchmark Attribution
 Average Total Average Total Selection Allocation Total
 Comm Services Weight Return Weight Return Effect Effect Attributio
 (%) (%) (%) (%) (%) (%) n (%)
 Consumer Disc
 Comm Services 0.8 24.2 2.7 8.1 0.1 0.4 0.5
 Consumer Staples
 Consumer Disc 8.4 22.9 7.7 4.0 1.7 -0.2 1.5
 Energy
 Consumer Staples 7.6 12.8 8.6 17.1 -0.4 0.1 -0.4
 Financials Energy 0.0 0.0 9.7 13.0 0.0 1.0 1.0
 Health Care Financials 37.4 26.4 33.2 19.4 2.3 -1.0 1.3
 Industrials Health Care 10.0 38.2 5.3 21.3 1.5 -0.2 1.3

 Information Tech Industrials 4.5 41.2 5.8 34.2 0.3 -0.1 0.3

 Materials Information Tech 17.3 51.8 13.4 27.2 3.9 -0.4 3.5
 Materials 8.1 19.7 9.5 51.5 -2.1 -0.3 -2.5
 Real Estate
 Real Estate 0.7 17.1 0.5 16.7 0.0 0.0 0.1
 Utilities
 Utilities 0.0 0.0 3.5 52.0 0.0 -0.8 -0.8
 -5 -4 -3 -2 -1 - 1 2 3 4 5
 Cash/Futures/Others 5.3 0.0 0.0 0.0 - - -0.4
 Allocation Effect (%) Selection Effect (%) Total 100.0 27.9 100.0 22.5 7.4 -1.9 5.4

 1 BloombergAttribution Analysis: GICS Classification. Performance is gross of fees, taxes and expenses. Performance related information provided herein is not verified by SEBI. Past
 performance is not a reliable indicator of future results.

STRICTLY PRIVATE AND CONFIDENTIAL - DO NOT REPRODUCE OR DISTRIBUTE 21
Portfolio Performance
Top 10 contributors and detractors for 22 January 2021 - 31 August 2021

 Ending Total Return Contribution Ending Total Return Contribution
 Top 10 Contributors Top 10 Detractors
 Weight (%) (%) to Alpha (bps) Weight (%) (%) to Alpha (bps)

Coforge 4.2 +110.5 +269 Indigo Paints 2.3 -3.9 -85
Bajaj Finserv 2.9 +89.1 +141 HDFC Bank 7.2 +10.0 -70
Persistent Systems 3.0 +117.4 +140 Nestle India 5.0 +11.3 -60
Dr. Lal PathLabs 1.2 +77.4 +85 Axis Bank 5.4 +1.5 -41
Navin Fluorine International 1.9 +61.6 +72 Intellect Design Arena 0.9 -13.9 -32
Mphasis 2.9 +81.2 +66 IndiaMART InterMESH 0.2 +0.8 -27
Astral 2.2 +63.9 +57 HDFC Asset Management 0.0 -5.9 -15
Cholamandalam Investment 3.7 +31.8 +54 Larsen & Toubro Infotech 0.0 -7.5 -14
ICICI Bank 8.2 +35.1 +38 Cipla 2.3 +17.9 -13
Gland Pharma 0.2 +70.4 +37 ICICI Lombard General 1.2 +11.4 -9

 Performance related information provided herein is not verified by SEBI. Past performance is not a reliable indicator of future results.

STRICTLY PRIVATE AND CONFIDENTIAL - DO NOT REPRODUCE OR DISTRIBUTE 22
Portfolio Composition
As at 31 August 2021
 GICS Sector Weights1
 35.0%
 32.5%

 19.6%
 14.4% 10
 10.5% 43
 10.0% 0 9.5%
 8.1% 8.1% 8.6%
 7.0% 0 7.1%
 5 5.0% 5.9% 5.3%
 10 3.6% 2.7%
 8 3 28 0.5% 0.7% 0.5%
 26 5 24 0.0% 8 0.0% 6 23 3 15
 14 1 7 1 3
 Consumer Disc Information Tech Financials Industrials Materials Energy Utilities Health Care Consumer Staples Comm Services Real Estate

 Portfolio S&P BSE 200

 Market Cap Weights1,2
 87.4%

 62.6%

 99 30.1%
 22
 12.6%
 17 1.9%
 102 0.0%
 3 0
 Large Cap Mid Cap Small Cap

 Portfolio S&P BSE 200

 1Thenumber inside the bars denote the number of companies in each classification. ETF’s and Index futures are included in large cap. 2 Market Cap Classification as per Securities and
 Exchange Board of India (SEBI) guidelines for Mutual Funds.

STRICTLY PRIVATE AND CONFIDENTIAL - DO NOT REPRODUCE OR DISTRIBUTE 23
Case Studies*

 *The following case studies are illustrative examples only. The illustrated companies included here may or may not necessarily be held in any portfolio at any time in the past or currently.

STRICTLY PRIVATE AND CONFIDENTIAL - DO NOT REPRODUCE OR DISTRIBUTE
Case Studies* - Infoedge

 India’s leading classifieds company

 • Infoedge’s Naukri.com is India’s dominant
 online jobs portal with 70%+ traffic share. It also
 owns 99acres.com which is the No. 1 online
 real-estate classifieds portal with 50% traffic
 share

 • India’s low internet penetration provides a long
 runway of growth for these dominant classified
 businesses

 • Management has an excellent track record of
 execution. It has also made investments in
 India’s leading food delivery company (Zomato),
 and India’s top online policy aggregator
 (Policybazar)

 *The following case studies are illustrative examples only. The illustrated companies included here may or may not necessarily be held in any portfolio at any time in the past or currently.

STRICTLY PRIVATE AND CONFIDENTIAL - DO NOT REPRODUCE OR DISTRIBUTE 25
Structure and Key Terms
 Investment Approach White Oak India Top 200 PMS

 Structure Discretionary Portfolio Management Services

 Portfolio Manager White Oak Capital Management Consultants LLP

 The objective of the strategy is to achieve long term capital appreciation by primarily investing in top 200 ‘listed securities’
 by market capitalisation in India. The investment strategy is long only with a bottom-up stock selection approach. The
 Investment Objective investment philosophy is, that outsized returns are earned over time by investing in great businesses at attractive values. A
 great business, in our view, is one that is well managed, scalable, and generates superior returns on incremental capital.
 Valuation is attractive when the current market price is at a substantial discount to intrinsic value.

 Minimum Investment INR 50 lakhs

 INR 50 lakhs – INR 2 crores INR 2 crores – INR 5 crores > INR 5 crores
 Investment Amount &
 Management Fees
 2.00% per annum 1.75% per annum 1,.60% per annum

 Exit Load Nil

 Operating Expenses At actuals, capped at maximum prescribed by regulations

 Benchmark S&P BSE 200 TR Index

 Custodian ICICI Bank, Kotak Mahindra Bank Limited and HDFC Bank Limited

STRICTLY PRIVATE AND CONFIDENTIAL - DO NOT REPRODUCE OR DISTRIBUTE 26
Investment Case for
 Indian Equities

STRICTLY PRIVATE AND CONFIDENTIAL - DO NOT REPRODUCE OR DISTRIBUTE
Alpha Opportunity – Most Compelling Reason to Invest

 Source: The Wall Street Journal.

STRICTLY PRIVATE AND CONFIDENTIAL - DO NOT REPRODUCE OR DISTRIBUTE 28
The Long-term Case for Indian Equities

 •Once in an era transformation
 Economic evolution
 •Multi-generational opportunity

 •Key driver for global growth over coming years
 Strong domestically driven growth
 •Attractive demographics, domestic consumption and investment

 Profitable and diverse corporate •Superior corporate profitability, superior asset mix

 universe •Entrepreneurially driven capital allocation

 Institutional infrastructure of a •Independent Central Bank, Election Commission and Judiciary

 mature democracy •Strong property rights under a Common Law system

STRICTLY PRIVATE AND CONFIDENTIAL - DO NOT REPRODUCE OR DISTRIBUTE 29
Corporate Earnings
 Historical growth and returns: Compounded Annual Growth Rates

 FY93-FY21:
 11.6% CAGR

 FY93-FY21:
 12.3% FY93-FY21:
 FY 09-21: 6.2% CAGR
 CAGR 11.5%
 CAGR

 FY 03-08: 25% CAGR

 FY 96-03: 1% CAGR
 FY 93-96: 45% CAGR
 FY96

 FY09
 FY93

 FY94

 FY95

 FY97

 FY98

 FY99

 FY00

 FY01

 FY02

 FY03

 FY04

 FY05

 FY06

 FY07

 FY08

 FY10

 FY11

 FY12

 FY13

 FY14

 FY15

 FY16

 FY17

 FY18

 FY19

 FY20

 FY21
 Corporate Profits as a Percentage of GDP Average Return on Equity from 2000-2020
8.0% 7.2%

 India 17.3%
6.0%

 3.7%
4.0% Average=3.5% Asia Pacific ex-Japan 12.4%
 2.6%

2.0% 1.3% 1.6%
 Emerging Markets 13.0%

0.0%
 FY93
 FY94
 FY95
 FY96
 FY97
 FY98
 FY99
 FY00
 FY01
 FY02
 FY03
 FY04
 FY05
 FY06
 FY07
 FY08
 FY09
 FY10
 FY11
 FY12
 FY13
 FY14
 FY15
 FY16
 FY17
 FY18
 FY19
 FY20
 FY21

 World 11.1%
 Corporate profit to GDP (%)

Source: Motilal Oswal Institutional Research, Spark, Bloomberg, White Oak Research.

STRICTLY PRIVATE AND CONFIDENTIAL - DO NOT REPRODUCE OR DISTRIBUTE 30
Valuation History
 Sensex Forward P/E 1,2 MSCI India P/E premium over MSCI EM %2,3
30 80%

 70%
25 Average since
 23.2 60%
 2014: 20.7x
20 50%
 Average=17.2
 40%
15 30%

 20%
10 Average +/-1 std dev
 10%
 5 0%
 Aug-97
 Aug-93

 Aug-01

 Aug-05

 Aug-09

 Aug-13

 Aug-17

 Aug-21

 2015
 2005

 2006

 2007

 2008

 2009

 2010

 2011

 2012

 2013

 2014

 2016

 2017

 2018

 2019

 2020

 2021
 Sensex Forward P/B 1,2 MSCI India P/B premium over MSCI EM %2,3
 4.0 140%

 3.4 120%

 3.0 Average=2.6x 100%

 80%

 2.0
 60%

 40%
 1.0 Average +/-1 std dev
 Aug-93

 Aug-97

 Aug-01

 Aug-05

 Aug-09

 Aug-13

 Aug-17

 Aug-21

 20%
 2007
 2005

 2006

 2008

 2009

 2010

 2011

 2012

 2013

 2014

 2015

 2016

 2017

 2018

 2019

 2020

 2021
Source: Bloomberg, Motilal Oswal Institutional Research, UBS. 1Data as of August 2021. 2 Sensex is the benchmark index of India's Bombay Stock Exchange (BSE). The Sensex is comprised of 30 of the largest and most
actively-traded stocks on the BSE, providing a gauge of India's economy. 3The MSCI India Index is designed to measure the performance of the large and mid cap segments of the Indian market.

STRICTLY PRIVATE AND CONFIDENTIAL - DO NOT REPRODUCE OR DISTRIBUTE 31
Entrepreneurial Capital Allocation
Low government ownership in India

 State-Owned Enterprise weights in Emerging markets MSCI India Sector Mix

 70% Information
 Technology, 18.2% Materials, 9.9%

 60%
 Communication
 Services, 3.1%
 50%
 Industrials, 4.3%
 Utilities, 3.9%
 40%
 Health Care, 5.4% Real Estate, 0.3%
 30% Consumer
 Discretionary, 7.5%
 Average: 18%
 20%

 10% 6%
 Consumer Staples, 9.5%
 Financials
 0% 26.1%
 Taiwan
 Colombia

 India
 Poland

 Czech Republic

 Malaysia

 Indonesia

 China

 Brazil

 Chile

 Turkey

 Korea
 Russia

 Thailand

 EM

 Energy, 11.6%

Source: Bloomberg, UBS, White Oak Research as of end August 2021.

STRICTLY PRIVATE AND CONFIDENTIAL - DO NOT REPRODUCE OR DISTRIBUTE 32
Minority Protection

 Minority Investor Protection Rank – India vs EMs Minority Investor Protection Rank – India vs DMs

 120 120
 105

 100 100

 80 72 80

 61 61 61
 57 57
 60 60
 45
 37 36
 40 40
 28
 25

 20 13 13 20 13
 7 7
 2 3
 0 0
 Indonesia
 India
 Malaysia

 Korea

 China
 Thailand

 Brazil

 Mexico

 Russia
 South Africa

 India

 France
 Canada

 United Kingdom

 Australia

 Germany

 Switzerland
 Japan
 United States
 Source: World Bank Doing Business Report 2020.

STRICTLY PRIVATE AND CONFIDENTIAL - DO NOT REPRODUCE OR DISTRIBUTE 33
A tale of two decades – India vs US
 Total Return (US$)

 2000 - 2010 2010 – 2020 2000 – 2020

 15% 12% 15% 15%
 11%
 10% 10% 10%
 6%
 5%
 5% 5% 5%

 0% 0% 0%
 -1% 0%
 -5% -5% -5%
 MSCI India S&P 500 MSCI India S&P 500 MSCI India S&P 500

 Earnings Growth (US$)

 2000 - 2010 2010 – 2020 2000 – 2020

 15% 14% 15% 15%

 10% 10% 8% 10%
 6%
 5%
 5% 2% 5% 5%

 0% 0% 0%
 -1%
 -5% -5% -5%
 MSCI India S&P 500 MSCI India S&P 500 MSCI India S&P 500
Source: Bloomberg. *Data shown above is for fiscal year ending March 2020.

STRICTLY PRIVATE AND CONFIDENTIAL - DO NOT REPRODUCE OR DISTRIBUTE 34
Mid-Cap Multiples Premium/Discount
 Midcap Prem/Disc across Markets % (on 12 m Fwd PE)
100%

80%

60%

40%

20%

 0%
 USA Japan UK Canada France Germany China India Brazil South Korea Taiwan
-20%
 Aug-17 Aug-18 Aug-19 Aug-20 Aug-21
-40%

 India’s historical Mid Cap vs Large Cap stocks premium % (on 12 m Fwd PE)

 40%

 30%

 20%
 1.3%
 10%

 0%

 -10% Average: -4.8%

 -20%

 -30%

 -40%
 2009 2010 2011 2012 2013 2014 2015 2016 2017 2018 2019 2020 2021

 Source: Bloomberg. Data as of August 2021, data for SMID vs Large cap 12m forward PE ratio for respective country’s MSCI index.

 STRICTLY PRIVATE AND CONFIDENTIAL - DO NOT REPRODUCE OR DISTRIBUTE 35
Macroeconomic Indicators are supportive
 Inflation and Interest Rates Fiscal Deficit

 20 CPI Inflation (%) Repo Rate (%)- RHS 10.0 Fiscal deficit as % GDP
 9.4
 9.0 10
 15 8 6.8
 8.0

 7.0 6 4.6
 10 4
 6.0
 2
 5.0
 5
 0
 4.0

 FY92

 FY94

 FY96

 FY98

 FY00

 FY02

 FY04

 FY06

 FY08

 FY10

 FY12

 FY14

 FY16

 FY18

 FY20

 FY22*
 0 3.0
 2002 2005 2008 2011 2014 2017 2020

 Forex reserves Sovereign External Debt to GDP (%)
 Sovereign External Debt to GDP (%)
 35% 32%
 28%
 700 India Foreign Exchange Reserve US$ bn 30%
 617
 600 25%
 500 20% 18%
 16%
 400 13%
 15%
 10%
 300 10% 6% 6%
 200 4% 4%
 5% 1% 2%
 100
 0%
 0

 Thailand
 China

 Indonesia
 Turkey
 HK

 Brazil

 Mexico

 Japan

 US
 India

 Russia

 Korea
 2000
 2001
 2002
 2003
 2004
 2005
 2006
 2007
 2008
 2009
 2010
 2011
 2012
 2013
 2014
 2015
 2016
 2017
 2018
 2019
 2020
 2021

Source: Bloomberg, Reserve Bank of India. * FY222 budgeted estimate as per FY22 Union Budget announcement, Updated through August 2021.

STRICTLY PRIVATE AND CONFIDENTIAL - DO NOT REPRODUCE OR DISTRIBUTE 36
Equity Market Inflows
 Foreign Institutional Investors (FII) Flows (USD billion) SIP inflows into mutual funds (US$bn)

 Net FII flows 1.4
 1.3 SIP: systematic investment plan 1.3

 29 1.2
 25 23 1.1
 20
 17 18 17 1.0
 14
 11 0.9
 8 9 8
 7 7
 0.8
 2 3 3 3
 1
 0.7
 0.6
 -1
 -5 0.5
 0.4
 -13

 Jan-17

 Jan-18

 Jan-19

 Jan-20

 Jan-21
 Jul-20
 Jul-17

 Jul-18

 Jul-19

 Jul-21
 2008

 2020
 YTD21
 2000
 2001
 2002
 2003
 2004
 2005
 2006
 2007

 2009
 2010
 2011
 2012
 2013
 2014
 2015
 2016
 2017
 2018
 2019
 FDI in India (US$bn) Domestic Savings in Equities (%)

 60 56 54 4.6 4.5 4.4
 50 45 3.9 4.0
 42 43 3.7
 39 3.5
 40 35 2.9
 33 2.7
 29 31 2.6
 27 2.4
 30 2.2 2.2

 20

 10

 0
 FY07

 FY08

 FY09

 FY10

 FY11

 FY12

 FY13

 FY14

 FY15

 FY16

 FY17

 FY18

 FY19
 FY17
 FY11

 FY12

 FY13

 FY14

 FY15

 FY16

 FY18

 FY19

 FY20

 FY21

Source: Bloomberg, NSDL, SEBI, AMFI. FII inflows data for calendar year. .

STRICTLY PRIVATE AND CONFIDENTIAL - DO NOT REPRODUCE OR DISTRIBUTE 37
Robust Long-term Market Returns

 India United States

 2000 2020 Delta 2000 2020 Delta

 Economy

 Nominal GDP ($ billion) 477 2,709 5.7x 10,285 20,933 2.0x

 Per Capita GDP ($) 465 1,965 4.2x 35,252 63,416 1.8x

 Corporate Earnings per share ($)1 0.2 0.6 2.8x 54 123 2.3x

 Equity Market Index ($)1 6 22 3.9x 1,469 3,756 2.6x

 Market Cap ($ billion)2 184 2,520 13.7x 15,226 42,641 2.8x

 Major macroeconomic and geopolitical setbacks

 • 2000: coming out of Kargil war (1999) with Pakistan

 • Terrorist attack on Parliament 2001, Mumbai train attacks in 2006, attacks on Mumbai Hotels in 2008

 • 2008: Global Financial Crisis

 • Oil Price volatility from $25 per bbl to over $145

 • 2010 - 2014: Telecom spectrum (2G) scam; Commonwealth Games scam; Coal scam; Bribe-for-loan and other scams

 • 2020: Covid pandemic

Source: Bloomberg, Reserve Bank of India. 1MSCI India (MXIN Index), S&P 500 (SPX index). 2WCAUINDI Index, WCAUUS Index.

STRICTLY PRIVATE AND CONFIDENTIAL - DO NOT REPRODUCE OR DISTRIBUTE 38
Guaranteed Real Loss vs Compounding Gains
Fixed deposit vs Equities
 Equity returns since 1985

 ₹140 ₹ 2,766
 ₹135
 ₹2,800
 ₹2,600
 ₹2,400
 ₹2,200
 ₹2,000
 ₹1,800
 ₹1,600 25.0%

 ₹1,400
 ₹1,200
 ₹1,000
 ₹800
 ₹600
 ₹ 24
 ₹400
 ₹ 135
 ₹ 13 15.0%
 ₹200

 ₹8 ₹-
 ₹-

 2000
 1985

 1990

 1995

 2005

 2010

 2015

 2020
 1985

 1990

 1995

 2000

 2005

 2010

 2015

 2020

 Inflation FD (net of tax) Gold
 Inflation FD (net of tax)
 Gold Sensex Sensex Top performers
 Top performers

Source: Bloomberg

STRICTLY PRIVATE AND CONFIDENTIAL - DO NOT REPRODUCE OR DISTRIBUTE 39
Risk to the Investment Case1

 Near term risks

 ▪ Uncertainty related to Covid pandemic

 ▪ Sharp reversal in global markets

 ▪ Sharp spike in oil prices

 Other commonly held concerns

 ▪ Weak infrastructure

 ▪ Geo-political tensions

 ▪ Social unrest due to wealth disparity or caste system

 ▪ Trade wars

 1Note that these are not all the risks to the investment case but only a high level summary of certain key risks.

STRICTLY PRIVATE AND CONFIDENTIAL - DO NOT REPRODUCE OR DISTRIBUTE 40
1QFY22 Corporate Earnings: A strong season
 1QFY22 earnings growth at 100% YoY Earnings surprises continue albeit at lower pace
 60%
 Nifty quarterly earnings growth, % YoY ~100% 1 Beats to misses ratio - Nifty
 50% 3.0
 40% Ratio of number of companies beating earnings estimates to number of
 2.5
 30% 23% companies missing earnings estimates

 20% 2.0
 10%
 1.5
 0%
 -10% 1.0
 -20% 0.5
 -25%
 -30%
 -35% 0.0
 -40%

 1Q16

 1Q22
 3Q13
 1Q14
 3Q14
 1Q15
 3Q15

 3Q16
 1Q17
 3Q17
 1Q18
 3Q18
 1Q19
 3Q19
 1Q20
 3Q20
 1Q21
 3Q21
 Q3F11
 Q1F12
 Q3F12
 Q1F13
 Q3F13
 Q1F14
 Q3F14
 Q1F15
 Q3F15
 Q1F16
 Q3F16
 Q1F17
 Q3F17
 Q1F18
 Q3F18
 Q1F19
 Q3F19
 Q1F20
 Q3F20
 Q1F21
 Q3F21
 Q1F22
 FY22 earnings growth forecasted to be the best since FY04 India’s earnings growth relatively more stable
 Nifty annual earnings growth, % YoY 30%
 50% CY20/FY21 - Earnings Growth
 42%
 40% 34% 10%

 30% -10%
 20% 14% 15%
 -30%
 10%
 0% -50%

 -10% -70%

 China

 Turkey

 Indonesia
 South Africa

 Malaysia

 Poland
 Mexico
 Brazil

 Russia
 Taiwan

 South Korea

 India

 Thailand
 -20%
 FY98
 FY99
 FY00
 FY01
 FY02
 FY03
 FY04
 FY05
 FY06
 FY07
 FY08
 FY09
 FY10
 FY11
 FY12
 FY13
 FY14
 FY15
 FY16
 FY17
 FY18
 FY19
 FY20
 FY21
 FY22E
 FY23E

Source: Motilal Oswal, UBS, Credit Suisse, White Oak

STRICTLY PRIVATE AND CONFIDENTIAL - DO NOT REPRODUCE OR DISTRIBUTE 41
Corporate Earnings: Structural trends emerging
 Consolidation of market share is taking place across sectors EBITDA margin expansion on the back of cost control
 20%
 FY21 growth EBITA margin, BSE -100 (ex financials)
 18%
 5% Banks (Credit)
 12% 16%

 1% 14%
 5% Cement (Volume)
 12%
 10% Consumer Electricals (Revenue)
 19% 10%

 -6% 8%
 1% Jewellery (Value)
 6%

 FY10

 FY11

 FY12

 FY13

 FY14

 FY15

 FY16

 FY17

 FY18

 FY19

 FY20

 FY21
 4% Paints (Revenue)
 8%

 -14% Corporate deleveraging cycle underway
 3% PVC Pipes (Volume)
 (YoY %) Gross Debt Growth, BSE 500 (ex financials)
 -6% 25
 23% Real Estate (Sales Value)
 20
 -18% Tiles (Revenue) 15
 -3%
 10
 % YoY
-30% -20% -10% 0% 10% 20% 30% 5
 Industry* 0
 Market leader/s**
 (5)
 *For Consumer Electricals and Paints the industry data is for all the listed players (10)
 ** For Banks, top four private sector banks, For Real Estate, data for following listed (15)
 developers: Oberoi, Sunteck, Godrej Properties, Brigade, Sobha, Prestige and DLF

 Mar-21
 Mar-13

 Mar-14

 Mar-15

 Mar-16

 Mar-17

 Mar-18

 Mar-19

 Mar-20

 Sep-20
 Sep-13

 Sep-14

 Sep-15

 Sep-16

 Sep-17

 Sep-18

 Sep-19
 Source: Antique, Credit Suisse, ICICI Securities, IIFL, Jefferies, Kotak, White Oak

 STRICTLY PRIVATE AND CONFIDENTIAL - DO NOT REPRODUCE OR DISTRIBUTE 42
Structural Reforms to further ‘Ease of Doing Business’

 Labour reforms & competitive federalism

 • Landmark labour reforms – significant simplification of complex, archaic, pre-independence era laws

 • Increased instances of competitive federalism – subsidies, tax concessions, easier land availability and approvals

 Agriculture and mining reforms

 • Amendments to Essential Commodities Act – deregulation of production, supply, distribution and prices

 • Liberalization of coal mining – ending government’s monopoly

 Privatisation: non-strategic SOEs to be privatised

 • Defence: Encouraging domestic production; Foreign Direct Investment (FDI) increased to 74% from 49% in key
 sectors

 • Privatisation of Power Distribution and Airports

STRICTLY PRIVATE AND CONFIDENTIAL - DO NOT REPRODUCE OR DISTRIBUTE 43
Strong momentum in reforms agenda…

 Phase III- Growth enhancing
 • Corporate tax rate cuts -
 India’s tax rate the lowest
 among EMs
 Phase II- Growth enabling • Production Linked
 • Labour reforms - easing of Incentives (PLI) - facilitating
 compliance burden ‘Make in India’
 Phase I- ‘Restructuring’
 • Outright privatisation- Oil • National Infrastructure
 marketing companies, SOE Pipeline - addressing infra
 • GST- creating a common banks, Logistics bottlenecks, improving
 market • Mining & Agri reforms- competitiveness of the
 • Modern bankruptcy law - Liberalisation of coal mining; economy
 Time bound resolution of bad sweeping changes in agri sector
 loans
 • Real Estate regulation
 reform- Increasing
 transparency in real estate

Source: White Oak Research

STRICTLY PRIVATE AND CONFIDENTIAL - DO NOT REPRODUCE OR DISTRIBUTE 44
…Reflected in improved ‘Ease of Doing Business’ rankings

 Ranks across various components of Ease of Doing Business (across 189 countries)

 142
 Ease of doing business 63

 Starting a business 158
 136

 Dealing with construction 184
 permits 27

 Getting electricity 137
 22

 Getting credit 36
 25

 Protecting minority investors 7
 13

 Resolving insolvency 137
 52

 0 20 40 60 80 100 120 140 160 180 200

 2015 2020

Source: World Bank (Doing Business report 2020), White Oak Research as of end February 2021.

STRICTLY PRIVATE AND CONFIDENTIAL - DO NOT REPRODUCE OR DISTRIBUTE 45
Landmark Tax Reforms
 Base tax rate comparison across SE Asia
 35
 30 30
 30
 25 25 25 25 24
 25 23.2
 22
 20 20 20
 20 17
 15
 15

 10 In September 2019,
 5 effective corporate tax
 0 rates reduced from 35% to
 Malaysia
 China

 Vietnam
 Bangladesh

 Indonesia

 Korea

 India (new)
 Japan

 Singapore
 Thailand
 India (old)

 India (new
 Taiwan
 Philippines

 25% for all companies and

 mfg)
 to 17% for new
 manufacturing companies
 ▪ Biggest tax reform after Goods and Services Tax (GST) since the mid-90s, eliminating risk
 of rising tax expectations

 ▪ Reduced cost of doing business in India to attract new investments in the country

 ▪ Adds momentum to the formalization of the economy by increasing tax compliance

 Making corporate India competitive
Source: UBS, White Oak Research

STRICTLY PRIVATE AND CONFIDENTIAL - DO NOT REPRODUCE OR DISTRIBUTE 46
PLI : A potential gamechanger for manufacturing

 Sector Size (US$bn) What is different?
 Auto & Comps 7.8

 Electronics 6.7 Time bound
 manufacturing
 EV battery/cell- 2.4
 manufacturing
 Pharma 2.1
 Focus on creating ‘national
 champions’
 Food products 1.5
 White goods 0.9
 Incremental production (not only
 Others 5.6 exports)
 Total 27.0

Source: PIB, Credit Suisse, White Oak Research as of end February 2021.

STRICTLY PRIVATE AND CONFIDENTIAL - DO NOT REPRODUCE OR DISTRIBUTE 47
Electronics sector: Production target of $143bn in 5 years
Make in India

 India’s share in smartphone manufacturing has Can have significant impact on GDP as well
 doubled in last 2 years
 70% 30 0.7%
 Smartphone production (India % Global)
 GDP Impact ($ Bn) As % of GDP (RHS)
 60% Govt target of 1bn 25 0.6%
 handsets by 2025
 50% Mobile Phones 0.5%
 20
 40% 0.4%
 15
 30%
 0.3%

 20% 10
 0.2%
 10%
 5 0.1%
 0%
 FY21e

 FY22e

 FY23e

 FY24e

 FY25e
 FY17

 FY18

 FY19

 FY20

 0 0.0%
 FY22e FY23e FY24e FY25e FY26e

 • Apple, Samsung, Xiaomi: scaling up India operations substantially

 • During the first five months of scheme’s implementation, the applicant companies have produced goods worth ~INR 350bn while
 generating additional employment of 22,000 jobs
Source: Credit Suisse, White Oak Research as of end February 2021.

STRICTLY PRIVATE AND CONFIDENTIAL - DO NOT REPRODUCE OR DISTRIBUTE 48
Shifting Supply Chains: Specialty Chemicals
Make in India
 Expected 5Y CAGR of specialty chemicals
 13%
 Indian speciality chemicals industry positioned strongly to win
 global market share
 7%
 • MNCs seek to diversify procurement away from China 5%

 • Covid has exposed global supply chain vulnerability 3%
 2%
 1%
 • China’s erstwhile competitive advantages of labour cost,
 and lax compliance are weakening China North America Western Europe Japan India Global

 Market share: 2006 Market share: 2019
 US,
 US 14%
 Advantage India Others 22% Others
 28% 27%
 • Strong adherence to global manufacturing standards
 Europe
 • Capabilities in complex chemistry 15%

 • Strong IP protection India India
 2% 4% Japan
 4%
 China Europe
 13% 28%
 Japan China
 7% 36%

Source: UBS, Ministry of Commerce, CMIE, White Oak Research as of end February 2021.

STRICTLY PRIVATE AND CONFIDENTIAL - DO NOT REPRODUCE OR DISTRIBUTE 49
Indian Pharma: Critical to global healthcare
Make in India

 • India has over 65% of world’s vaccine manufacturing capacity
 • Accounts for 40% of US generic volume (largest pharma market)
 • India has 2nd highest number of US FDA approved plants
 • Emerging destination for Contract Development and Manufacturing
 • Medical Tourism offers huge growth potential for India given world class infrastructure and significant cost advantage

 India’s market share in US generics India has the largest FDA approved plants after the US
 Market share %, calendar year-ends, 2011-19
40 Volume Value
 FDF API
36 450
 400 384
32
 345
28 350

24 300

20 250
 188
16 200

12 150

 8 100 82
 52 46
 4 50
 0 0
 2011 2012 2013 2014 2015 2016 2017 2018 2019 US India China Italy Germany Spain

Source: IQVIA, White Oak Research as of December 2020.

STRICTLY PRIVATE AND CONFIDENTIAL - DO NOT REPRODUCE OR DISTRIBUTE 50
IT Services: Emerging Dominance
 IT Industry Size ($ bn)
 • Indian IT services is ~$147 bn industry
 147
 150 136
 • Grown 3.6x in the past decade (11.5% CAGR) 125
 125 116
 107
 • Highly scalable business model 98
 100 87
 77
 • Five Indian vendors with c$10bn revenue 75 59
 69

 50 40

 • Sustained market share gains against global competition 25

 0
 • Market share up from 6.6% in 2010 to 12.1% 2010 2011 2012 2013 2014 2015 2016 2017 2018 2019 2020

 • Winning against global competitors such as IBM, DXC, IT Services IT Enabled Services Engineering R&D Services

 Capgemini
 Indian IT Market Share %
 14.0
 12.1
 11.6 11.9
 • Global tech leaders setting up ER&D centres in India 12.0 10.9 11.3
 10.2
 9.3
 • Large attractive talent pool of STEM graduates 10.0 8.7
 7.5 7.7
 8.0
 • 47% of global captives set up in India 5.7
 6.7
 5.1 5.4
 6.0
 • Microsoft, Google, Amazon have large setups in India 4.0 2.8

 • 70-80% of H1B visas issued to Indians 2.0

 -

 CY20e
 CY09
 CY06

 CY07

 CY08

 CY10

 CY11

 CY12

 CY13

 CY14

 CY15

 CY16

 CY17

 CY18

 CY19
Source: Nasscom, Kotak, White Oak Research as of December 2020.

STRICTLY PRIVATE AND CONFIDENTIAL - DO NOT REPRODUCE OR DISTRIBUTE 51
Lessons from 2020
Macro- Shacro
 20-20 from 2020: The futility of predicting investment returns based on macroeconomic worries and events

 Lesson #1

 • The usual perennial macroeconomic worries of the well-known unknowns variety are a colossal waste of time
 • They hardly influence the future returns from equity markets, if any at all

 Lesson #2

 • Nobody has a crystal ball to forecast cataclysmic risk events of the unknown unknown variety, ex: the pandemic
 • Market implications remain unpredictable even if one were bestowed with perfect prior knowledge

 Lesson #3

 • Investment decisions bereft of bottom up analysis, and instead driven by macro considerations, are fraught with
 high risk of substantial absolute and relative losses

STRICTLY PRIVATE AND CONFIDENTIAL - DO NOT REPRODUCE OR DISTRIBUTE 52
White Oak’s Perspective

 The value of the market at any time is present value of aggregate perpetual future cash flows
 The market is fairy valued at all times

 Relevance of Macro

 • View macros as source of random risks, not as opportunity to add alpha
 • Consciously avoid top-down misadventures – market timing, sector rotation
 • Stay fully invested, with a bottom up approach to investing in great businesses at attractive valuations
 • Maintain a balanced portfolio construction approach at all times

STRICTLY PRIVATE AND CONFIDENTIAL - DO NOT REPRODUCE OR DISTRIBUTE 53
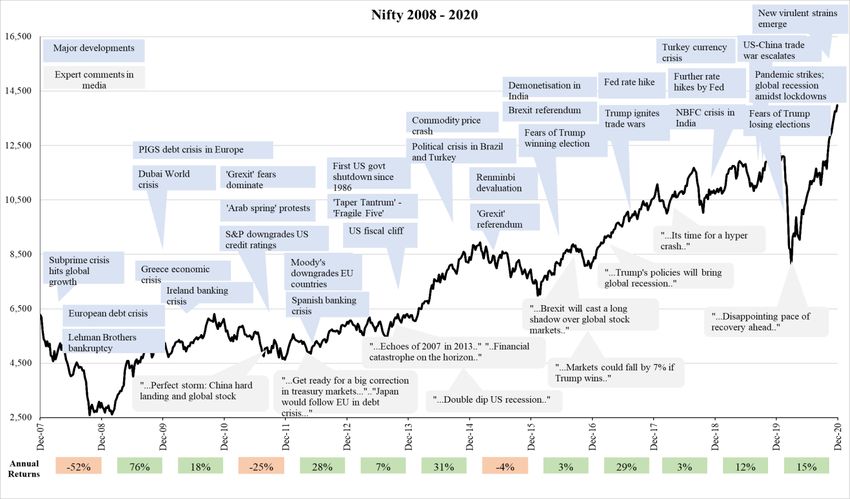
Nifty through CY 20

STRICTLY PRIVATE AND CONFIDENTIAL - DO NOT REPRODUCE OR DISTRIBUTE 54
Nifty 2008 - 2020

STRICTLY PRIVATE AND CONFIDENTIAL - DO NOT REPRODUCE OR DISTRIBUTE 55
Lower interest rates have led to a structural re-rating
 60 18

 16

 50

 14

 40 12

 Long-Term Interest Rates, %
 Price-Earnings Ratio (P/E10)

 10

 30

 8

 20 6

 4

 10

 2

 0 0
 1900 1920 1940 1960 1980 2000 2020

 Price/ E10 Ratio* Long term interest rates (%, RHS)

 *Price/ (average earnings over 10 years) or Cyclically adjusted PE (CAPE), adapted from Robert Shiller (Yale University, http://www.econ.yale.edu/~shiller/data.htm)

STRICTLY PRIVATE AND CONFIDENTIAL - DO NOT REPRODUCE OR DISTRIBUTE 56
Covid and Vaccination – Impact on markets

STRICTLY PRIVATE AND CONFIDENTIAL - DO NOT REPRODUCE OR DISTRIBUTE
Covid-19: Situation Update
 India - Covid cases India-Covid deaths
4,20,000 4,500
 4,000
3,50,000
 3,500
2,80,000 3,000
 7 day
 2,500
2,10,000 average:
 7 day 2,000 490
 average:
1,40,000 1,500
 41,000
 1,000
 70,000 500
 0 0

 Mar-20

 Mar-21
 May-20

 Jan-21

 May-21
 Feb-20

 Sep-20

 Dec-20

 Feb-21
 Apr-20

 Jul-20

 Nov-20

 Apr-21

 Jul-21
 Jun-20

 Aug-20

 Oct-20

 Jun-21

 Aug-21
 Mar-20

 May-20

 Jan-21

 Mar-21

 May-21
 Feb-20

 Sep-20

 Feb-21
 Apr-20

 Jul-20

 Nov-20
 Dec-20

 Apr-21

 Jul-21
 Jun-20

 Aug-20

 Oct-20

 Jun-21

 Aug-21
 Daily 7 day average Daily 7 day average

 Total Deaths (per Severity of India
 Population Median Total Daily Deaths Scaled to India’s
 Country reported mn on the same
 (mn) Age deaths (peak 7 days avg) population
 cases (mn) population) scale
United States 331 38.5 39.0 637,539 1,916 3,432 14,309 0.29x
India 1,380 28.7 32.8 438,210 317 4,190 4,190 1.00x
Brazil 213 33.2 20.8 579,308 2,707 3,124 20,282 0.21x
Russia 146 40.3 6.8 178,457 1,223 555 5,248 0.80x
United Kingdom 68 40.6 6.7 132,760 1,947 1,253 25,471 0.16x
Turkey 84 32.0 6.4 56,213 661 356 5,825 0.72x
Spain 47 43.9 4.8 84,000 1,797 865 25,531 0.16x
Mexico 129 29.0 3.4 258,165 1,982 1,427 15,274 0.27x
Israel 9 30.0 1.1 6,989 796 65 9,966 0.42x
 Source: WHO, data as of 29th August

 STRICTLY PRIVATE AND CONFIDENTIAL - DO NOT REPRODUCE OR DISTRIBUTE 58
Covid-19: Vaccination contained death rates in other countries
 United Kingdom 7 DMA of daily new cases United Kingdom 7 DMA of daily deaths

 70,000 1,400 Peak:
 Peak:
 1,253
 60,000 58,829 1,200
 Peak:
 50,000 1,000 944
 40,000 800
 Peak: Peak:
 30,000 25,365 600 486
 20,000 400
 Peak:
 10,000 4,867 200
 0 0
 Mar-20

 Mar-21

 Mar-20

 Mar-21
 May-20

 Jan-21

 May-21

 May-20

 Jan-21

 May-21
 Sep-20

 Feb-21

 Sep-20

 Dec-20

 Feb-21
 Apr-20

 Jul-20

 Nov-20
 Dec-20

 Apr-21

 Jul-21

 Apr-20

 Jul-20

 Nov-20

 Apr-21

 Jul-21
 Oct-20

 Oct-20
 Jun-20

 Aug-20

 Jun-21

 Aug-21

 Jun-20

 Aug-20

 Jun-21

 Aug-21
 Israel 7 DMA of daily new cases Israel 7 DMA of daily deaths

 10,000 70 Peak: 65
 Peak: 8,600
 9,000
 60
 8,000 Peak:
 7,000 6,276 50
 6,000 Peak: 39
 40
 5,000
 4,000 30
 3,000 20
 Peak:
 2,000
 623 10 Peak: 10
 1,000
 0 0
 May-20

 May-21

 May-20

 May-21
 Mar-20

 Jan-21

 Mar-21

 Mar-20

 Jan-21

 Mar-21
 Jul-20

 Sep-20

 Dec-20

 Feb-21

 Jul-21

 Jul-20

 Sep-20

 Dec-20

 Feb-21

 Jul-21
 Apr-20

 Oct-20
 Nov-20

 Apr-21

 Apr-20

 Oct-20
 Nov-20

 Apr-21
 Jun-20

 Aug-20

 Jun-21

 Aug-21

 Jun-20

 Aug-20

 Jun-21

 Aug-21
 Source: WHO

STRICTLY PRIVATE AND CONFIDENTIAL - DO NOT REPRODUCE OR DISTRIBUTE 59
1,000
 2,000
 3,000
 4,000
 5,000
 6,000
 7,000
 9,000
 8,000

 0
 19 Dec 20
 26 Dec 20
 02 Jan 21
 09 Jan 21
 16 Jan 21
 23 Jan 21
 30 Jan 21
 06 Feb 21

 10%
 20%
 30%
 40%
 50%
 60%

 0%
 13 Feb 21
 20 Feb 21 19 Dec 20
 Case study: Israel

 Daily Cases
 27 Feb 21 26 Dec 20

 Case load declined
 06 Mar 21
 13 Mar 21 02 Jan 21

 Source: WHO, Bloomberg, Investec, White Oak Research
 20 Mar 21 09 Jan 21
 27 Mar 21
 03 Apr 21 16 Jan 21
 25%

STRICTLY PRIVATE AND CONFIDENTIAL - DO NOT REPRODUCE OR DISTRIBUTE
 10 Apr 21 23 Jan 21
 17 Apr 21
 24 Apr 21 30 Jan 21
 01 May 21 06 Feb 21
 Percent of People Vaccinated (First Dose)

 13 Feb 21

 20 Feb 21

 27 Feb 21

 0
 10
 30
 40
 50
 70

 20
 60

 19 Dec 20 06 Mar 21
 26 Dec 20
 13 Mar 21
 02 Jan 21
 09 Jan 21 20 Mar 21
 Once 25% of population got vaccinated

 16 Jan 21 27 Mar 21
 23 Jan 21
 30 Jan 21 03 Apr 21
 06 Feb 21 10 Apr 21
 13 Feb 21
 17 Apr 21
 20 Feb 21
 Deaths

 27 Feb 21
 Percent of Population Completely Vaccinated

 24 Apr 21
 06 Mar 21
 01 May 21
 13 Mar 21
 As did the death rate

 20 Mar 21
 27 Mar 21
 03 Apr 21
 10 Apr 21
 17 Apr 21
 24 Apr 21
 01 May 21
 60
Covid-19: Vaccination progress in India
 60% 800
 By end of September, we expect more than 45%
 50% of population to receive at least 1 dose 700
 600
 40%
 500
 30% 400
 20% 300
 200
 10%
 100
 0% 0
 Jan-21 Feb-21 Mar-21 Apr-21 May-21 Jun-21 Jul-21 Aug-21 Sep-21

 % population with 1st dose % population with second dose Total doses administered (RHS, mn)

Progress so far: Roadmap ahead: Vaccine supply expected to increase through the
 year
• Vaccination rate in August at 5mn doses/day. In the last week of
 August, as many as 10mn doses have been administered per day. • Universalization of Vaccination: 75% of vaccines under universal
 vaccination program free of cost at government facilities
• 660mn doses have been administered (in absolute terms, the
 highest globally after China). • Private sale allowed to the extent of 25% of total supply, at pre-
 declared prices
• Nearly 90% of the vulnerable population (45+ years) has received
 at least one dose. • Earlier, emergency authorization was granted to vaccines
 approved globally
• 58% of the population in Tier-1 cities have received at least one
 dose.

 Source: WHO, ICMR, Kotak, White Oak Research

STRICTLY PRIVATE AND CONFIDENTIAL - DO NOT REPRODUCE OR DISTRIBUTE 61
Covid-19: Lockdowns less restrictive than in first wave

 First lockdown (Mar-Apr’20) Situation in 1QFY22 (June 2021
 quarter)
 Type of restrictions Countrywide, strict Localised, strict in many cases

 Manufacturing activity Other than essential sectors like Most units allowed to function
 pharma, metals, chemicals, rest but with restrictions
 stopped functioning
 Construction activity Stopped Allowed with restrictions

 Public transport Passenger trains, buses, civil Allowed with restrictions
 aviation completely stopped
 E-Commerce Not allowed for non-essentials Allowed for non-essentials in
 many areas
 Corporate preparedness Unprepared Better prepared (e.g. stocking up
 distributors)
 Systemic liquidity Tight entering into the lockdown Easy liquidity conditions
 Oxford Stringency Index 96-1001 822
 Source: WHO, Oxford University COVID-19 Government Response Tracker: Higher the index, higher is the ‘strictness’, 1 Between Mar-Apr, 2020; 2 As of July 20th , 2021

STRICTLY PRIVATE AND CONFIDENTIAL - DO NOT REPRODUCE OR DISTRIBUTE 62
Covid-19: Market volatility absent in second wave
 Fears of a bottomless pit BSE-500 vs Covid cases Millions
 25,000 Nature of pandemic totally
 unknown
 30
 23,000 Globally, India’s lockdown
 strictest
 21,000 25
 Corporates unprepared

 19,000 Uncertainty over job losses 20

 No vaccine in sight
 17,000
 15

 15,000
 Problem of a finite time horizon
 Nature of pandemic known 10
 13,000 -40%
 Corporates better prepared
 5
 11,000
 Vaccination progress underway

 9,000 0
 Jan-20

 Mar-20

 May-20

 Jan-21

 Mar-21

 May-21
 Feb-20

 Jul-20

 Sep-20

 Dec-20

 Feb-21

 Jul-21
 Apr-20

 Aug-20

 Oct-20

 Nov-20

 Apr-21

 Aug-21
 Jun-20

 Jun-21
 BSE 500 India Covid-19 total case count (RHS)

 Total cases 500 173,491 1,695,988 8,137,199 10,266,674 32,800,000

 Source: WHO, Bloomberg, White Oak Research

STRICTLY PRIVATE AND CONFIDENTIAL - DO NOT REPRODUCE OR DISTRIBUTE 63
Most High Frequency Indicators back to pre-Covid levels
 22%
 Exports
 -26%

 12%
 Bank credit
 6%

 -8%
 4-w sales
 -56%

 12%
Railway freight
 -14%

 21%
Custom duties
 -30%

 9%
 E-way bills
 -32%

 -8%
 Petrol
 -25%

 3%
 Electricity
 -11%

 -60% -50% -40% -30% -20% -10% 0% 10% 20%
 Apr-Aug'21 vs. Apr-Aug'19 Apr-Aug'20 vs. Apr-Aug'19

 Data as on August 2021. Source: CMIE, Jefferies

STRICTLY PRIVATE AND CONFIDENTIAL - DO NOT REPRODUCE OR DISTRIBUTE 64
High Frequency Indicators- Recovery continues in August
 Avg daily E- way bills generated (mn) Avg daily import duty collection (Rs bn)
 20
 2.3 2.3 16.1
 2.5 2.1 2.1 2.0 2.1 2.1 16 14.3 14.5 13.8 14.7 14.0 13.3
 1.9 2.0
 1.8 1.8 1.8 12.6 12.7
 2.0 1.6
 1.4 1.4 1.6 12 10.2 9.8 9.7 9.7
 1.3 9.3
 1.5 8.5 8.5
 7.5 7.3
 0.8 8 5.7
 1.0
 0.5 0.3
 4
 0.0
 0
 Mar-20

 Jan-21

 Mar-21
 Jul-20

 Jul-21
 May-20

 May-21
 Sep-20

 Dec-20

 Feb-21
 Apr-20

 Nov-20

 Apr-21
 Jun-20

 Aug-20

 Oct-20

 Jun-21

 Aug-21
 FY20 (Apr-Feb)

 Sep-20

 Feb-21
 Mar-20

 May-20

 Jan-21

 Mar-21

 May-21
 Jul-20

 Dec-20

 Jul-21
 Apr-20

 Aug-20

 Oct-20
 Nov-20

 Apr-21

 Aug-21
 Jun-20

 Jun-21
 FY20 (Apr-Feb)
 Daily average freight traffic (railways)-mn tonnes Electricity consumption ('000 MU)
 123 126
 130 119 117
 4.1 114 111 114 111 115
 4.5 3.9 4.0 120 109 107
 111 110
 4.0 3.7 3.8 3.7 3.7 3.8 3.6
 3.5 110 100 103 106 105
 3.3 3.3 3.4 3.5 98
 3.5 3.1 3.1 3.0 100
 2.7 85
 3.0 90
 2.5 2.2 80
 2.0 70
 1.5 60
 1.0 50
 40
 Mar-20

 Jan-21

 Mar-21
 May-20

 Dec-20

 May-21
 Jul-20

 Sep-20

 Feb-21

 Jul-21
 Apr-20

 Oct-20
 Nov-20

 Apr-21
 Jun-20

 Aug-20

 Jun-21

 Aug-21
 FY20 (Apr-Feb)

 Mar-21
 Mar-20

 May-20

 Jan-21

 May-21
 Sep-20

 Feb-21
 Jul-20
 Apr-20

 Nov-20
 Dec-20

 Apr-21

 Jul-21
 Jun-20

 Aug-20

 Oct-20

 Jun-21

 Aug-21
 FY20 (Apr-Feb)

Source: Kotak, CMIE, White Oak Research

STRICTLY PRIVATE AND CONFIDENTIAL - DO NOT REPRODUCE OR DISTRIBUTE 65
20 30 40 60 50 0.0 0.1 0.2 0.3 0.4 29-Jul 52 FY20 (Apr-Feb) 12-Aug Millions 52 26-Aug Mar-20 09-Sep 27 Apr-20 23-Sep 07-Oct 31 May-20 21-Oct 04-Nov Jun-20 47 18-Nov 46 Jul-20 02-Dec 52 16-Dec Aug-20 30-Dec Source: Kotak, CMIE, White Oak Research 57 13-Jan Sep-20 27-Jan 59 Oct-20 10-Feb Daily passenger traffic 56 24-Feb Nov-20 10-Mar 56 24-Mar Dec-20 07-Apr 58 Jan-21 21-Apr India manufacturing PMI 58 05-May Feb-21 19-May 55 STRICTLY PRIVATE AND CONFIDENTIAL - DO NOT REPRODUCE OR DISTRIBUTE Mar-21 02-Jun 16-Jun 56 Apr-21 30-Jun 51 14-Jul May-21 Departures (rhs) 28-Jul 48 Jun-21 11-Aug 55 25-Aug Jul-21 0 52 Aug-21 500 1,000 1,500 2,000 2,500 3,000 0.5 0.7 0.9 1.1 1.3 1.5 1.7 1.9 2.1 1,000 2,000 3,000 4,000 5,000 6,000 7,000 8,000 9,000 0 FY20 (Apr-Feb) FY20 (Apr-Feb) Mar-20 3,477 Mar-20 Apr-20 Apr-20 May-20 May-20 Jun-20 Jun-20 Jul-20 Jul-20 Aug-20 Aug-20 Sep-20 Sep-20 Oct-20 Oct-20 Nov-20 Nov-20 Dec-20 High Frequency Indicators- Recovery continues in August Dec-20 8,243 Jan-21 Jan-21 Feb-21 Feb-21 Total container traffic (mn TEUs) 1.9 Mar-21 Mar-21 Apr-21 Apr-21 Daily average property transactions, Maharashtra May-21 May-21 2,149 Jun-21 Jun-21 Jul-21 Jul-21 Aug-21 1.6 Aug-21 3,396 66
Appendix

STRICTLY PRIVATE AND CONFIDENTIAL - DO NOT REPRODUCE OR DISTRIBUTE
Portfolio Performance - India Acorn Fund Limited*
01 September 2017 - 31 August 2021, Net of Fees in INR

 Benchmark % Excess Returns S&P BSE 100 S&P BSE 150 S&P BSE 250
 ` Fund Large cap1 Mid cap1 Small cap1
 S&P BSE 5001 (bps)

 YTD 2021 33.2% 27.7% +554 24.5% 39.8% 44.0%

 2020 38.9% 18.4% +2049 16.6% 26.3% 27.9%

 2019 13.4% 9.0% +444 11.8% 0.9% -8.4%

 2018 1.3% -1.8% +310 3.0% -13.0% -23.7%

 Partial 2017 20.6% 9.2% +1140 7.0% 16.7% 17.7%

 S.I. (Annualised)2 26.5% 15.3% +1124 15.6% 16.0% 10.9%

 S.I. (Cumulative)2 156.5% 76.7% +7975 78.9% 80.9% 51.4%

 India Acorn Fund (Cayman) : 01 Sept 2017. 1All indices are Net Total Return. 2 The NAV for 31 August 2021 is based on estimates and hence the performance might be restated post the
 final valuation. The performance is net of all fees and expenses for Founder class shares at the Master Fund level. Fund performance in INR v/s S&P BSE 500 TR Index. The performance
 is after accounting for all taxes paid on realized gains but doesn’t account for potential taxes on unrealized gains. Please note the published NAV of India Acorn Fund (Cayman) is after
 adjusting for potential taxes on unrealised gain, and to that extent its performance may differ from the above. Performance is calculated using Net NAV of India Acorn Fund (Cayman).
 *White Oak Capital Management acts as an investment advisor to India Acorn Fund Limited. Past performance is not a reliable indicator of future results.

STRICTLY PRIVATE AND CONFIDENTIAL - DO NOT REPRODUCE OR DISTRIBUTE 68
Average Quarterly Performance in Different Market Environments
01 September 2017 – 31 August 2021, for Founder class shares
 Up Markets Overall Down Markets

 11.0%

 8.9%

 6.2%

 4.1%

 210 217 232
 bps bps bps

 -5.3%

 -7.6%

 Outperformed 9 out of 12 up quarters1 Outperformed 13 out of 17 quarters1 Outperformed 4 out of 5 down quarters1
 Average Alpha: +210 bps Average Alpha: +217 bps Average Alpha: +232 bps

 Portfolio Quarterly Average Returns S&P BSE 500 Quarterly Average Returns Average Alpha
 1Quarters considered for data are calendar year quarters- except Q3CY17 part: 01 Sep 2017 to 30 Sep 2017 and Q3CY21 part: 01 Jul 2021 to 31 Aug 2021. Past performance is not a reliable
 indicator of future results.

STRICTLY PRIVATE AND CONFIDENTIAL - DO NOT REPRODUCE OR DISTRIBUTE 69
Market Cap Attribution Analysis - India Acorn Fund Limited*
Stock selection drives performance : 01 September 2017 – 31 August 2021

 Attribution by Market Cap1
 Sector Fund Benchmark Attribution
 Average Total Average Total Selection Allocation Total
 Large Cap Weight Return Weight Return Effect Effect Attribution
 (%) (%) (%) (%) (%) (%) (%)

 Large Cap 42.0 145.2 79.7 85.8 18.1 -3.7 14.4
 Mid Cap

 Mid Cap 24.5 337.0 13.6 66.1 48.6 1.7 50.3

 Small Cap Small Cap 28.0 239.9 6.8 15.3 69.6 -27.7 41.9

 -30 -20 -10 - 10 20 30 40 50 60 70 Cash/Futures/Others 5.5 2.2 0.0 0.0 - - -4.9

 Total Attribution (%) Allocation Effect (%) Selection Effect (%) Total 100.0 178.4 100.0 76.8 136.3 -34.6 101.7

 1Factset Attribution Analysis. Performance is gross of fees, taxes and expenses. Market Cap Classification as per Securities and Exchange Board of India (SEBI) guidelines for Mutual
 Funds. * White Oak Capital Management acts as an investment advisor to India Acorn Fund Limited.

STRICTLY PRIVATE AND CONFIDENTIAL - DO NOT REPRODUCE OR DISTRIBUTE 70
You can also read