White Paper BIG DATA - Version 1.2 - November 2016 - portail-qualite.lu
←
→
Page content transcription
If your browser does not render page correctly, please read the page content below

Version 1.2 - November 2016

White Paper
     BIG DATA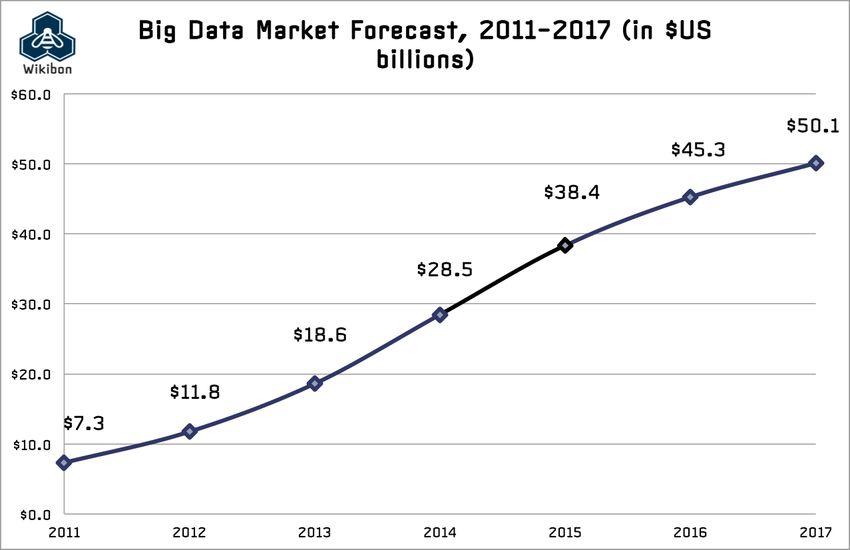
Executive Summary
This document aims at surveying current advances in Big Data and Big Data Analytics from two
complementary points of view: a technical analysis perspective and a business and economic
prospective analysis. Therefore, the document is intended for those professionals seeking guidance in
one or both domains and can be used in its whole as a compendium where technical and IT governance
aspects of Big Data are equally treated. Standards and technical standardization are also presented as
an essential tool to improve the interoperability between various applications and prevent vendor lock
in. They also provide interfaces between relational and non-relational data stores and support the large
diversity of current data types and structures. Finally, some conclusions on Big Data are presented with
an outlook on how to integrate them in the business environment to create value.


Foreword
The “Institut Luxembourgeois de la Normalisation, de l’Accréditation, de la Sécurité et qualité des
produits et services” (ILNAS) is an administration, under the supervision of the Minister of the Economy
in Luxembourg. ILNAS is the national standards body, and, in this frame, has developed, in partnership
with the University of Luxembourg, a certificate on “Smart ICT for Business Innovation” (lifelong
learning framework) at the end of 2014. The current White Paper has been carried out in the context of
this university certificate. It aims to support the development and to strengthen the standardization
culture at the national level, specifically in an economically meaningful field like Smart Information and
Communication Technology (Smart ICT). This initiative is de facto in line with the Luxembourg’s Policy
on ICT Technical Standardization 2015-2020 in the context of education about standardization.
The university certificate offers a broad view of cutting-edge Smart ICT concepts and provides various
tools to the students in order to develop their sense of innovation. ILNAS commissioned ANEC GIE
standardization department to implement yearly the university certificate, and to carry out its
development. In this framework, ANEC GIE is actively contributing to the creation of pedagogical
materials related to the Smart ICT topics addressed and covered by the university certificate, mainly
from the standardization point of view.

Overall, the pedagogical program has been developed based on a common-thread that describes the
role of technical standardization as one enabler of innovation. In this context, ICT is considered as a
dynamic horizontal sector that supports the development of other economic sectors (vertical
convergence). In the intersection between the horizontal and the vertical sectors, technical
standardization can be considered as an enabler to allow the interoperability between them. All in all,
technical standardization is not only a specific module in the academic program, but it is present in
each module as a reference and as a key factor to trigger innovation. In other words, technical
standardization represents the general keystone of the university certificate.

With the aim of providing the students with a reliable source of information and of recent
breakthroughs, the different standardization committees involved in Smart ICT developments are
considered like a basis for the certificate. They represent the unique ecosystem gathering both the
public (Ministries, administrations, etc.) and private sectors (manufacturers, researchers, business
innovators, and other stakeholders…), making them the beating heart of the ICT progress, and thus
creating a conducive common technical “platform” for the students of the certificate. More in detail,
the focus of the certificate relies on important aspects of Smart ICT and their applications, including
development of Smart Cities, Smart Grid, Big Data and Analytics, Cloud Computing, Internet of Things
and Digital Trust. Moreover, ICT Governance and environmental issues related to ICT are likewise
addressed.

This document, which is used as a basis for the development of the Big Data lecture in the context of
the university certificate, surveys current advances in Big Data and Big Data Analytics from two
complementary points of view: a technical analysis perspective and a business and economic
prospective analysis. From the technical analysis perspective, the document surveys technologies
supporting the development of Big Data and used to analyze Big Data and acquire information from it.
It presents some technological challenges related to Big Data. The document also surveys
considerations when implementing Big Data to reap benefits from the business and economic
prospective analysis. Standards and technical standardization are presented as an important tool to
improve the interoperability between various applications and to share good practices. In this context,
the document presents major efforts related to the development of Big Data standards.

                                                                            Jean-Marie REIFF, Director
                                                              Jean-Philippe HUMBERT, Deputy Director
                                                                                                ILNAS

Table of Contents
FOREWORD ............................................................................................................................................. 3

ABBREVIATIONS ..................................................................................................................................... 3
1.     BIG DATA – AN OVERVIEW .............................................................................................................. 5
     1.1          CHARACTERISTICS AND BUSINESS RELEVANCE.....................................................................................5
       1.1.1         The Vs of Big Data .....................................................................................................................5
       1.1.2         The Business Importance of Big Data .....................................................................................7
     1.2          HOW BIG IS BIG DATA? ......................................................................................................................8
     1.3          BIG DATA TYPES ................................................................................................................................9
     1.4          OPERATIONAL AND ANALYTICAL BIG DATA .........................................................................................13
     1.5          NO SINGLE DEFINITION FOR BIG DATA ..............................................................................................15
2.     PROCESSING BIG DATA: A TECHNICAL ANALYSIS....................................................................... 18

     2.1          INTRODUCTION ................................................................................................................................18
     2.2          ANALYTICAL BIG DATA: THE MAPREDUCE PARADIGM ..........................................................................20
       2.2.1         Google MapReduce .................................................................................................................21
       2.2.2         Apache Hadoop .......................................................................................................................22
           I.        Hadoop MapReduce............................................................................................................................... 22
           II.       Hadoop Distributed File System (HDFS) .............................................................................................. 23
           III.      Hadoop Ecosystem ................................................................................................................................ 23
     2.3          OPERATIONAL BIG DATA: NON-RELATIONAL DATABASES ....................................................................25
     2.4          OTHER BIG DATA TOOLS ..................................................................................................................28
       2.4.1         Batch processing ....................................................................................................................28
       2.4.2         Stream processing ..................................................................................................................29
       2.4.3         Data analytics ..........................................................................................................................31
     2.5          CHALLENGES ..................................................................................................................................34

3.     BUSINESS AND ECONOMIC PROSPECTIVE ANALYSIS ................................................................. 36
     3.1          INTRODUCTION ................................................................................................................................36
     3.2          IMPLEMENTATION ............................................................................................................................37
     3.3          OTHER CONSIDERATIONS .................................................................................................................40
       3.3.1         Data quality .............................................................................................................................40
       3.3.2         Cloud Computing ....................................................................................................................40
       3.3.3         Data security ...........................................................................................................................41
4.     BIG DATA STANDARDIZATION ...................................................................................................... 42
     4.1          BIG DATA STANDARDIZATION FROM FORMAL STANDARDS BODY...........................................................42
     4.2          BIG DATA STANDARDIZATION FROM FORA AND CONSORTIA ..................................................................50
5.     CONCLUSION AND OUTLOOK ....................................................................................................... 53

LITERATURE.......................................................................................................................................... 57
Abbreviations ACRONYM DESCRIPTION ACID Atomicity, Consistency, Isolation, Durability BLOBs Binary large objects CAPEX Capital Expenditure CEN European Committee for Standardization CENELEC European Committee for Electrotechnical Standardization CEP Complex Event Processing CERN European Organization for Nuclear Research CRM Customer relationship management DBMS Database management system EDI Electronic Data Interchange ETL Extract, Transform and Load ETSI European Telecommunications Standards Institute GPS Global Positioning System HDD Hard disk drive HDFS Hadoop Distributed File System ICT Information and Communication Technology IEC International Electrotechnical Commission IEEE Institute of Electrical and Electronics Engineers IF Input Format ISO International Organization for Standardization ITU International Telecommunication Union JSON JavaScript Object Notation JTC Joint Technical Committee LISP List Processing (programming language) MPEG Moving Picture Experts Group NBD-PWG NIST Big Data Public Working Group NIST National Institute of Standards and Technology NoSQL Not only SQL OASIS Organization for the Advancement of Structured Information Standards ODBMS Object-oriented database management system OGC Open Geospatial Consortium OLAP Online Analytical Processing OPEX Operating Expense PDF Portable Document Format RDF Resource Description Framework RFID Radio-frequency identification ROI Return On Investment RPC Remote Procedure Call
RR      Record Reader
SC      Subcommittee
SQL     Structured Query Language
SWIFT   Society for Worldwide Interbank Financial Telecommunication
UI      User Interface
W3C     World Wide Web Consortium
XML     Extensible Markup Language
YARN    Yet Another Resource Negotiator
1.       Big Data – an Overview
Big Data is a topic that has gained enormous attention in the last couple of years by industry,
governments and academia. Although the term Big Data was coined in 1997 to refer to large volumes
of scientific data for visualization (Cox and Ellsworth, 1997), the question raises: why all this sudden
and recent interest?

Today, more data are generated in 10 minutes than all of humanity has ever created through to the year
2003, says Dave Turek from IBM. This stream of data is gigantic, fast-paced and very diverse. Our lives
are becoming at this point soaked with data from connected objects, social networks, online purchase
and behavioral activities that we have reached a point where it all can be correlated. From this
correlation of data, we can discover, understand, learn and improve much valuable information. This is
Big Data.

90% of data in the world has been generated in the last 2 years.

1.1 Characteristics and Business Relevance
The term Big Data is used in a variety of contexts, to better define the technology and its concepts, it is
necessary to focus first on its key characteristics.

1.1.1 The Vs of Big Data
Big Data is characterized by a collection of huge data sets (Volume), generated very rapidly (Velocity)
and with a great diversity of data types (Variety). The original three Vs (Volume, Velocity and Variety)
were introduced in 2001 by Doug Laney from Metagroup. In those days, Laney did not use the term ‘Big
Data’, but he envisioned that e-commerce accelerated data generation with incompatible formats and
structures were pushing traditional data management principles to their limits (Laney, 2001). Because
of the massive amount of data and the variety of its sources, another characteristic of Big Data is the
inherent error, noise and induced bias of erratic data (Veracity) (Schroeck et al., 2012; Zikopoulos et al.,
2013).
Such data are difficult to process by traditional data processing platforms, such as relational databases,
and impossible to analyze with traditional techniques, such as data mining 1.

Big Data refers to technologies that involve data that are too massive, diverse
and fast-changing to be processed efficiently with conventional techniques.
The combination of the original three Vs and this fourth characteristic of Big Data are generally adopted
as the Big Data four Vs, depicted in Figure 1 and presented in Table 1.

1
 Data mining is the analysis of data for relationships that aims to discover previously unknown interrelations
among apparently unrelated attributes of data sets by applying methods from several areas including database
systems, statistics and artificial intelligence (such as machine learning).
Volume                       Velocity
                                Data at Rest                 Data in Motion

                            Terabytes to Exabytes          Speed of generation
                             (clicks, events, etc)          (batch to real-time
                                                              streaming data)

                              Veracity                       Variety
                               Data in Doubt               Data in many Forms

                                  Uncertain                    Structured
                                 Untrusted                   Semi- structured
                                 Uncleansed                   Unstructured

                                     Figure 1 The four Vs of Big Data

  Characteristic                                         Description
 Volume                 How much data: the amount of data that organizations try to harness to
                        improve decision-making across the enterprise

 Velocity               How fast data are created: the speed of incoming data and how quickly they
                        can be made available for analysis (e.g. payment data from credit cards and
                        location data from mobile phones)

 Variety                The various types of data: the different types of structured and unstructured
                        data that an organization can collect, such as transaction-level data, text and
                        log files and audio or video

 Veracity               How accurate are data: the trust into data might be impaired by the data
                        being uncertain, imprecise or inherently unpredictable (e.g. trustworthiness,
                        origin and reputation of the data source).

               Table 1 The four characteristics of Big Data. Also referred as the four Vs

More recently, other Vs have been proposed such as Variability, which refers to data whose meaning is
constantly changing (Hilbert, 2015). Variability gives the temporal dimension to the aforementioned four
Vs and thus could also be viewed as a property of data itself.

One important aspect of Big Data is also its Value (Chen, 2014). The value of Big Data is multiple. It is
first the inherent value of data itself in terms of information contained and its worth in money (e.g. for
reselling purposes). It is also the value in terms of analytical possibilities offered by Big Data.
Processing Big Data and looking for correlations, predicting consumer behaviors, financial risk,
sentiment analysis, leads to huge potentials in terms of e.g. dollar savings, market penetration analysis
or user satisfaction improvement.
Along time, other Vs have been suggested such as Visualization, Volatility, etc. and it is expected that
new propositions will arise as the technology continues to mature.
1.1.2 The Business Importance of Big Data
The volume of data generated, stored, and mined for insights has now become economically relevant
to businesses, government, and consumers.
The use of Big Data is now becoming a crucial way for leading companies to
outperform their peers.
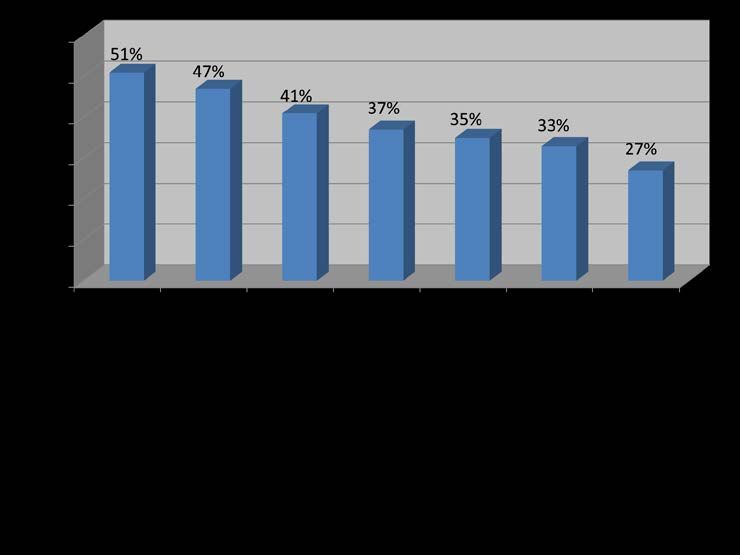
According to Wikibon Executive Summary 2015 (Wikibon, 2015), the growth of Big Data market started
to slow down from 2014 (see Figure 2), although it still remains significantly faster than other IT
markets. This means that this disruptive technology has already started maturing and has now fully
reached the market. Still according to Wikibon, on the period 2011-2026, the Big Data market growth
will reach up to 17%.
Figure 2 Big Data Market Growth Expectations (Wikibon, 2015)
In Gartner’s Hype Cycle for Emerging Technologies 2, Big Data was even not anymore considered as an
emerging technology because it ¨has become prevalent in our lives¨ says Betsy Burton, vice president
and distinguished analyst at Gartner. On the contrary, Big Data is now mature enough to generate
emerging trends and technologies. With the advent of Big Data, data are now becoming a valuable asset
to the company seeking to exploit it.
2
http://www.gartner.com/newsroom/id/3114217The real-time and sheer volume characteristics of Big Data provides the ability to estimate, model,
simulate business metrics such as user satisfaction, product and service interest, or to drive risk
analysis and decision making immediately whereas it could only be done retrospectively before.
Big Data can help business and industry in building new applications that were not possible before,
develop competitiveness and improve customer satisfaction by reducing costs, better segmenting
customers to precisely tailor products and services, designing next generation products along with
reducing their Time to Market and much more.
Many successful stories of using Big Data exist such as the city of Chicago using Big Data to cut crime
and improve municipal services. By collecting, aggregating and analyzing geospatial data in real-time
from over 30 departments, and marrying structured and unstructured data, the city of Chicago drives
online analysis to determine if an uptick in crime is more likely than usual. Other examples such as a
photo-sharing website company that reduced their cumulated CAPEX and OPEX by 80% using an
operational Big Data storage system or a leading newspaper analyzing their user behavior to increase
the customer engagement and thus their global revenue (MongoDB White Paper, 2015).
1.2 How Big is Big Data?
The massive increase of data that are being generated is caused by a number of reasons (Fernández
et al, 2014; Assunção et al., 2014):
1. billions of devices such as sensors of mobile devices, security cameras on highways, and GPS
tracking systems are transmitting and collecting data continuously;
2. the widespread diffusion and adoption of social network websites including YouTube, Facebook
and Twitter where users create records of their daily activities, events they attend, things they eat
and drink, places they visit, pictures they take, etc.;
3. organizations are increasingly generating large volumes of data as a result of monitoring of user
activity / web site tracking as part of their business processes;
4. applications in science experiments result in an increase of data sets at an exponential rate;
5. storage capacity become so cheap that it is often easier and less costly to buy more storage space
rather than deciding what to delete;
6. machine learning 3 and information retrieval techniques have significantly improved in the last
couple of years, thus enabling the acquisition of a higher degree of knowledge from data.
Examples show the massiveness of the amount of data generated every day in business:
• In 1 second: more than 2,100 Skype calls; 700 Instagram photos uploaded; 34,500 GB of Internet
traffic; 53,900 Google searches; 121,400 YouTube videos viewed 4.
• 300 hours of video were uploaded to YouTube every minute (March 2015) 5.
• Twitter serves around 650 million active users, who produce 9100 tweets every second 6.
• Facebook creates 10 terabytes (10x1012 bytes) data every day, and Google produces 24 terabytes of
data every day just from its search operations (Chang et al., 2014).
3
Machine learning is a type of artificial intelligence (AI) that provides computers with the ability to learn without
being explicitly programmed. Machine learning focuses on the development of computer programs that can teach
themselves to grow and change when exposed to new data. However, instead of extracting data for human
comprehension - as is the case in data mining applications - machine learning uses that data to improve the
program's own understanding.
(source: whatis.techtarget.com/definition/machine-learning)
4
http://www.internetlivestats.com/one-second/ (Last accessed April 2016)
5
http://www.youtube.com/yt/press/statistics.html
6
http://www.statisticbrain.com/twitter-statistics/• Each day 2.5 exabytes (2.5x1018 bytes) is created, so that 90% of the data in the world today has been
created in the last two years alone 7.
and in scientific research:
• CERN's Data Centre processes about one petabyte (1015 bytes) of data every day - the equivalent of
around 210,000 DVDs. Its Large Hadron Collider, the largest particle accelerator, generates 40
terabytes per second 8.
• 32 petabytes of climate observations and simulations are conserved on the discovery
supercomputing cluster in the NASA Center for Climate Simulation (NCCS) (Chen and Zhang, 2014).
• The Large Synoptic Survey Telescope (LSST) will record 30 exabytes (30x1018 bytes) of image data
in a single day (Chen and Zhang, 2014).
The possible applications of Big Data and its Analytics include aircrafts, audio, automobiles, call detail
records, click streams, financial services, government, healthcare, military, mobile phones, resource
management, photography, private sector, retail, RFID, search indexing, social networks, text, video,
web logs and various kinds of sciences (e.g. astronomy, biology, chemistry, genomics, geology,
medicine). Business consultancy firms claim that retailers can achieve up to 15–20% increase in ROI
by putting Big Data into Analytics (Perrey et al., 2013), however, few detailed empirical studies have
been conducted to assess the real potential of Big Data (Wamba, 2015).
1.3 Big Data Types
Big Data incorporates all kinds of data and from a content perspective one can make the distinction
between structured data, semi-structured data and unstructured data (Kambatla et al, 2014). In
practice mixed combinations of these three Big Data types occur which is referred to as Poly-structured
data.
• Structured data are data that are part of a formal structure of data models associated with
relational databases or any other form of data tables. They can be generated both by computer
software or humans.
• Semi-structured data are data that are not part of a formal structure of data models. However, they
contain markers (e.g. tags) to separate semantic elements and enforce hierarchies of records and
fields within the data. Therefore, this term is also known as self-describing structure. Examples
are EDI, SWIFT, and XML and JSON data.
• Unstructured data 9 are data that do not belong to a pre-defined data model and include data from
e-mails, video, social media websites and text streams. They account for more than 80% of all data
in organizations (Holzinger et al., 2013). Until recently, software technology did not effectively
support doing much with them except storing or analyzing manually. Just as with structured data,
unstructured data are either machine generated (by computer or software) or human generated.
Machine generated unstructured data include radar or sonar data, satellite images and, security,
surveillance, and traffic videos but also Scientific related data such as seismic imagery,
atmospheric data, and high-energy physics. Human generated includes text messages, e-mails
and social media data.
7
http://www-01.ibm.com/software/data/bigdata/what-is-big-data.html
8
http://public.web.cern.ch/public/en/LHC/Computing-en.html
9
The term unstructured is misleading as such data are not really unstructured because each file contains its own
specific formatting, needed for its specific use by humans or software. In fact, it is the content of the document
that is unstructured. Basically, only white noise is really unstructured (a random signal with a constant power
spectral density).Often, data are generated by a combination of these three groups:
• Machine generated data from computers or devices, such as sensor or log data, audio, video and
click statistics.
• Machine generated data with a specific Business propose, such as CRM data, master data and
transaction data.
• Human generated data, such as social networking, audio, video, images, free text, forms, logs, and
web content.
Big Data technologies assist companies to make sense of all these different types of data.
Hashem et al. (2015) also make the distinction between structured data, semi-structured data and
unstructured data and puts them into a broader classification scheme (see Figure 3), that aside content
format also contains four other aspects: data source, data store, data stage, and data processing.
Data source refers to the sources generating the data including internet data, sensing data, Internet of
Things, etc. Data Store relates to the way the data is stored: document, column, graph, key-value.
Document-oriented store, for example, is a computer program designed for storing, retrieving, and
managing document-oriented information. Some document-oriented store systems include MongoDB,
SimpleDB, CouchDB, DocumentDB and Table Storage. Documents store are inherently a subclass of
the key-value store (e.g., Apache Hbase, Apache Cassandra, DynamoDB, Voldemort and DocumentDB).
Data stage relates to the way the data is treated or preprocessed. For example, data cleaning
eliminates noise and resolves inconsistencies in the data, normalization is a technique that is applied
to a data set to reduce its redundancy. Data processing concerns how data is processed including
mainly batch processing and real-time. Batch processing is a way of processing high volumes of data
where a group of transactions is collected over a period of time. Real-time processing requires a
continual input, constant processing, and steady output of data, as for example S4 and Microsoft Stream
Analytics.
Each of these categories has its own characteristics and complexities as described in Table 2. For a
description of some specific examples in this table, such as MongoDB and S4, please refer to Sections
2.3 and 2.4.Big Data
Classification
Content Data
Data Source Data Store Data Stage
Format Processing
Document-
Structured Web & Social Cleaning Batch
oriented
Semi- Column-
Machine Normalisation Real Time
structured oriented
Unstructured Sensing Graph based Transform
Transactions Key-value
Internet of
Things
Figure 3 Big Data classification (Hashem et al., 2015)
Classification Description
CONTENT FORMAT
Structured Structured data are often managed with SQL. Structured data are easy to input,
query, store, and analyze. Examples of structured data include numbers, words,
and dates.
Semi- Semi-structured data are data that do not follow a conventional database
structured system. Semi-structured data may be in the form of structured data that are not
organized in relational database models, such as tables. Capturing semi-
structured data for analysis is different from capturing a fixed file format.
Therefore, capturing semi-structured data requires the use of complex rules
that dynamically decide the next process after capturing the data.
Unstructured Unstructured data, such as text messages, location information, videos, and
social media data, are data that follow their own format. Considering that the
size of this type of data continues to increase through the use of smartphones,
the need to analyze and understand such data has become a challenge.
DATA SOURCE
Social media Social media is the source of information generated via URLs to share or
exchange information and ideas in virtual communities and networks, such as
collaborative projects, blogs and microblogs, Facebook, and Twitter.Machine- Machine data are information automatically generated from hardware or
generated software, such as computers, medical devices, or other machines, without
data human intervention.
Sensing Several sensing devices exist to measure physical quantities and change them
into signals.
Transactions Transaction data, such as financial and work data, comprise an event that
involves a time dimension to describe the data.
Internet of Internet of Things represents a set of objects that are uniquely identifiable as a
Things part of the Internet. These objects include, e.g. smartphones, digital cameras,
tablets, smartwatches... When these devices connect with one another over the
Internet, they enable more smart processes and services that support basic,
economic, environmental, and health needs.
DATA STORE
Document- Document-oriented data stores are mainly designed to store and retrieve
oriented collections of documents or information and support complex data forms in
several standard formats, such as JSON, XML, and binary forms (e.g., PDF and
MS Word). A document-oriented data store is similar to a record or row in a
relational database but is more flexible and can retrieve documents based on
their contents (e.g., MongoDB, SimpleDB, and CouchDB).
Column- A column-oriented database stores its content in columns aside from rows, with
oriented attribute values belonging to the same column stored contiguously. Column-
oriented is different from classical database systems that store entire rows one
after the other (e.g. BigTable).
Graph A graph database is designed to store and represent data that utilize a graph
database model with nodes, edges, and properties related to one another through
relations (e.g. Neo4j).
Key-value Key-value is an alternative to relational database system that stores and
accesses data designed to scale to a very large size. Examples of key-value
stores are Apache Hbase, Apache Cassandra, DynamoDB, and Voldemort.
DATA STAGE
Cleaning Cleaning is the process of identifying incomplete and not correct data.
Transform Transform is the process of transforming data into a form suitable for analysis.
Normalization Normalization is the method of structuring database schema to minimize
redundancy.
DATA PROCESSING
Batch MapReduce-based systems have been adopted by many organizations in the past
few years for long-running batch jobs. Such system allows for the scaling of
applications across large clusters of machines comprising thousands of nodes.
Real time To continuously collect data at the same rate they are generated and promptly
react to critical information related to business and operations. An example isS4, a real time process-based, scalable, partially fault tolerant, general purpose,
and pluggable platform.
Table 2 Various categories of Big Data (Hashem et al. 2015)
1.4 Operational and Analytical Big Data
Big Data systems may be operational or analytical oriented. Operational systems provide real-time
capabilities for capturing and storing flows of interactive workloads while analytical systems provide
retrospective and complex analysis capabilities. These two types of systems are thus complementary
and have different constraints. Operational and analytical systems have evolved to address their
particular demands separately and in very different ways. Each has driven the creation of new
technology architectures. Operational systems focus on servicing highly concurrent requests while
exhibiting low latency for responses operating on highly selective access criteria. Analytical systems,
on the other hand, tend to focus on high throughput; queries can be very complex and touch most if not
all of the data in the system at any time (see Table 3). Both systems tend to operate over many servers
operating in a cluster, managing tens or hundreds of terabytes of data across billions of records.
Operational Analytical
Latency 1 ms - 100 ms 1 min - 100 min
Concurrency 1000 - 100,000 1 - 10
Access Pattern Writes and Reads Reads
Queries Selective Unselective
Data Scope Operational Retrospective
End User Customer Data Scientist
Technology NoSQL MapReduce, MPP Database
Table 3 Overview of Operational vs. Analytical Systems (MongoDB Big Data Explained, 2016)
Big Data Analytics (also known as Analytics, Business Analytics or even Advanced Analytics and Next
Generation Analytics) refer to techniques and technologies that are used to analyze Big Data and
acquire information from it. Big Data Analytics do not require Big Data per se, but can explain trends
or events that are not discernible with existing techniques and technologies.
Kwon et al. (2014) define Big Data Analytics “as technologies and techniques that a company can employ
to analyze large scale, complex data for various applications intended to augment firm performance in
various dimensions.” Big Data Analytics provide algorithms for complex analysis of structured and/or
unstructured data and includes sophisticated statistical models, machine learning, neural networks,
text analytics and advanced data-mining techniques. Assunção et al. (2014) distinguish three categories
of analytical methods that can be classified as descriptive, predictive, or prescriptive (see Table 4).Category Description
Descriptive Describe models past behavior using historical data and statistical analysis to
identify patterns
Predictive Predicts future outcomes based on historical and current data
Prescriptive Assists decision making by determining actions and assessing its impact
concerning business objectives, requirements, and constraints
Table 4 Categories of Analytics (Assunção et al., 2014)
• Descriptive analytics is used, for example, to discover patterns in temperature fluctuations or
traffic congestion.
• Predictive analytics is one of the most popular Big Data Analytics use cases and becomes more and
more important to Business. It is based on statistical or data-mining solutions that can be used on
both structured and unstructured data. Examples are to predict customers’ next moves based on
what they buy and when they buy it or to predict fraud with credit cards. Another example is
recommendation systems whose goal is e.g. to encourage a customer to discover new products
based on its preferences and historical purchases.
• Prescriptive analytics is used in so-called Complex Event Processing (CEP) that deals with a few
variables in order to correlate it with a specific business process. It is based on event processing
from a business process that collects and combines data from different sources to discover events
that may result into action. An example is a loyalty real-time response when a client makes an on-
line purchase.
To get information out of Big Data sources, a number of phases can be identified. Assunção et al.
(2014) describe the four phases of an analytics workflow for Big Data (Figure 4):
1. Data from various sources, including databases, streams, data mart and data warehouses, are
used to build models.
2. The large volume and different types of the data can demand pre-processing tasks for integrating,
cleaning and filtering. The preparation of data for analysis is a time-consuming and labor-intensive
task.
3. The prepared data are used to train a model and to estimate its parameters. Once the model is
estimated, it should be validated. Normally, this phase requires the use of the original input data
and specific methods to validate the created model. Finally, the model is applied to arriving data.
This phase, called model scoring, is used to generate predictions, prescriptions, and
recommendations.
4. The results are interpreted and evaluated, used to generate new models or calibrate existing ones,
or are integrated to pre-processed data.Data Data Modelling Results Analysis
Source Management and
Visualisation
Behaviour
DBMS Model description,
Pre-processing, Estimation result
filtering, interpretation,
Data aggregation Model predictions,
Warehouse transformation Validation prescriptions,
and other data action impact
related tasks evaluation,
Batch Model
visualisation,
Scoring
etc
Real
Time
Figure 4 Overview of the Analytics workflow for Big Data (Assunção et al., 2014)
In the modeling phase, various statistical and data-mining related algorithms can be used such as:
• Neural networks: statistical learning algorithms inspired by biological neural networks;
• Logistic regression: statistical technique based on standard regression and extends it to deal with
classifications;
• Classification trees: classifies dependent categorical variables based on measurements of one or
more predictor variables.
With the ever increasing amount of data that Big Data Analytics need to cope with, good visualization
and reporting tools are crucial. These have to assist in the three major types of analytics (see Table 4).
However, dedicated hardware for visualization is becoming more and more important for Big Data
Analytics as well (Assunção et al, 2014).
1.5 No Single Definition for Big Data
Despite, or maybe because of, the widespread interest for Big Data no unanimously accepted definition
exists for Big Data (Mayer-Schönberger and Cukier, 2013). Based on Laney’s (from Metagroup) three
Vs 10, several authors made additions to the Volume, Velocity and Variety characteristics of Big Data,
which is reflected in the various definitions. Some relate to the data itself whereas others include
technology aspects or aspects of data analysis.
Gartner for example, that acquired Metagroup in 2005, added information processing capabilities and
now defines Big Data as follows:
Big data is high-volume, high-velocity and high-variety information assets that demand cost-
effective, innovative forms of information processing for enhanced insight and decision making 11.
Similarly, the TechAmerica Foundation has the following definition:
10 http://blogs.gartner.com/doug-laney/files/2012/01/ad949-3D-Data-Management-Controlling-Data-Volume-
Velocity-and-Variety.pdf
http://www.gartner.com/it-glossary/big-data/
11Big data describes large volumes of high velocity, complex and variable data that require advanced
techniques and technologies to enable the capture, storage, distribution, management, and
analysis of the information 12.
Others refer to the potential issues with Big Data and Analytics. McKinsey defines Big Data as:
Data sets whose size is beyond the ability of typical database software tools to capture, store,
manage, and analyze (Manyika, 2011).
Or similarly:
Data sets whose size, type, and speed-of-creation make them impractical to process and analyze
with traditional database technologies and related tools in a cost- or time-effective way 13.
A definition from Berkeley University by Steve Todd 14:
Big data is when the normal application of current technology does not enable users to obtain
timely, cost-effective, and quality answers to data-driven questions.
And similarly:
Big data is what happened when the cost of storing information became less than the cost of
making the decision to throw it away 15.
IDC argues that Big Data has three main characteristics: 1) the data itself, 2) the analytics of the data,
and 3) the presentation of the results of the analytics. Therefore, they define it as
A new generation of technologies and architectures designed to extract value economically from
very large volumes of a wide variety of data by enabling high-velocity capture, discovery, and/or
analysis.
The IDC definition encompasses hardware and software that integrates, organizes, manages, analyses,
and presents data. IDC, Oracle and Forrester all included in 2012 another Big Data characteristic being
‘Value’ (Chen, et al., 2012; Wamba, 2015) which is defined by the perceived value of the data and the
technology to any given organization. However, ‘Value’ is an outcome of the analytics and not an ex-
ante property of data. Others added yet different Vs such ‘Volatility’: “How long do you need to store this
data?” and Visualization: “how to effectively show the derived information?” (Sagiroglu and Sinanc,
2013). Adding such attributes that are not directly related to the technical characteristics of data, does
not make it clearer since the distinction between the data itself and what one can do with it, such as
capture, curation, storage, search, sharing, transfer, analysis, and visualization are separate things.
IBM, on the other hand, has added another fourth V “Veracity” that specifically relates to the data itself
(Schroeck et al., 2012; Zikopoulos et al., 2013). Some data are inherently uncertain, such as weather
conditions, sentiment of buyers of products, or statements in social networks. Despite the relevance of
this data, the uncertainty can, in principle, not be eliminated through just any analytical method. Yet
regardless of this uncertainty, the data may still contain valuable information. If this is acknowledged,
organizations can embrace it and determine how to use it to their advantage.
http://www.techamericafoundation.org/bigdata
12
http://wikibon.org/wiki/v/Big_Data
13
VP Strategy and Innovation at EMC, see http://stevetodd.typepad.com/my_weblog/2011/08/amped-at-uc-
14
berkeley.html
Tim O'Reilly quoting personal correspondence via email from George Dyson, 20 March 2013 (source:
15
http://www.opentracker.net/article/definitions-big-data)The ISO/IEC JTC 1, (2014) 16 definition of Big Data introduces “Variability”, which relates to a change in
one or more of the other Big Data characteristics.
Big data is a data set(s) with characteristics (e.g. volume, velocity, variety, variability, veracity, etc.)
that for a particular problem domain at a given point in time cannot be efficiently processed using
current/existing/established/traditional technologies and techniques in order to extract value.
16
http://www.iso.org/iso/big_data_report-jtc1.pdf2. Processing Big Data: a Technical Analysis 2.1 Introduction Big Data technologies are the result of several decades of technological evolution, which includes advances in relational databases for managing structured data, technologies such as Object Database Management System (ODBMS) to store unstructured data (such as BLOBs, binary large objects) and natural language–based analysis tools to analyze unstructured data. Developments in Big Data technologies were triggered in the late 1990s by leading Internet companies that wanted to monetize on the value from their data. This required innovative approaches to store, access, and analyze massive amounts of data in near real time. For that purpose, research on tools and technologies such as in- memory databases, virtualization and Cloud Computing were driven. In 2004, employees at Google began using Big Data algorithms to support distributed processing (Tambe, 2014). In particular, software related innovations for large-scale analytics based on the MapReduce parallel programming model, with Apache Hadoop being the most relevant implementation for Big Data Analytics, proved to be successful to process immense amounts of data efficiently and timely. Big Data technologies allow organizations to store, modify and analyze vast amounts of data in order to leverage it, which would have been inconceivable only five years ago. Big Data has the potential to significantly change the way organizations do business, such as analyzing buying patterns to enhance product and service offerings, analyzing transaction data in real time to upsell music concert tickets or assessing on-line customers in real time to provide additional offers to that customer. In other words, businesses want to gain insights and actionable results from any kind of data at the right time, no matter how much data are involved. Big Data technologies also bring major advantages for areas other than business, including science and governments. The incomprehensible amount of data generated in Large Hadron Collider research experiments of the European particle physics laboratory CERN, or the efficient analysis of the human genome can only be properly processed with such technologies. The same is true for governmental organizations that tap data from the Internet for antiterrorist activities or investigate fraudulent events based on voice data worldwide. So all this data looks like a gold mine, but as with a gold mine, one has to delve it first. Therefore, a better understanding of the technology around Big Data Analytics is necessary. To get a better understanding on Big Data and Analytics, Pääkkönen and Pakkala (2015) created a technology agnostic reference architecture by integrating several approaches of companies that successfully applied the latest technologies. It provides an overall picture by containing typical functional components, data stores, and connecting data flows in a Big Data Analytics system. It is based on an analysis of published implementation architectures of Big Data use cases of companies, such as Facebook, LinkedIn, Twitter and Netflix. The reference architecture and associated classification of related products/services can be used for architecture design and the selection of technologies or commercial solutions, when creating Big Data systems. Figure 5 presents the design of the high-level reference architecture in which data stores are presented as ellipsis, functionality as rectangles, and data flows as arrows. Similar functionalities are grouped into functional areas which are detailed in Table 5. The authors map the companies’ Big Data infrastructures to their reference architecture and a key position is taken in by Apache Hadoop (the Apache implementation of the MapReduce paradigm and the storage system HDFS). They also map
other functionalities, such as streaming Analytics platforms and complex data analysis processes to
their architecture showing the general applicability of this architecture.

                                                                                                        Data
    Data             Data                Data                   Data                     Data        loading and     Interfacing
   Source         Extraction          loading and            Processing                 Analysis     transformat         and
                                         pre-                                                            ion        visualisation
                                      processing                   Stream
                                                                 processing
                                                                                                                      Visualisation
                                                                                                                       application
                                         Transfer,               Information              Deep        Transformat
                    Extraction
                                           load                   extraction             analytics        ion             Dash
                                                                                                                        boarding
                                                                 Combining                                             application

                                                                                                                        End user
                     Stream                Data                                           Stream        Transfer,
                                                                 Replication                                           application
                    Extraction          compression                                      analytics        load

                                                                  Cleaning

                                                                 Enterpri
                                                                                         Analysis
                     Stream                                       se data
                                                                                          results
                      temp
                       data                                       Sandbox
                                             Raw                                         Publish &      Serving
                                             data                                        subscribe       data
                      Temp
                       data                                      Preparat
                                                                 ion data                Stream
                                                                                         Analysis
     Data                                                         Stream
                                                                                          results
   storage                                                         data

 Job and model       Model          Models            Machine               Job               Jobs      Job
  specification   specification                       learning          specification                scheduling

    Figure 5 A technology independent Big Data Analytics reference architecture (Pääkkönen and
                                          Pakkala, 2015)

        Stage                                                                  Description
 1. Data extraction           Data extracted from data sources may be stored temporarily into a temporary
                              data store or directly transferred, and loaded into a Raw data store. Streaming
                              data may also be extracted, and stored temporarily.

 2. Data loading and          Data are transferred loaded and processed, such as data compression. The
 pre-processing               Raw data store contains unprocessed data.

 3. Data processing           Data from the Raw data store may be cleaned or combined, and saved into a
                              new Preparation data store, which temporarily holds processed data. Cleaning
                              and combining refer to quality improvement of the raw unprocessed data. Raw
                              and prepared data may be replicated between data stores. Also, new
                              information may be extracted from the Raw data store for Deep Analytics.
                              Information extraction refers to storing of raw data in a structured format. The
                              Enterprise data store is used for holding of cleaned and processed data. The
                              Sand-box store is used for containing data for experimental purposes of data
                              analysis.

 4. Data analysis             Deep Analytics refers to execution of batch-processing jobs for in situ data.
                              Results of the analysis may be stored back into the original data stores, into a
                              separate Analysis results store or into a Publish & subscribe store. Publish &
                              subscribe store enables storage and retrieval of analysis results indirectly
between subscribers and publishers in the system. Stream processing refers
to processing of extracted streaming data, which may be saved temporarily
before analysis. Stream analysis refers to analysis of streaming data, to be
saved into Stream analysis results.
5. Data loading and Results of the data analysis may also be transformed into a Serving data store,
transformation which serve interfacing and visualization applications. A typical application for
transformation and Serving data store is servicing of Online Analytical
Processing (OLAP) queries.
6. Interfacing and Analyzed data may be visualized in several ways. Dashboarding application
visualization refers to a simple UI, where typically key information is visualized without user
control. Visualization application provides detailed visualization and control
functions, and is realized with a Business Intelligence tool in the enterprise
domain. End user application has a limited set of control functions, and could
be realized as a mobile application for end users.
7. Job and model Batch-processing jobs may be specified in the user interface. The jobs may be
specification saved and scheduled with job scheduling tools. Models/algorithms may also
be specified in the user interface (Model specification). Machine learning tools
may be utilized for training of the models based on new extracted data.
Table 5 Functional areas of a Big Data Analytics infrastructure (Pääkkönen and Pakkala, 2015)
2.2 Analytical Big Data: the MapReduce Paradigm
MapReduce is a programming paradigm for processing parallelizable problems across huge amount
of data using a large number of computers. In the MapReduce model, the dataset to process is
decomposed into smaller sub-datasets that will be processed separately on different computers
(nodes), interconnected either locally (in this case we will refer as Cluster) or geographically distributed
(in this case we will refer as Grid or Cloud). Then, each result of the processing is gathered to provide
the final result. The data splitting process is called the Map step, the data gathering and delivering step
is called the Reduce step. By this means, the time to process the large problem could be divided by the
number of nodes used if the problem is perfectly parallelizable. This enable to leverage the complexity
of a very large and time consuming computation by using many computers in parallel.
Initially designed in 2004 by Google, the MapReduce concept and its eponym implementation became
rapidly successful. By the end of 2011, Apache released an open-source implementation of this model
named Hadoop. At the time of writing, more implementations of the MapReduce paradigm are also
available, in particular the next generation Apache Spark designed for performance (10 to 100 times
faster than Hadoop) and portability (possibility to run on different platforms).
Although being a very effective multi-purpose model for batch processing, the MapReduce approach
has a number of drawbacks (Fernández et al, 2014; Chen and Zhang, 2014):
• Apart from the fact that the MapReduce algorithm can only be applied for batch processes, it does
not provide any significant improvement in performance when the work cannot be parallelized.
• Processing many small files or performing calculations with small data sizes incurs performance
issues such as long startup time.
• Not all algorithms can be efficiently formulated in terms of Map and Reduce functions since these
have a number of restrictions, such as implementation of iterative jobs or processing networked
data such as graph structures.• Because of the high latency characteristic of MapReduce, it is almost impossible to be applied for
real-time Analytics.
• In order to fully benefit from the MapReduce features, specific expertise of programmer is required
that should carefully tune several factors such as providing a file-system to store data, exploiting
indexes, and the use of an efficient grouping and scheduling algorithm.
In the following sections, we present the two reference implementations of the MapReduce concept,
which are the Google MapReduce framework and Apache Hadoop. Google's MapReduce framework
was the first released implementation of the MapReduce paradigm while Apache Hadoop is currently
'de facto' the most widely used implementation of this paradigm.
2.2.1 Google MapReduce
MapReduce is originally a programming model that was designed in 2004 by Google for processing and
generating vast data sets using a parallel distributed algorithm on a cluster. In the meantime, Google
released the MapReduce framework, the implementation of this model. At this time, the term
MapReduce was referring to both the concept and its only implementation available: the proprietary
Google technology. It is only later with the arrival of other implementations of the MapReduce concept
(such as Hadoop) that MapReduce became genericized. In the following of this section, we consider that
the term MapReduce refers to Google’s implementation of the MapReduce paradigm.
The MapReduce framework orchestrates the processing by distributing computing tasks in parallel
across systems, manages communications and data transfers, handles load balancing and provides
techniques for redundancy and fault tolerance. The framework is inherently robust as it is designed
based on the assumption that hardware failures should be automatically handled in software. It enables
software developers to write programs that can process massive amounts of unstructured data in
parallel. The MapReduce framework combines two existing capabilities, Map and Reduce, from
functional computer programming languages, such as LISP, and has added scalability and fault-
tolerance capabilities (Sagiroglu and Sinanc, 2013).
MapReduce is divided into two stages: the Map procedure carries out filtering and sorting, such as e.g.
sorting staff by last name into queues, one queue for each name. It applies its computation to each data
element of a list (defined as a key-value pair) and produces a new list. It uses input data and each
element of the output list maps to a corresponding element of the input list. The Reduce procedure
analyses and merges input data from the Map steps. It aggregates and summarizes the results, such
as e.g. counting the number of staff in each queue, yielding name frequencies.
MapReduce has the following key behaviors:
• Scheduling: jobs are broken down into individual tasks for the map and the reduce elements.
• Synchronization: an execution framework keeps track of all mapping and reducing operations
establishing a synchronization between them.
• Fault/error handling: if some of the mapping tasks are not executed correctly, the execution
framework will assign the tasks to a different node to finish the job.
• Code/data co-location: keeping the data and the mapping functions on the same machine is
strongly advised to get optimal MapReduce performance and high degree of fault tolerance,
because this results in the smallest latency.
MapReduce is capable to take a very large dataset and break it into smaller, more manageable chunks,
operate on each chunk independently, and then pull it all together at the end. It is able to run on
inexpensive clusters of commodity hardware and standard networks and gets the same result as if all
the work was done on a single machine. Over the years, a number of implementations of the MapReduceYou can also read