Who Calls the Shots? Attributing Responsibility for Covid-19 Vaccines in England
←
→
Page content transcription
If your browser does not render page correctly, please read the page content below
Who Calls the Shots? Attributing Responsibility for
                 Covid-19 Vaccines in England∗

                              Alex Yeandle†                 James Maxia‡

                                         28th January 2022

                                                 Abstract

           A longstanding debate about electoral behaviour has concerned whether voters bias-
       edly attribute blame for government performance. However, a disproportionate focus on
       negative outcomes and partisan issues has left several empirical questions about respon-
       sibility attribution unanswered. In this letter, we attempt to answer these by looking
       at how voters respond to a positive, nonpartisan public health shock. Through a survey
       experiment embedded in the British Election Study, we test whether voters incorporated
       new information when assigning credit to the government for the successful early rollout
       of Covid-19 vaccinations in England. We find that, in general, voters indeed attributed
       less responsibility to government when given information suggesting other institutions
       deserved credit for the rollout. Moreover, using longitudinal measures of partisanship,
       we show that only the newest Government supporters fail to update their attributions.
       Our findings indicate that, when considering the wider universe of cases, pessimism about
       electoral accountability may be overstated.

   ∗
     For various comments and advice at various stages of preparation, we are endebtted to Jane Green, James
Tilley and Ben Ansell. We also thank Jack Bailey and everyone the British Election Study for fielding our
survey and offering advice about our design. AY acknowledges funding from the Grand Union DTP (University
of Oxford) and London School of Economics while working on the manuscript. Our experimental design received
CUREC 1A ethics approval from the University of Oxford, and was pre-registered with EGAP’s online repository,
at https://osf.io/yght2.
   †
     London School of Economics, a.r.yeandle@lse.ac.uk (Corresponding Author)
   ‡
     University of Oxford

                                                     1
Who Calls the Shots? Yeandle and Maxia (2022)
1 Introduction
One of the main normative pillars of democratic theory is that voters punish and reward
governments for their performance in office (Przeworski et al. 2000). In order to effectively
weed out underperforming incumbents, voters should only hold governments accountable for
outcomes that are seen as within its purview and control (Powell and Whitten 1993; Fearon
1999). Significant scholarly attention has therefore been dedicated to examining how voters
determine government responsibility for a given issue. Some have argued that attribution is
a rational process whereby voters utilise information to determine whether an outcome is the
result of government performance (Powell and Whitten 1993). Others have instead suggested
that voters determine responsibility selectively, through a partisan perceptual filter (Tilley and
Hobolt 2011).
The debate between these camps has been particularly difficult to settle due to the empirical
limitations of the existing literature. For instance, most studies have examined responsibil-
ity attribution either in the context of heavily partisan issues – e.g. the economy (Duch and
Stevenson 2008; Lewis-Beck and Stegmaier 2019) - or in one-off shock events that impact only
a subset of the population (Arceneaux and Stein 2006; Malhotra and Kuo 2008; Achen and
Bartels 2017). In addition, the literature has tended to prioritise studying how voters attribute
blame for negative outcomes over understanding how they apportion credit when things go well
(Weaver 1986; Marsh and Tilley 2010). Such a narrow focus, however, leaves several ques-
tions unanswered, such as how voters attribute responsibility for highly successful policies, and
whether a lack of politicisation leads voters to update rationally, not selectively.
We address these questions in this letter, examining how voters attribute responsibility in the
context of a positive nationwide public health shock. Specifically, we analyse how English voters
in May 2021 apportioned credit for one of the quickest rollouts of Covid-19 vaccinations in the
world (Our World in Data 2022). We do so through an original survey experiment embedded
in the British Election Study (BES), which primes respondents with information about the
rollout’s success being down to either the government or the National Health Service (NHS).
We find that receiving the NHS treatment causes respondents to attribute significantly less
responsibility to government for the successful rollout. This effect, in turn, mediates a decline
in general government approval. Such a finding suggests that voters attribute responsibility ra-
tionally, since receiving new information appears to impact the extent to which they credit the
government for successful outcomes. When using BES data to construct longitudinal measures
of partisanship, we find that our main effects only weaken for the newest supporters of the gov-
erning Conservative party. This appears to indicate that voters selectively ignore the treatment
only when it contradicts their recent switch in party preference, a nuance that existing studies
have been unable to measure.
By grounding our research in the case of the vaccine rollout in England, this letter aims to
make a three-fold empirical contribution to the literature. Firstly, because the vaccination
programme was seen as a success, we diverge from the dominant focus on the attribution of
blame and instead explore how voters apportion credit. Secondly, we contribute to a neglected
but growing body of work that studies responsibility attribution for non-economic issues by
choosing to focus on public health policy. Finally, because the vaccine rollout was universally
supported by all political parties, we are able to exclude any potentially confounding effects
2Who Calls the Shots? Yeandle and Maxia (2022)
caused by partisan opposition. Unlike other studies, we are therefore able to credibly isolate
the effects of voters receiving information on their responsibility attributions.
2 The Argument
2.1 Rational and Selective Attribution
How do voters assign credit and blame to politicians? The existing literature presents two op-
posing explanations: voters either rationally update attributions in response to new information
or they behave selectively in accordance with partisan priors.
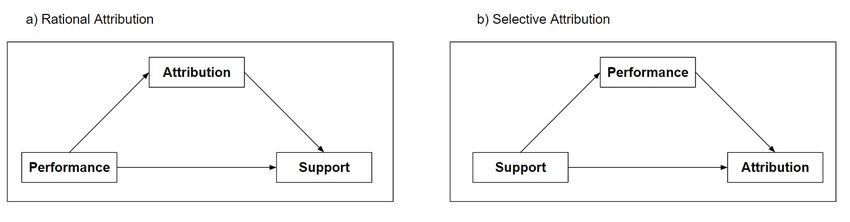
Under the first approach, responsibility attribution plays a crucial mediating role in determining
support for the government (Powell and Whitten 1993). According to canonical models of
accountability, the public seek to elect the highest quality politicians (Barro 1973; Ferejohn
1986). In order to identify capable politicians, voters evaluate their performance when in
office: negative outcomes are seen as indicative of bad decision-making while positive ones are
suggestive of more competent choices. If the outcomes are beyond the control of politicians,
however, such judgments cease to be a useful indicator. From this perspective, voters therefore
have a strong incentive to update their attributions in response to information about who or
what is responsible for a given outcome.
By contrast, selective attribution reverses the direction of causality. Government support is
seen as a static function of partisanship (Campbell et al. 1980) and therefore as the leading
cause, rather than a consequence, of how voters attribute responsibility. Broadly speaking,
government supporters will selectively apportion credit for things that go well, while opposi-
tion supporters will disproportionately assign blame for negative outcomes (Tilley and Hobolt
2011).1 According to this framework, objective information about who or what is responsible
for a given policy outcome should have little influence on how voters apportion credit or blame.
Figure 1: Visual Depiction of Rational and Selective Attribution
1
In effect this is a form of motivated reasoning employed by voters to shield their favoured politician from
criticism and justify their support (Flynn, Nyhan, and Reifler 2017).
3Who Calls the Shots? Yeandle and Maxia (2022)
2.2 What We Are Missing
Existing scholarly work on responsibility attribution has so far been characterised by three key
limitations.
Firstly, most studies have analysed how voters attribute responsibility over issues that are dis-
tinctively partisan or which impact few voters. Since economic indicators provide a measure
of ‘objective’ government performance (Powell and Whitten 1993; Duch and Stevenson 2008),
most studies have examined responsibility attribution in an economic context (Tilley and Hobolt
2011; Bisgaard 2015). However, this narrowed focus fails to recognise how partisan attitudes
often shape how voters evaluate the economy (Evans and Pickup 2010) and neglects a host of
other issues that also matter to voters (Green and Jennings 2017). The few studies that have
ventured beyond the economy mostly concentrate on shorter-term “shocks,” such as natural
disasters (Arceneaux and Stein 2006; Malhotra and Kuo 2008; Bechtel and Hainmueller 2011;
Achen and Bartels 2017), that impact a small proportion of voters (Rubin 2018) and whose
effects generally operate through changes to economic circumstances (Pahontu 2020). If our
aim is to build generalisable theories of democratic accountability, we must broaden our under-
standing of how voters attribute responsibility outside the context of economic performance or
atypical shocks.
Secondly, the literature appears to disproportionately focus on issues that require voters to
assign blame rather than credit. Many studies have thus explored how governments are punished
for overseeing negative outcomes (Malhotra and Kuo 2008) and how “negativity bias” affects
performance evaluations (Soroka, Fournier, and Nir 2019). However, there is still insufficient
evidence surrounding the way voters respond to, and attribute responsibility for, unambiguously
positive outcomes (Bechtel and Hainmueller 2011).
Lastly, despite its theoretical importance, most extant studies have relied upon single cross-
sectional measures of partisanship. While such an approach allows analysts to distinguish
between government or opposition supporters, it does not enable them to identify voters that
have previously swung their partisan allegiances. This constitutes an important shortcoming,
since it is likely that ‘swing voters’ differ from unshakable partisans in the way they attribute
responsibility (Mayer 2008).
This letter aims to overcome all three limitations. We move beyond the narrowed focus on the
economy by examining the case of a salient public health outcome. Moreover, as England’s
vaccine rollout garnered unambiguous and widespread support, we are able to explore how
voters apportion credit in the absence of partisan opposition. Finally, by leveraging the data
quality and longitudinal structure of the BES online panel, we are able to offer novel insights
into how different types of voter attribute responsibility.
4Who Calls the Shots? Yeandle and Maxia (2022)
3 Research Design
3.1 The Covid-19 Vaccination Rollout in England
In this study, we examine responsibility attribution for the rollout of the Covid-19 vaccinations
in England in May 2021.2 Since the country was yet to fully emerge from its third national
lockdown, the progression of the vaccination programme was considered one of the most im-
portant issues for voters at the time. Aside from its salience, the vaccine rollout presents two
features that make it a particularly interesting case to study responsibility attribution.
Firstly, both objective indicators and subjective coverage of the rollout painted an unambigu-
ously positive picture of success in the minds of the voters. With regards to the former, one of
the most used metrics to gauge success was to compare the UK’s vaccination programme with
that of other countries. As shown in Figure 1, the UK held a significant objective advantage over
the efforts of its closest neighbours – the European Union – throughout the period under study.
These objectively encouraging stats were accompanied by overwhelmingly positive media cov-
erage, which provided voters with a clear “one-sided” signal that shaped public perceptions of
the rollout as a success (Chong and Druckman 2010). This signal was reinforced by politicians
of all stripes who, motivated by a desire to maximise vaccination uptake, consistently praised
the vaccination programme and its progress (Craig 2020). Because voters therefore had a clear
and unified picture of the rollout’s success, our study is able to rule out their responsibility
attribution being influenced by elite-level partisan opposition.
Vaccination Rollout in the UK and EU (Early 2021)
Vacciations per hundred people
80
60
40
20
0
Feb Mar Apr May
Date (2021)
European Union United Kingdom
Source: Our World in Data (2022)
Figure 2: Progress of the Vaccination Roll-out in the UK and European Union
Secondly, in this unique context, the government was able to claim a significant amount of
2
We focus our study on England, as in other UK nations the rollout was managed by devolved governments,
making objective responsibility unclear and risking a political response to our focus on the “UK Government.”
5Who Calls the Shots? Yeandle and Maxia (2022)
credit for the vaccine rollout’s success. Throughout the spring, ministers and Conservative
backbenchers drew a direct line in media appearances between England’s high and rapidly
progressing vaccination rates and government decisions, such as that to opt out of the EU’s
vaccine procurement programme (Craig 2020). These talking points were repeatedly echoed in
the campaign for the May local elections, when the Prime Minister promised that “jabs” would
soon become “jobs” under his watch (Piper and James 2021). The public appears to have
agreed with the government’s claims; in another survey carried out by Yeandle, Harding and
Ruiz in May 2021, respondents on average placed government responsibility for the programme
at 8.54 out of 10 and approval for the its handling of the rollout at 8.38.3
However, the narrative of government responsibility did not go entirely uncontested. Despite
the government’s claims, some reporters and commentators pointed out that most of the credit
rested with the quasi-independent National Health Service (NHS) (Williams 2021; Neville and
Warrell 2021; Niemietz 2021). Compared to many other European countries, the NHS’ cen-
tralised structure and access to national patient databases made the logistics of the rollout more
effective (Cookson et al. 2021). For instance, the service insisted upon a data-driven strategy
to vaccination sites, which ensured that everyone was within a ten-mile radius of a centre. The
NHS also enabled local care providers to reach out directly to patients to offer appointments
(Neville and Warrell 2021). Such measures arguably helped England to avoid the logistical
complications faced by comparable European states and contributed to the significantly higher
vaccination rates at the time.
Given that all voters were exposed to similar information about the success of the rollout, we are
able to present them with selective information priming either government or NHS responsibility
for it. This enables us to find convincing evidence about how voters attribute responsibility
for a successful outcome. If voters are rational, we should expect attribution of success to the
government to decline in response to information highlighting the NHS’s role. By contrast,
if voters are selective, then such information will have no effect and voters’ attributions will
simply fit their partisan priors. Figure 2 summarises these empirical expectations, applying the
general theoretical framework to the particular case of the vaccination rollout in Britain.
3.2 Experimental Design
To understand how voters react to novel responsibility information in this context, we embed-
ded a survey experiment into Wave 21 of the BES. While focusing solely on English residents,
our experiment was fielded to a nationally representative sample of 6,689 respondents. As well
as providing us with a far greater sample size than most existing experimental studies, the lon-
gitudinal structure of the BES data gave us access to unbiased information about respondents’
previous voting behaviour and preferences.4 The experiment was fielded in the days following
the UK local elections, which took place on the 6th May 2021.
Each respondent was provided with the following introductory sentences outlining the state of
the UK vaccination rollout. This ensured that everyone had access to baseline performance
3
See https://osf.io/v5zrh. Figures adjusted with standard demographic weights to ensure national represen-
tation.
4
Since the data were collected in previous waves, we can be certain that the responses are not subject to
recall bias or other methodological pitfalls.
6Who Calls the Shots? Yeandle and Maxia (2022)
Figure 3: Summary of Treatment Groups and Theoretical Expectations (Replicated from Pre-
Analysis Plan)
information prior to experimental intervention, even though we believe most respondents were
already aware of the successful nature of the policy.
“The UK has earned praise for its vaccine roll-out, which has seen the
delivery of several hundred thousand vaccines each day. As of April 2021,
the UK has one of the highest vaccination rates in the world.”
Respondents that were not assigned to the control group were then presented with an informa-
tional treatment designed to prime responsibility attribution either for the government or the
NHS.
“The rollout has been overseen by the [government/NHS], which has been
largely credited for this success in delivery and the high numbers of doses
given.”
After receiving this information, respondents were then presented with two questions aimed
at measuring the extent to which they held government responsible for the rollout and their
degree of government approval in general. Both were measured along a ten-point continuous
scale.
“To what extent do you think the UK Government is responsible for the
success of the Covid-19 vaccination programme in the UK?”
“Do you approve or disapprove of the job that the UK Government is
doing?”
7Who Calls the Shots? Yeandle and Maxia (2022)
3.3 Estimation Strategy
In line with our pre-analysis plan, we estimate the effects of treatment using ordinary least
squares and causal mediation analysis. We present a series of specifications with and with-
out covariate adjustment and include several tests in the Appendix to confirm balance across
treatment groups.5
4 Results
4.1 Main Findings
We first present the baseline findings from our experiment. Our analysis yields two main results:
the NHS responsibility prime has a negative effect on government attribution, and that this
mediates a decline in government approval.
4.1.1 Voters Impartially Update in Response to NHS Treatment
In line with our expectations, we find that respondents in the NHS treatment group score
around 0.4 points lower on the ten-point attribution scale, equivalent to around 15% of a stan-
dard deviation. This remains unchanged when we include a battery of covariates. Conversely,
despite anticipating an increase in attribution, the government treatment produced no signif-
icant effect after covariate adjustment. Indeed, nearly all the models in this study yielded a
null finding for the government prime. The most plausible reason for this is that, having re-
peatedly been exposed to claims that the government was responsible for the rollout, voters
were convinced that they deserved significant credit. In other words, we think that voters
were already so convinced of the government’s responsibility prior to treatment that a ceiling
effect prevented their responses from increasing any further in response to our informational
prime. Such an explanation appears to be confirmed when examining the distribution of the
government attribution variable, which is heavily right-skewed (see Appendix Section 1).
4.1.2 Attribution, but not Treatment, Directly Shapes Approval
In the pre-analysis plan, we posited that treatment shapes government approval through its
effects on attribution. In other words, we suggest that attribution has a causal effect on
approval. We test this by regressing approval on attribution, while controlling for treatment
group and a pre-treatment measure of approval to exclude the possibility of reverse causality.6
The results imply that a unit increase in attribution sees a 0.4 unit increase in post-treatment
approval. However, when we regress treatment on approval directly, we find no effect. This
suggests that any effect of treatment on approval is following a more complex causal path.
5
In models that account for demographic covariates, we control for age, education, gender, political attention,
partisanship, Leave-Remain vote choice, and perceived COVID risk. The details of each indicator can be found
in the Appendix.
6
Formally, we estimate approvali,t = β1 attributioni,t + β2 treatmenti,t + β3 approvali,t−1 + γXi,t + ϵi , where
γXi,t represents a vector of partisan and demographic covariates.
8Who Calls the Shots? Yeandle and Maxia (2022)
Baseline Results
a) Attribution ATEs b) Approval ATEs c) Attribution on
Approval
NHS NHS
Attribution
Govt Govt
−0.50 −0.25 0.00 −0.25 0.00 0.25 0.00 0.25 0.50 0.75
Attribution (ATE) Approval (ATE) Approval (AME)
Baseline Lagged
Raw Covariates Raw Covariates Covariates Approval
Figure 4: Baseline Results
4.1.3 Attribution Mediates the Effects of Treatment on Approval
Taking the existing findings together, we again follow our pre-analysis plan and carry out a
causal mediation analysis to uncover the mechanisms by which the treatment operates.7 The
results in Panels (a) and (b) of Figure 5 below suggest that treatment exhibits a competitively
mediated effect on approval, with direct and indirect effects that run in opposite directions.
The NHS treatment leads to a decline in approval as attribution decreases, with no such effect
for the government group. Yet both groups see a positive direct effect, suggesting that receiving
treatment in itself has a positive effect on approval.
We suspect that this may arise from the specific wording of our treatments, with our repeated
mention of “the success of the Covid-19 vaccination programme in the UK” priming positive
evaluations of government, which offsets attribution effects when aggregated. Indeed, when we
compare the two treatment groups to one another in Panel (c), holding this additional prime
constant, we see that the positive direct effect goes away and that the NHS continues to have a
significant, negative, mediated impact on approval. On balance, therefore, our findings suggest
that respondents’ updated responsibility attributions do shape their approval for government.
4.2 Assessing Heterogeneity
Having established the baseline effects of the treatment and its mediated impact on approval, we
now examine whether these findings are consistent across different voter subgroups. As specified
in our pre-analysis plan, we assess how partisanship affects responsiveness to our experimental
7
This approach rests on an assumption of sequential ignorability, which requires that the treatment is in-
dependent from potential outcomes while the mediator (attribution) and the outcome (approval) are causally
related (Imai, Keele, and Tingley 2010). In our case, the robust link between approval and attribution, and the
identified effect of treatment on attribution, make these assumptions more convincingly than in many similar
studies. For a more detailed discussion of sequential ignorability in this context, see the Appendix.
9Who Calls the Shots? Yeandle and Maxia (2022)
Mediation Analysis of Treatment Effects
a) NHS vs Control b) Govt vs Control c) NHS vs Govt
Direct Direct Direct
Effect Effect Effect
Mediated Mediated Mediated
Effect Effect Effect
−0.2 −0.1 0.0 0.1 0.2 −0.2 −0.1 0.0 0.1 0.2 −0.2 −0.1 0.0 0.1 0.2
Govt Approval Govt Approval Govt Approval
Figure 5: Mediation Analysis of Treatment Effects. Panel (a) compares the NHS treatment to
control, (b) compares the Govt treatment to control, and (c) compares the NHS to Govt. Standard
errors estimated using nonparametric bootstrap with 1000 replications, as specified in our pre-
analysis plan.
vignettes, exploiting the BES panel to construct longitudinal measures of party support. We
find that the effects of partisanship are not uniform and hinge on how recently voters began
supporting the government, with only the government’s newest supporters failing to respond
to the treatment.
Looking first at voters who switched party in the 2019 election, or who changed party identity
since Boris Johnson became Prime Minister, we find minimal changes from the baseline model.8
The government treatment continues to exhibit null effects, while both loyal and swing voters
attribute less responsibility after receiving the NHS vignette. Such a finding runs contrary to
the expectations of selective accounts of responsibility attribution, which hold that swing voters
should be more receptive to new information than loyal partisans.
Attribution Effects For Swing Voters
a) Switched Vote b) Switched Party ID
in 2019 GE Since Johnson
NHS NHS
Govt Govtt
−0.75 −0.50 −0.25 0.00 0.25 −0.75 −0.50 −0.25 0.00 0.25
Average Marginal Effect Average Marginal Effect
Loyal Switched Loyal Switched
Figure 6: Heterogeneous Effects by post 2019 Switchers
8
For a more detailed discussion of these measures, see the Appendix.
10Who Calls the Shots? Yeandle and Maxia (2022)
Next, we look at two specific types of swing voter that recently began supporting the govern-
ment: (1) those who switched to supporting the government in the 2019 general election and
(2) those whose vote intention has swung to the government since the last election. While
loyal voters continue to act in line with the baseline model, our findings change for these recent
government switchers.
For those who switched to the government in 2019, there is only a weak response to the NHS
treatment (p = 0.13) but a significant negative effect from the government vignette. This
suggests that such voters selectively ignore information about the NHS’s part in the vaccination
rollout, but are quite sceptical of information emphasising the government’s role too. Such
a finding may be explained when considering that many Government switchers in 2019 had
relatively low levels of political trust and lived in areas with below average quality public
services (Cutts et al. 2020). These voters would therefore be less inclined to attribute credit to
both the government or the NHS in response to the vignettes.
Those who switched to the government since the 2019 general election exhibited no effect for
either treatment. This finding is more clearly suggestive of selective attribution, as it indicates
that respondents were more hesitant to update their attributions. Given that these voters have
only changed allegiance since the pandemic began, it may suggest a form of confirmation bias is
at play. Specifically, a voter who changed allegiance to the government because of their handling
of the vaccine rollout is likely to selectively ignore information that contradicts or undermines
their reason for switching.
Attribution Effects for New Government Supporters
a) Swung to Govt b) Intends to Vote Govt
in 2019 Election in 2021
NHS NHS
Govt Govt
−0.75 −0.50 −0.25 0.00 0.25 −0.75 −0.50 −0.25 0.00 0.25
Average Marginal Effect Average Marginal Effect
Group Loyal Switched Group Loyal Switched
Figure 7: Heterogeneous Effects among post 2019 Tory Switchers
5 Discussion
In this letter, we have studied how voters attribute responsibility for successful public health
policy. Looking at the rollout of Covid-19 vaccinations in England, we provide experimental
11Who Calls the Shots? Yeandle and Maxia (2022)
evidence that voters attribute less responsibility to government when given information that
minimises their role in bringing about a positive outcome. This, in turn, mediates a decline in
government approval. We also discovered that, while most voters act rationally, new government
supporters act in a biased manner consistent with logics of selective attribution.
Overall, our analysis suggests that pessimism about electoral accountability might be over-
stated. Specifically, we show that voters do not only rely on partisan cues but account for
information about responsibility attribution when deciding how much credit the government
deserves for a policy success. While emerging within a specific context – notably, a salient,
positive and non-partisan public health development – our findings suggest that most voters
engage in rational updating of their responsibility attributions. This should give us renewed
confidence in canonical theories of voter-driven democratic accountability.
More broadly, our findings shed light on several underexplored but fruitful avenues for future
research. Firstly, we emphasise the need to move the attribution and accountability literature
on from an overbearing focus on the economy, with our findings suggesting that voters act
differently as the type of issue under consideration changes. Secondly, our ability to distinguish
different types of partisanship goes significantly beyond existing work and reveals new sources of
heterogeneity, calling for a refocus going forward. Lastly, we bring attention to the understudied
electoral effects of public health management, an area ripe for further work as governments
around the world continue to manage the Covid-19 pandemic.
12Who Calls the Shots? Yeandle and Maxia (2022)
6 Bibliography
Achen, Christopher, and Larry Bartels. 2017. “Blind Retrospection: Electoral Responses
to Droughts, Floods, and Shark Attacks.” In Blind Retrospection: Electoral Responses to
Droughts, Floods, and Shark Attacks, 116–45. Princeton University Press. https://doi.org/
10.1515/9781400888740-007.
Arceneaux, Kevin, and Robert M. Stein. 2006. “Who Is Held Responsible When Disaster
Strikes? The Attribution of Responsibility for a Natural Disaster in an Urban Election.”
Journal of Urban Affairs 28 (1): 43–53. https://doi.org/10.1111/j.0735-2166.2006.00258.x.
Barro, Robert J. 1973. “The Control of Politicians: An Economic Model.” Public Choice 14
(1): 19–42. https://doi.org/10.1007/BF01718440.
Bechtel, Michael M., and Jens Hainmueller. 2011. “How Lasting Is Voter Gratitude? An Anal-
ysis of the Short- and Long-Term Electoral Returns to Beneficial Policy.” American Journal
of Political Science 55 (4): 852–68. https://doi.org/10.1111/j.1540-5907.2011.00533.x.
Bisgaard, Martin. 2015. “Bias Will Find a Way: Economic Perceptions, Attributions of Blame,
and Partisan-Motivated Reasoning During Crisis.” The Journal of Politics 77 (3): 849–60.
Campbell, Angus, University of Michigan Survey Research Center, Philip E. Converse, Warren
E. Miller, and Donald E. Stokes. 1980. The American Voter. University of Chicago Press.
Chong, Dennis, and James N. Druckman. 2010. “Dynamic Public Opinion: Communication
Effects over Time.” American Political Science Review 104 (4): 663–80. https://doi.org/
10.1017/S0003055410000493.
Cookson, Clive, Jasmine Cameron-Chileshe, Chris Giles, and Sarah Neville. 2021. “UK Vac-
cination Rollout a Rare Pandemic Success.” https://www.ft.com/content/cdfb7b28-8306-
4db2-8dd6-4f85a92b1778.
Craig, Jon. 2020. “Brexit Has Given UK Chance to ’Pioneer’ Vaccines, Says Boris Johnson in
New Year Message.” Sky News. https://news.sky.com/story/brexit-has-given-uk-chance-
to-pioneer-vaccines-says-boris-johnson-in-new-year-message-12176471.
Cutts, David, Matthew Goodwin, Oliver Heath, and Paula Surridge. 2020. “Brexit, the 2019
General Election and the Realignment of British Politics.” The Political Quarterly 91 (1):
7–23. https://doi.org/10.1111/1467-923X.12815.
Duch, Raymond M., and Randolph T. Stevenson. 2008. “The Economic Vote: How Political
and Economic Institutions Condition Election Results.” Cambridge Core. https://doi.org/
10.1017/CBO9780511755934.
Evans, Geoffrey, and Mark Pickup. 2010. “Reversing the Causal Arrow: The Political Condi-
tioning of Economic Perceptions in the 2000–2004 U.S. Presidential Election Cycle.” The
Journal of Politics 72 (4): 1236–51. https://doi.org/10.1017/S0022381610000654.
Fearon, James D. 1999. “Electoral Accountability and the Control of Politicians: Selecting
Good Types Versus Sanctioning Poor Performance.” In Democracy, Accountability, and
Representation, edited by Adam Przeworski, Bernard Manin, and Susan C. Stokes, 55–97.
Cambridge Studies in the Theory of Democracy. Cambridge: Cambridge University Press.
https://doi.org/10.1017/CBO9781139175104.003.
Ferejohn, John. 1986. “Incumbent Performance and Electoral Control.” Public Choice 50 (1/3):
5–25. https://www.jstor.org/stable/30024650.
Flynn, D. J., Brendan Nyhan, and Jason Reifler. 2017. “The Nature and Origins of Mispercep-
tions: Understanding False and Unsupported Beliefs About Politics.” Political Psychology
38 (S1): 127–50. https://doi.org/10.1111/pops.12394.
13Who Calls the Shots? Yeandle and Maxia (2022)
Green, Jane, and Will Jennings. 2017. The Politics of Competence: Parties, Public Opinion and
Voters. Cambridge: Cambridge University Press. https://doi.org/10.1017/9781316662557.
Imai, Kosuke, Luke Keele, and Dustin Tingley. 2010. “A General Approach to Causal Mediation
Analysis.” Psychological Methods 15 (4): 309–34. https://doi.org/10.1037/a0020761.
Lewis-Beck, Michael S., and Mary Stegmaier. 2019. “Economic Voting.” The Oxford Handbook
of Public Choice, Volume 1. https://doi.org/10.1093/oxfordhb/9780190469733.013.12.
Malhotra, Neil, and Alexander G. Kuo. 2008. “Attributing Blame: The Public’s Response to
Hurricane Katrina.” The Journal of Politics 70 (1): 120–35.
Marsh, Michael, and James Tilley. 2010. “The Attribution of Credit and Blame to Governments
and Its Impact on Vote Choice.” British Journal of Political Science 40 (1): 115–34. https:
//doi.org/10.1017/S0007123409990275.
Mayer, William G. 2008. The Swing Voter in American Politics. Brookings Institution Press.
Neville, Sarah, and Helen Warrell. 2021. “UK Vaccine Rollout Success Built on NHS Deter-
mination and Military Precision.” https://www.ft.com/content/cd66ae57-657e-4579-be19-
85efcfa5d09b.
Niemietz, Kristian. 2021. “How Much Credit Does the NHS Deserve for the Covid Vaccine
Rollout? | The Spectator.” https://www.spectator.co.uk/article/how-much-credit-does-
the-nhs-deserve-for-the-covid-vaccine-rollout-.
Our World in Data. 2022. “COVID-19 Vaccine Doses Administered Per 100 People.” Our
World in Data. https://ourworldindata.org/grapher/covid-vaccination-doses-per-capita.
Pahontu, Raluca L. 2020. “The Democrat Disaster: Hurricane Exposure, Risk Aversion and
Insurance Demand.” {SSRN} {Scholarly} {Paper} ID 3515282. Rochester, NY: Social
Science Research Network. https://doi.org/10.2139/ssrn.3515282.
Piper, Elizabeth, and William James. 2021. “UK PM Johnson Promises ‘Jobs, Jobs, Jobs’
with Post-Pandemic Plans.” Reuters, May. https://www.reuters.com/world/uk/queen-
elizabeth-set-out-uk-governments-post-pandemic-agenda-2021-05-10/.
Powell, G. Bingham, and Guy D. Whitten. 1993. “A Cross-National Analysis of Economic
Voting: Taking Account of the Political Context.” American Journal of Political Science 37
(2): 391–414. https://doi.org/10.2307/2111378.
Przeworski, Adam, Michael E. Alvarez, Jose Antonio Cheibub, and Fernando Limongi. 2000.
“Democracy and Development: Political Institutions and Well-Being in the World, 1950–
1990.” Cambridge Core. https://doi.org/10.1017/CBO9780511804946.
Rubin, Olivier. 2018. “Natural Hazards and Voting Behavior.” Oxford Research Encyclopedia
of Natural Hazard Science. https://doi.org/10.1093/acrefore/9780199389407.013.323.
Soroka, Stuart, Patrick Fournier, and Lilach Nir. 2019. “Cross-National Evidence of a Negativ-
ity Bias in Psychophysiological Reactions to News.” Proceedings of the National Academy
of Sciences 116 (38): 18888–92. https://doi.org/10.1073/pnas.1908369116.
Tilley, James, and Sara B. Hobolt. 2011. “Is the Government to Blame? An Experimental Test
of How Partisanship Shapes Perceptions of Performance and Responsibility.” The Journal
of Politics 73 (2): 316–30. https://doi.org/10.1017/S0022381611000168.
Tingley, Dustin, Teppei Yamamoto, Kentaro Hirose, Luke Keele, and Kosuke Imai. 2014. “Me-
diation: R Package for Causal Mediation Analysis.” UCLA Statistics/American Statistical
Association, August. https://dspace.mit.edu/handle/1721.1/91154.
Weaver, R. Kent. 1986. “The Politics of Blame Avoidance*.” Journal of Public Policy 6 (4):
371–98. https://doi.org/10.1017/S0143814X00004219.
Williams, Zoe. 2021. “Who Should Be Applauded for the Vaccine Programme? Certainly Not
14Who Calls the Shots? Yeandle and Maxia (2022)
the Tories.” The Guardian, March. https://www.theguardian.com/commentisfree/2021/
mar/26/who-should-be-applauded-for-the-vaccine-programme-certainly-not-the-tories.
15Who Calls the Shots? Yeandle and Maxia (2022)
7 Appendix
7.1 Coding Notes
7.1.1 Outcomes
Our outcome variables of interest are attribution and approval. Respondents were asked to
answer each of the following questions on a ten point scale, measured in integers.
“To what extent do you think the UK Government is responsible for the
success of the Covid-19 vaccination programme in the UK?”
“Do you approve or disapprove of the job that the UK Government is
doing?”
The distributions of each variable are displayed in the figure below. As discussed in the main
text, we find that attribution is right skewed. This suggests that voters’ baseline attribution to
the government is very high, indicating that our government treatment group was constrained
by ceiling effects.
a) Attribution b) Approval
750
1000
Count
Count
500
500
250
0 0
0 1 2 3 4 5 6 7 8 9 10 0 1 2 3 4 5 6 7 8 9 10
Attribution Approval
Figure 8: Distribution of Attribution and Approval
7.1.2 Treatment
Each of the 6869 respondents in our sample were randomly assigned to one of three treatment
groups - Government, NHS or control - as outlined in the main text and pre-analysis plan. The
final proportions in each group are summarised in the table below.
16Who Calls the Shots? Yeandle and Maxia (2022)
Control Treatment NHS Total
Count 2378 2182 2309 6869
Proportion (%) 34.6 31.8 33.6 100
Section 2 of the appendix presents results of covariate balance tests, confirming that respondents
across each treatment group are statistically indistinguishable with respect to a long set of
demographic and partisan characteristics.
7.1.3 Covariates
We used a range of standard demographic and partisan covariates at various points in our
analyses.
• Age is continuous measure in years.
• Gender is a coded as a dummy variable for male or female.
• Education is recoded from the original BES classification, grouping respondents’ highest
level of attainment as either none, GCSE, A Level, University, or Vocational.
• Political attention is a continuous measure between 0 and 10, where 10 represents
maximal attention.
• Partisanship codes whether the respondent identify with the Conservative Party (Gov-
ernment), any other party (Opposition), or no party at all (Independent). Note that this
is a simple, cross-sectional measure of partisanship which is distinct from that used when
measuring partisan heterogeneous treatment effects.
• Brexit preferences are coded as a binary indicator, representing whether a respondent
voted to Leave or Remain the European Union in the 2016 referendum.
• Prior Approval is measured with a previous pre-treatment question in the BES, asked to
all respondents as part of the general survey. Respondents give their approval of the UK
government on a Likert scale (strongly disapprove through to strongly approve), which
we convert to a continuous measure ranging from 1-5. When coded as a trichotomous
variable (approve, disapprove, neutral), our results are substantively unchanged.
• Covid risk is a self-reported measure of a respondent’s exposure to government-identified
Covid risk factors. It codes whether a respondent or their close family members have
moderate to severe asthma, diabetes, renal failure, liver disease, chronic lung disease,
a serious heart condition, severe obesity, a condition or treatment which weakens the
immune system, or any other serious condition which is not well controlled.
The distributions of each are plotted below.
7.1.4 Panel Measures of Swing Voting
When assessing partisan sources of treatment effect heterogeneity, our analysis uses several
panel measures of swing voting. For each measure we use either responses from previous BES
waves, or historic vote intention data measured by YouGov, who manage the BES panel, in
past surveys (to avoid issues of false recall). These are constructed as follows:
17Who Calls the Shots? Yeandle and Maxia (2022)
Covariate Distributions
a) Age b) Gender
600 3000
Count
Count
400 2000
200 1000
0 0
25 50 75 100 Female Male
Age (Years) Gender
c) Education d) Political Attention
2000
1000
1500
Count
Count
1000
500
500
0 0
None GCSE A Level University Vocational 0 1 2 3 4 5 6 7 8 9 10
Education Attention
e) Partisanship f) Brexit Vote
2500
2000
2000
1500
Count
Count
1000
1000
500
0 0
Independent Opposition Govt Leave Remain
Partisanship Brexit Vote
g) Prior Approval h) Covid Risk
2000
3000
1500
Count
Count
2000
1000
1000
500
0 0
1 2 3 4 5 Low High
Prior Approval Covid Risk
Figure 9: Distribution of Demographic and Partisan Covariates
18Who Calls the Shots? Yeandle and Maxia (2022)
• 2019 Swing Voters tracks whether respondents voted for the same party in the 2017
and 2019 general elections (core voters) or for different parties (swing voters).
• Party ID Swingers tracks whether respondents’ self-reported party identification
changes over the past five BES waves, with the first wave being the final wave before
Boris Johnson became Prime Minister in July 2019. This measure accounts for the fact
that many core or swing voters may only be so for strategic purposes, even if their
underlying preferences have changed.
• 2019 Government Swingers tracks whether respondents voted for the governing Con-
servative Party in both the 2017 and 2019 general elections (“Loyal 2019 Conservative”),
or switched to the Conservatives in 2019 having voted for a different party in 2017 (“New
2019 Conservatives”).
• 2021 Intended Government Swingers tracks whether respondents intend to vote
for the Conservatives in 2021, having voted for the Conservatives in the 2019 election
(“Loyal 2021 Conservatives”) or having voted for a different party in 2019 (“New 2021
Conservatives”). This measure is designed to pick up the specific subset of voters who
switched to support the government after the beginning of the pandemic, whose support
is more likely rooted in approval of Covid-19 management.
The distributions of each measure are visualised below. Note that even though some measures
appear imbalanced, the large sample size prevents this from presenting problems with statistical
power. Our smallest group by far - “New 2021 Conservatives” in panel (d) below - still has
around 300 observations, a typical size for all heterogeneous subgroups in many smaller sample
surveys.
Swing Voter Distributions
a) 2019 Swing Voters b) Party ID Swingers
1200
3000 900
Count
Count
2000 600
1000 300
0 0
Core Swing Core Swing
c) 2019 Govt Swingers d) 2021 Intended Govt Swingers
2000
2000
1500 1500
Count
Count
1000 1000
500 500
0 0
Loyal 2019 Conservative New 2019 Conservative Loyal 2021 Conservative New 2021 Conservative
Figure 10: Distribution of Panel Measures of Swing Voting
19Who Calls the Shots? Yeandle and Maxia (2022)
7.2 Balance Tests
7.2.1 Balance with OLS
Table 2: Balance Checks with OLS
Pairwise
Government NHS
(1) (2)
Education (GCSE) −0.062 (0.042) 0.037 (0.043)
Education (A-Level) −0.054 (0.044) 0.070 (0.045)
Education (University) −0.024 (0.041) 0.041 (0.042)
Education (Vocational) −0.065 (0.040) −0.018 (0.042)
Age −0.001 (0.001) 0.0001 (0.001)
Gender (Male) 0.014 (0.018) 0.025 (0.018)
Political Attention 0.004 (0.004) 0.005 (0.004)
Partisanship (Opposition) 0.004 (0.025) 0.025 (0.025)
Partisanship (Government) 0.020 (0.025) 0.035 (0.025)
2016 Brexit Vote (Remain) 0.016 (0.020) 0.003 (0.020)
Covid High Risk 0.032∗ (0.018) −0.007 (0.017)
Constant 0.499∗∗∗ (0.057) 0.396∗∗∗ (0.057)
Observations 3,263 3,376
R2 0.004 0.006
Adjusted R2 0.001 0.003
Residual Std. Error 0.499 (df = 3251) 0.499 (df = 3364)
F Statistic 1.289 (df = 11; 3251) 1.779∗ (df = 11; 3364)
Note: ∗ pWho Calls the Shots? Yeandle and Maxia (2022)
7.2.2 Balance with Logistic Regression
Table 3: Balance Checks with Logistic Regression
Pairwise
Government NHS
(1) (2)
Education (GCSE) −0.248 (0.168) 0.150 (0.172)
Education (A-Level) −0.218 (0.177) 0.279 (0.179)
Education (University) −0.097 (0.163) 0.167 (0.170)
Education (Vocational) −0.260 (0.161) −0.071 (0.168)
Age −0.003 (0.002) 0.0004 (0.002)
Gender (Male) 0.056 (0.072) 0.099 (0.071)
Political Attention 0.015 (0.017) 0.021 (0.017)
Partisanship (Opposition) 0.017 (0.099) 0.100 (0.099)
Partisanship (Government) 0.082 (0.101) 0.142 (0.100)
2016 Brexit Vote (Remain) 0.064 (0.079) 0.014 (0.078)
Covid High Risk 0.127∗ (0.071) −0.029 (0.070)
Constant −0.005 (0.227) −0.420∗ (0.230)
Observations 3,263 3,376
Log Likelihood −2,251.766 −2,330.190
Akaike Inf. Crit. 4,527.532 4,684.380
Note: ∗ pWho Calls the Shots? Yeandle and Maxia (2022)
Table 4: Balance Checks with Multinomial Logistic Regression
Government NHS
(1) (2)
Education (GCSE) −0.243 (0.168) 0.141 (0.172)
Education (A-Level) −0.214 (0.177) 0.274 (0.179)
Education (University) −0.097 (0.164) 0.160 (0.169)
Education (Vocational) −0.260 (0.161) −0.072 (0.168)
Age −0.003 (0.002) 0.0003 (0.002)
Gender (Male) 0.055 (0.072) 0.095 (0.071)
Political Attention 0.014 (0.017) 0.022 (0.017)
Partisanship (Opposition) 0.018 (0.099) 0.098 (0.099)
Partisanship (Government) 0.084 (0.101) 0.135 (0.100)
2016 Brexit Vote (Remain) 0.065 (0.080) 0.017 (0.078)
Covid High Risk 0.125∗ (0.071) −0.027 (0.070)
Constant −0.004 (0.227) −0.413∗ (0.230)
Akaike Inf. Crit. 10,857.860 10,857.860
Note: ∗ pTable 5: Baseline Results (Figure 4 (a) and (b) Main Text)
Who Calls the Shots?
Dependent variable:
attribution approval
Attribution (ATE) Approval (ATE)
(1) (2) (3) (4)
Treatment (Govt) −0.214∗∗∗ (0.081) −0.129 (0.079) 0.001 (0.094) −0.021 (0.087)
Treatment (NHS) −0.391∗∗∗ (0.080) −0.390∗∗∗ (0.078) −0.064 (0.093) −0.120 (0.085)
Attribution −0.024 (0.158) −0.241 (0.172)
Lag Approval −0.187 (0.165) −0.400∗∗ (0.179)
Education (GCSE) −0.237 (0.154) −0.638∗∗∗ (0.168)
23
Education (A-Level) 0.019 (0.153) −0.130 (0.166)
Education (University) 0.019∗∗∗ (0.002) 0.016∗∗∗ (0.002)
Education (Vocational) −0.276∗∗∗ (0.066) −0.379∗∗∗ (0.072)
Age −0.060∗∗∗ (0.016) −0.122∗∗∗ (0.018)
Gender (Male) −0.753∗∗∗ (0.093) −0.906∗∗∗ (0.101)
Political Attention 1.481∗∗∗ (0.093) 2.363∗∗∗ (0.102)
Partisanship (Opposition) −0.964∗∗∗ (0.073) −1.100∗∗∗ (0.080)
Partisanship (Government) −0.080 (0.065) −0.066 (0.071)
Observations 6,440 4,777 6,438 4,784
R2 0.004 0.301 0.0001 0.398
Adjusted R2 0.003 0.299 −0.0002 0.397
Note: ∗ pWho Calls the Shots? Yeandle and Maxia (2022)
Table 6: Baseline Results (Figure 4 (c) Main Text)
Dependent variable:
approval
Attribution (ATE)
(1) (2)
Treatment (Govt) 0.065 (0.066) 0.099∗ (0.051)
Treatment (NHS) 0.154∗∗ (0.065) 0.128∗∗(0.050)
Attribution 0.707∗∗∗ (0.012) 0.403∗∗∗ (0.011)
Lag Approval 1.411∗∗∗ (0.025)
Education (GCSE) −0.166 (0.131) −0.111 (0.102)
Education (A-Level) −0.210 (0.136) −0.203∗ (0.106)
Education (University) −0.435∗∗∗ (0.127) −0.346∗∗∗ (0.099)
Education (Vocational) −0.100 (0.126) −0.167∗ (0.098)
Age 0.002 (0.002) 0.001 (0.001)
Gender (Male) −0.193∗∗∗ (0.055) −0.135∗∗∗ (0.043)
Political Attention −0.081∗∗∗ (0.013) −0.051∗∗∗ (0.011)
Partisanship (Opposition) −0.412∗∗∗ (0.078) 0.007 (0.061)
Partisanship (Government) 1.250∗∗∗ (0.080) 0.392∗∗∗ (0.064)
2016 Brexit Vote (Remain) −0.466∗∗∗ (0.062) −0.113∗∗ (0.049)
Covid Risk (High) 0.018 (0.054) 0.042 (0.042)
Observations 4,699 4,660
R2 0.658 0.795
Adjusted R2 0.657 0.795
Note: ∗ pTable 7: Heterogeneous Effects (Figures 6-8 Main Text)
Dependent variable:
Govt Attribution for Roll-out
2019 Vote Choice ID since 2016 New Tory 2019 New Tory 2021 Covid Risk
Who Calls the Shots?
(1) (2) (3) (4) (5)
Treatment (Govt) −0.070 (0.084) −0.171 (0.168) −0.019 (0.084) −0.002 (0.074) 0.114 (0.104)
Treatment (NHS) −0.306∗∗∗ (0.082) −0.476∗∗∗ (0.165) −0.202∗∗ (0.082) −0.229∗∗∗ (0.072) −0.187∗ (0.100)
Swing Voter 0.147 (0.117) 0.032 (0.159) 0.064 (0.148) 0.060 (0.156)
Covid Risk (High) −0.081 (0.060) −0.035 (0.094) −0.067 (0.064) −0.044 (0.057) 0.139 (0.097)
Lag Approval 1.177∗∗∗ (0.032) 1.154∗∗∗ (0.049) 0.684∗∗∗ (0.041) 0.595∗∗∗ (0.043) 1.177∗∗∗ (0.030)
Education (GCSE) −0.053 (0.152) −0.054 (0.210) −0.146 (0.135) 0.013 (0.123) 0.009 (0.137)
Education (A-Level) −0.231 (0.157) −0.263 (0.222) −0.231 (0.146) −0.243∗ (0.132) −0.141 (0.143)
Education (University) −0.189 (0.148) −0.314 (0.209) −0.204 (0.136) −0.086 (0.123) −0.104 (0.134)
25
Education (Vocational) −0.095 (0.146) −0.015 (0.205) −0.109 (0.130) −0.054 (0.118) −0.026 (0.133)
Age 0.011∗∗∗ (0.002) 0.013∗∗∗ (0.003) 0.018∗∗∗ (0.002) 0.016∗∗∗ (0.002) 0.013∗∗∗ (0.002)
Gender (Male) −0.125∗∗ (0.060) −0.206∗∗ (0.094) −0.235∗∗∗ (0.064) −0.232∗∗∗ (0.058) −0.154∗∗∗ (0.058)
Political Attention −0.019 (0.016) −0.025 (0.022) 0.092∗∗∗ (0.017) 0.080∗∗∗ (0.016) −0.025∗ (0.014)
Partisanship (Opposition) −0.187∗∗ (0.089) 0.063 (0.128) 0.220 (0.142) 0.069 (0.146) −0.206∗∗ (0.082)
Partisanship (Government) 0.434∗∗∗ (0.095) 0.344∗∗ (0.135) 0.389∗∗∗ (0.096) 0.120 (0.089) 0.381∗∗∗ (0.086)
2016 Brexit Vote (Remain) −0.497∗∗∗ (0.069) −0.522∗∗∗ (0.107) −0.295∗∗∗ (0.076) −0.222∗∗∗ (0.067) −0.458∗∗∗ (0.065)
Govt*Swing Voter 0.136 (0.167) −0.024 (0.229) −0.427∗∗ (0.213) −0.111 (0.223)
NHS*Swing Voter 0.056 (0.165) 0.128 (0.224) −0.086 (0.210) 0.230 (0.214)
Govt*High Risk −0.313∗∗ (0.140)
NHS*High Risk −0.244∗ (0.136)
Observations 4,212 1,680 1,981 1,954 4,715
R2 0.496 0.467 0.251 0.181 0.479
Adjusted R2 0.494 0.462 0.244 0.173 0.478
Note: ∗ pWho Calls the Shots? Yeandle and Maxia (2022)
7.4 Mediation Analysis
7.4.1 Sequential Ignorability
Conducting causal mediation analysis entails a two pronged assumption of sequential ignor-
ability (Imai, Keele, and Tingley 2010). Formally, this assumption entails that treatment
assignment Ti is ignorable given observed pre-treatment covariates Xi = x (step 1), and that
the mediator Mi is ignorable given observed treatment status t and pre-treatment covariates
(step 2). This is summarised in potential outcomes notation below:
Yi (t′ , m), Mi (t) ⊥⊥ Ti |Xi = x (1)
Yi (t′ , m) ⊥⊥ Mi (t)|Ti = t, Xi = x (2)
In the current study, step 1 of the assumption is easily satisfied given that treatment is randomly
assigned by design. Step 2 suggests that attribution is as good as randomly assigned once we
control for treatment group and pre-treatment covariates. This second stage assumption can
never be made with certainty as one can never rule out all potential confounders (Imai, Keele,
and Tingley 2010). Nonetheless, we believe that our use of lagged approval, a rich set of
demographic and attitudinal covariates, and the magnitude and strength of the attribution
approval relationship provide reasonable evidence in our favour.
7.4.2 Design
We implement our analysis using the mediation package in R (Tingley et al. 2014), as specified
in our pre-analysis plan. To measure the indirect effects of treatment, we regress attribution
on treatment status, holding constant lagged approval and the same set of demographic and
attitudinal covariates Xi used throughout the paper. To measure the overall effects, we use
approval as our outcome, controlling for attribution. The results of these models are then fed
into the mediation package to calculate mediation effects. In both cases we use OLS.
attributionit = β0 + β1 treatmentit + β2 approvali,t−1 + γXi + ϵi (3)
approvalit = β0 + β1 attributionit + β2 treatmentit + β3 approvali,t−1 + γXi + ϵi (4)
7.4.3 Results
The results tables, used to create Figure 5 in the main text, are displayed below.
26Who Calls the Shots? Yeandle and Maxia (2022)
Table 8: NHS vs Control (Figure 5 panel A)
Term Estimate Standard Error Lower CI Upper CI
ACME -0.1215119 0.0276328 -0.1756723 -0.0673515
ADE 0.1428365 0.0466965 0.0513114 0.2343616
Table 9: Govt vs Control (Figure 5 panel B)
Term Estimate Standard Error Lower CI Upper CI
ACME -0.0269337 0.0278127 -0.0814467 0.0275793
ADE 0.1127607 0.0492400 0.0162503 0.2092711
7.4.4 Ruling out Complete Mediation
Lastly, as mentioned in the main text we use instrumental variables to rule out a complete
mediation effect. If mediation is complete, then the exclusion restriction assumption is perfectly
satisfied: treatment is an instrument for attribution, and has no effect on approval except
through its influence on attribution.
When we run these specifications, we find that attribution does not exhibit a significant effect
on approval. In column (3) below there is a positive approval effect from the NHS treatment,
but this drops off once we control for pre-treatment approval in column (4). This is consistent
with the general mediation analysis above, which shows the presence of a positive direct effect
and negative mediated effect in a competititive mediation framework.
Table 10: NHS vs Govt (Figure 5 panel C)
Term Estimate Standard Error Lower CI Upper CI
ACME -0.0934793 0.0271342 -0.1466625 -0.0402962
ADE 0.0398007 0.0479973 -0.0542739 0.1338753
27You can also read


