Who Makes an Effort? A Person-Centered Examination of Motivation and Beliefs as Predictors of Students' Effort and Performance on the PISA 2015 ...
←
→
Page content transcription
If your browser does not render page correctly, please read the page content below
ORIGINAL RESEARCH
                                                                                                                                          published: 10 January 2022
                                                                                                                                    doi: 10.3389/feduc.2021.791599

                                               Who Makes an Effort? A
                                               Person-Centered Examination of
                                               Motivation and Beliefs as Predictors of
                                               Students’ Effort and Performance on
                                               the PISA 2015 Science Assessment
                                               Anders Hofverberg 1*, Hanna Eklöf 1† and Maria Lindfors 2†
                                               1
                                                Department of Applied Educational Science, Umeå University, Umeå, Sweden, 2Department of Education, Umeå University,
                                               Umeå, Sweden

                                               Each time new PISA results are presented, they gain a lot of attention. However, there
                                               are many factors that lie behind the results, and they get less attention. In this study, we
                                               take a person-centered approach and focus on students’ motivation and beliefs, and
                            Edited by:
                               Kui Xie,        how these predict students’ effort and performance on the PISA 2015 assessment of
              The Ohio State University,       scientific literacy. Moreover, we use both subjective (self-report) and objective (time-
                         United States
                                               based) measures of effort, which allows us to compare these different types of
                      Reviewed by:
                  Jessica Gladstone,
                                               measures. Latent profile analysis was used to group students in profiles based on
  New York University, United States           their instrumental motivation, enjoyment, interest, self-efficacy, and epistemic beliefs
               Vanessa Vongkulluksn,
                                               (all with regard to science). A solution with four profiles proved to be best. When
 University of Nevada, United States
                     Carlton J. Fong,          comparing the effort and performance of these four profiles, we saw several significant
Texas State University, United States          differences, but many of these differences disappeared when we added gender and the
                    *Correspondence:           PISA index of economic, social, and cultural status (ESCS) as control variables. The
                     Anders Hofverberg         main difference between the profiles, after adding control variables, was that the
             anders.hofverberg@umu.se
     †
                                               students in the profile with most positive motivation and sophisticated epistemic beliefs
         These authors have contributed
                    equally to this work
                                               performed best and put in the most effort. Students in the profile with unsophisticated
                                               epistemic beliefs and low intrinsic values (enjoyment and interest) were most likely to be
                      Specialty section:       classified as low-effort responders. We conclude that strong motivation and
           This article was submitted to
                                               sophisticated epistemic beliefs are important for both the effort students put into
                Educational Psychology,
                 a section of the journal      the PISA assessment and their performance, but also that ESCS had an unexpectedly
                   Frontiers in Education      large impact on the results.
           Received: 08 October 2021
         Accepted: 14 December 2021            Keywords: effort, motivation, epistemic beliefs, PISA 2015, latent profile analysis
          Published: 10 January 2022

                             Citation:         INTRODUCTION
Hofverberg A, Eklöf H and Lindfors M
       (2022) Who Makes an Effort? A           Students’ performances on large international studies such as Program for International Student
      Person-Centered Examination of
                                               Assessment (PISA) and Trends in International Mathematics and Science Study (TIMSS) gain a lot
Motivation and Beliefs as Predictors of
 Students’ Effort and Performance on
                                               of attention in the public debate. Student test scores are interpreted as pure measures of their
 the PISA 2015 Science Assessment.             proficiency, which in turn is treated as a direct consequence of how well the educational system of a
               Front. Educ. 6:791599.          nation works. But there are many factors behind students’ performances, such as students’
     doi: 10.3389/feduc.2021.791599            motivation, epistemic beliefs, and how much effort the students put into the assessments.

Frontiers in Education | www.frontiersin.org                                        1                                       January 2022 | Volume 6 | Article 791599
Hofverberg et al. Who Makes an Effort?
Both students’ motivation, epistemic beliefs, and their test- 2 In what way do profile membership relate to differences in
taking effort has received research interest in the PISA context as students’ science performance and effort? What role do
well as in other educational and assessment contexts, primarily in students’ gender and socio-economic background play?
terms of how these variables are linearly related to test 3 Are there differences in the association between profile
performance. However, there is still much to be learned, not membership and students’ effort depending on the effort
least when it comes to motivational patterns within individuals measure used?
and how they affect different outcome variables. In this study, we
used latent profile analysis (LPA) to group students into profiles
based on six motivation and belief variables. One advantage of Epistemic Beliefs About Science
such an approach over traditional variable-centered approaches is In the field of science education research, educators and
that it allows us to study how combinations of variables jointly researchers are interested in the tacit beliefs that students hold
predict a given outcome, and whether certain combinations are regarding the nature of knowledge and the process of knowing,
more beneficial than others in terms of outcomes. It also allows us that is, students’ epistemic beliefs (Hofer and Pintrich, 1997,
to see effects of different levels of the variables, as opposed to a 2002; Greene et al., 2016). This includes how one comes to know,
purely linear effect in most variable-centered approaches (i.e., a how knowledge can be justified, and how these beliefs influence
medium-high instrumental motivation can prove to be the best in cognitive processes and engagement. These beliefs function as
a profile analysis, but in e.g., regression analysis only the effect of “filters” to the mind when encountering new information (Hofer
high versus low instrumental motivation can be assessed). The and Bendixen, 2012). Moreover, such beliefs are traditionally
outcomes of interest in the current study are 1) student described on a scale from naïve (representing beliefs that, e.g., all
performance on the PISA science test, and 2) student self- problems are solvable, there is only one correct answer, and
reported and behavioral effort when completing the test. Both authorities provide knowledge) to sophisticated (representing
effort and performance can be assumed—and has been shown–to beliefs that, e.g., there may be several different solutions to a
be affected by students’ epistemic and motivational beliefs, but we problem, knowledge claims need to be justified by evidence, and
know little about how different combinations of these beliefs everyone is active in the construction of knowledge), although
together relate to outcome measures: whether patterns look the such dichotomized interpretations of knowledge have been
same as in linear, variable-centered analyses or if there is added questioned (Sinatra, 2016). Research by, for example, Bråten
value in taking a more person-centered approach. et al. (2008) and Lindfors et al. (2020) has shown that the
Moreover, student test-taking motivation and test-taking characteristics of the learning situation largely determine
effort has been raised as an important validity issue in the which epistemic beliefs are most conducive for students’
low-stakes PISA context as lack of motivation to spend effort science learning. That is, what is assumed to theoretically
on the test may lead to results being biased indicators of students’ constitute a sophisticated view of knowledge does not
actual proficiency (Eklöf, 2010). There are several empirical automatically have to be synonymous with a productive
studies investigating the relationship between student effort approach to science learning.
and performance but few studies have gone further to explore Despite earlier debates on how epistemic beliefs should be
“who makes an effort”, an issue that the current study approaches conceptualized, there is nowadays a consensus that the construct
by studying combinations of relevant variables in the form of is multidimensional, multilayered, and is likely to vary not only
latent profiles, and test-taking effort as an outcome variable. We by domain but also between particular contexts and activities
argue that this is an important relationship to explore if we want (Muis and Gierus, 2014; Hofer, 2016). The epistemic beliefs about
to learn more about which students try their best on the PISA test, science consist of four core dimensions: 1) source, 2) certainty, 3)
and which do not. Further, most previous studies of student test- development, and 4) justification (Conley et al., 2004; Chen,
taking effort on low-stakes tests use either self-report measures or 2012). In the context of a science inquiry, these dimensions
time-based measures of effort, although there are indications that could give insights into how students engage with different
these two types of measures may capture somewhat different sources, where students search for information, how data are
things (Silm et al., 2019; Silm et al., 2020). By including different used to support claims, and in what way they discuss results. The
measures of effort, the present study can investigate if the source and justification dimensions reflect beliefs about the
association between the student profiles and effort are nature of knowing whereas the certainty and development
different for different effort measures. To summarize, the aim dimensions reflect beliefs about the nature of knowledge.
of this study is to examine how different profiles of motivation Development is concerned with beliefs about science as an
and beliefs are associated with differences in students’ test-taking evolving and constantly changing body of knowledge (rather
effort and performance on the PISA 2015 assessment, and if the than stable). The justification dimension is concerned with how
association between these profiles and effort varies for different knowledge is believed to be justified and evaluated in the field,
effort measures. More specifically, based on the Swedish sample that is, how individuals use or evaluate authority, evidence, and
from PISA 2015, we sought answers to the following research expertise, particularly generated through experiments, to support
questions: their claims. PISA 2015 focused on the items that mapped the
students’ beliefs about the validity and limitations as well as the
1 By using latent profile analysis, what student profiles can be evolving and tentative nature of knowledge and knowing, which
identified based on students’ motivation and epistemic beliefs? can be equated with the dimensions of justification and
Frontiers in Education | www.frontiersin.org 2 January 2022 | Volume 6 | Article 791599Hofverberg et al. Who Makes an Effort?
development. However, these two dimensions were not clearly positioned in any single theoretical motivation framework,
distinguished in PISA 2015. Instead, they were merged into but these four motivational variables fit well into the expectancy-
one variable measuring the degree of sophistication. Although value theory (Eccles and Wigfield, 2002). Through the lens of
both justification and development are stated from a expectancy-value theory, science self-efficacy (i.e., the perception
sophisticated perspective and were strongly associated in that one is capable of performing certain science tasks) make up
previous studies (e.g., Winberg et al., 2019), other studies have students’ expectations of success and thus represents one of the
shown that they have different predictive patterns in structural two core components of this motivation theory. Concerning the
equation modeling (SEM) models. For example, Mason et al. other component, value, both interest and enjoyment can be
(2013) found that development was a significant predictor of regarded as intrinsic values that contribute to the subjective task
knowledge, which was not the case for justification. Similar results value that students’ assign to science tasks, while instrumental
by Kizilgunes et al. (2009) showed that development was motivation is an extrinsic form of motivation that is represented
significantly more strongly linked to learning goals, learning by the utility value in expectancy-value theory (i.e., what is the
approach, and achievement than justification was. Similarly, perceived value of science in relation to future goals).
the results of Ricco et al. (2010) indicate that development Expectancies and values are assumed to relate to achievement
and justification had different correlations with, for example, choices, persistence, and performance, in the current study
grades in science and several motivational variables such as operationalized as test-taking effort and test performance,
achievement goals, task value, self-efficacy, and self-regulation. respectively.
Hence, there is reason to keep these two dimensions of epistemic These motivation variables have been extensively studied in
beliefs about science separate. previous research, within and outside the PISA context, and there
Numerous studies within the field of science education have is solid empirical evidence that positive self-beliefs (self-efficacy),
demonstrated the influence of epistemic beliefs about science on but also intrinsic values (interest and enjoyment in learning), are
students scientific reasoning, interpretation of scientific ideas, positively related to achievement. In contrast, the value students
motivation of learning science, science achievement, and critical attribute to different subjects (instrumental motivation) has often
thinking in the context of science (e.g., Hofer and Pintrich, 1997; displayed a relatively weak relationship with performance (cf.
Tsai et al., 2011; Mason et al., 2013; Ho and Liang, 2015). Nagengast and Marsh, 2013; Lee and Stankov, 2018). However,
Moreover, in PISA 2015 when epistemic beliefs about science these are general results from variable-centered analyses. If, for
was included as a new cognitive domain, students’ epistemic example, instrumental motivation is beneficial for students that
beliefs about science were closely associated with their science have low endorsement of other types of motivation, a person-
performance in all participating countries (OECD, 2016; centered analysis could show this while a variable-centered
Vázquez-Alonso and Mas, 2018). analysis could not. Thus, a person-centered analysis can show
There are indications that there is added value of combining if specific combinations of variables have effects that differ from
motivation and epistemic beliefs in research on student’ science the general pattern.
achievement (Chai et al., 2021). Indeed, recent research into
epistemic beliefs tend to include, for example, motivation and Effort
emotions in a broadened perspective on the thinking about Noncognitive variables, such as epistemic and motivational
knowledge and knowing (i.e., epistemic cognition). Thus, the beliefs, need to be translated into some sort of behavior to
interplay between epistemic beliefs and motivation is a central benefit learning and performance. From the above definition
issue in modern research on epistemology (Sinatra, 2016) but of motivation, and in line with the expectancy-value theory (see
there is still a lack of research in this area. Eccles and Wigfield, 2002), it is also clear that motivated behavior
involves a persistence/effort component. Thus, the level of effort
Motivation and Self-Beliefs the individual is willing to invest in a given situation becomes an
While epistemic beliefs can be said to refer to students’ ideas important aspect to consider. Task-specific effort in terms of test-
about “what” science and science knowledge is, students’ taking effort has received research attention, primarily in low-
motivation to learn and perform in science relates to students’ stakes assessment contexts where there are few external incentives
perceptions of “why” they should engage in science (Chai et al., for the participating students to try hard and do their best. PISA is
2021). Wentzel and Wigfield (2009) have defined student an example of such an assessment, and an assessment context
motivation for educational tasks as being “the energy where there has been an interest in whether the validity of
[students] bring to these tasks, the beliefs, values and goals interpretation of test scores could be hampered by low levels
that determine which tasks they pursue and their persistence of effort and motivation among participating students (see e.g.,
in achieving them” (p. 1). This definition is well in line with Butler and Adams, 2007; OECD, 2019; Pools and Monseur,
contemporary motivation theories and with how we conceive of 2021). Test-taking effort has been defined as “a student’s
motivation in the present study. engagement and expenditure of energy toward the goal of
The focus in the present study is on the four domain-specific attaining the highest possible score on the test” (Wise and
motivational variables available in the PISA 2015 student DeMars, 2005). Test-taking effort is typically assessed either
questionnaire: science self-efficacy, interest in broad scientific through self-report or through observation of actual behavior
topics, enjoyment in learning, and instrumental motivation to during test-taking. With the increase in computer-based tests,
learn science. The assessment frameworks for PISA 2015 are not where student interactions with test items are logged and can be
Frontiers in Education | www.frontiersin.org 3 January 2022 | Volume 6 | Article 791599Hofverberg et al. Who Makes an Effort?
analyzed, there has been an increase in research on students’ centered analyses, there are a few examples in the context
observed effort. So far, different time-on-task or response time of large-scale international assessments that are relevant to the
measures are the most common operationalization of test-taking present study. The general pattern in these studies is that
effort (see however Ivanova et al., 2021; Lundgren and Eklöf, motivation and epistemic beliefs tend to co-vary so that the
2021). The assumption is that test-takers need to devote a difference between profiles is primarily the level of motivation/
sufficient amount of time to a task in order to assess the task beliefs, but also that there are examples of profiles that break
and provide a deliberate answer, that very rapid responses to a this general pattern and form interesting exceptions.
given item indicate low effort and lack of engagement, and that She et al. (2019) used PISA 2015 data from Taiwan and
longer time spent on items suggests that the individual exerted employed a latent profile analysis including science self-
more effort and were more engaged in solving the task efficacy, interest in broad scientific topics, enjoyment in
(i.e., engaged in “solution behavior”; Goldhammer et al., 2014; learning science, and epistemic beliefs (as a single variable)
see however Pools and Monseur, 2021). A common time-based together with other variables (e.g., ESCS, science achievement
measure of a given student’s effort on a given test is the response- and teacher support). They found four rather homogeneous
time effort (RTE; Wise and Kong, 2005) which is defined as the profiles, where three of the profiles displayed similar within-
proportion of responses classified as solution behavior. To profile patterns with lower values on enjoyment and higher on
determine what counts as solution behavior, a time threshold epistemic beliefs, while the fourth profile had similar values on
needs to be set for each item. The item threshold is set by all variables. Radišić et al. (2021) also used PISA 2015 data but
determining the shortest time needed for any individual to for Italian students. Their analysis included the same epistemic
solve the item in a serious way (Kong et al., 2007). Thresholds beliefs and motivation variables as the current study did, with
have been specified using omnibus 3/5/10 s thresholds, by visual the addition of an indicator of how often the students were
inspection of item response time distributions, by using ten involved in science activities outside school. They found that a
percent of average item time, and by different model-based five-profile solution provided the best fit. Four of the five
approaches. Different methods for identifying thresholds have profiles showed no overlap in indicator values while the
different strength and weaknesses (Sahin and Colvin, 2020; for fifth and smallest profile (labeled “practical inquirers”)
discussion, see; Pools and Monseur, 2021) and the optimal choice differed dramatically, with the lowest values of all profiles
of threshold can likely not be decided without considering the in interest and epistemic beliefs but among the highest values
assessment context at hand. Although measures such as the RTE in science self-efficacy and science activities. They also found
are not error-free (e.g., it is possible that a highly skilled and that the students in the practical enquirer profile were the
highly motivated student can give rapid but deliberate responses), lowest performing students together with the “uncommitted”
they have demonstrated good validity as approximations of test- group, even though the latter profile had significantly lower
taking effort (Wise and Kong, 2005). Empirical research values in all indicators except for interest and epistemic beliefs.
investigating relationships between test-taking effort (assessed This may imply that higher instrumental motivation, self-
through self-reports or RTE and other response time measures) efficacy, and much science activities outside school did not
and achievement has generally found positive relationships help the practical enquirers to perform better in the PISA
between the two (Wise and DeMars, 2005; Eklöf and Knekta, assessment.
2017; Silm et al., 2019; Silm et al., 2020). Research has further Additionally, Michaelides et al. (2019) present a large number
found negligible correlations between effort and external of cluster analyses based on motivation variables across countries
measures of ability (Wise and DeMars, 2005). The few studies and over time from TIMSS′ mathematics assessment. They
that have compared self-report measures of effort with response- concluded that most clusters were consistent in their
time measures have found moderate relationships between the endorsement of the motivation variables included, but that
two and a stronger relationship between response-time effort and there were a few inconsistent profiles. The performance of the
performance than between self-reported effort and performance inconsistent profiles indicated that strong confidence, especially
(cf. Silm et al., 2019; Silm et al., 2020). When it comes to when aligned with strong enjoyment of math, was more
relationships between motivational variables and test-taking important for high performance than the value for
effort, research is rather scarce. However, a recent study by mathematics. They also concluded that the clusters often
Pools and Monseur (2021) using the English version of the differed in terms of students’ gender and socioeconomic
PISA 2015 science test, found that higher interest and background.
enjoyment in science was associated with higher test-taking Based on these studies, we expect to find distinct student
effort, while science self-efficacy was weakly related to test- profiles, though several profiles may vary only in the level of
taking effort, when other background variables were endorsement of motivation and belief variables. It is also likely
controlled for. that we find some profile that has an inconsistent pattern. In
consistent profiles, higher values on motivation and belief
variables should be associated with better performance, but
Person-Centered Analyses of Motivation the results for inconsistent profiles are unclear. How profile
and Epistemic Beliefs membership relates to effort is unknown, but based on
Although few previous studies have included both variables-centered studies (e.g., Pools and Monseur, 2021)
motivational variables and epistemic beliefs in person- we expect it to be comparable to that of science performance.
Frontiers in Education | www.frontiersin.org 4 January 2022 | Volume 6 | Article 791599Hofverberg et al. Who Makes an Effort?
TABLE 1 | Correlations and descriptive statistics for indicator variables and outcomes.
1 2 3 4 5 6 7 8 9 10 M SD Range
(min-max)
1 Instrumental — 2.85 0.75 1–4
2 Enjoyment 0.382 — 2.65 0.87 1–4
3 Justification 0.135 0.419 — 3.07 0.60 1–4
4 Development 0.118 0.396 0.944 — 3.04 0.59 1–4
5 Self-efficacy 0.395 0.469 0.263 0.281 — 2.73 0.65 1–4
6 Interest 0.381 0.802 0.459 0.427 0.516 — 2.54 0.75 1–4
7 SciPerf 0.155 0.354 0.412 0.385 0.310 0.368 — 499.6 99.4 165.1–680.5
8 SRE 0.162 0.255 0.208 0.198 0.203 0.271 0.262 — 3.13 0.58 1–4
9 AveTT 0.095 0.192 0.173 0.157 0.110 0.201 0.352 0.150 — 0.046 0.51 −1.52–3.60
10 RTE 10% 0.058 0.102 0.138 0.116 0.076 0.117 0.355 0.177 0.389 — 0.972 0.08 0–1
11 ESCS 0.099 0.159 0.183 0.179 0.204 0.198 0.336 0.118 0.075 0.080 0.577 0.73 −3.51–3.04
Note: all correlations were significant at α 0.01. SciPerf, Science performance; SRE, Self-reported effort; AveTT, average time on task; RTE, Response time effort (only the 10 % threshold
is reported here); ESCS, the PISA index of economic, social, and cultural status; M, mean; SD, standard deviation.
METHODS Instrumental Motivation
The instrumental motivation scale consisted of four items
Participants (example item: “What I learn in my science subject(s) is
For this study, we used the data from the 4,995 Swedish students important for me because I need this for what I want to do
(51.1% female, 48.9% male) that both had valid results on the later on”) that the students also answered in a 4-point Likert-scale
PISA 2015 science assessment and provided data on the relevant (from “strongly agree” to “strongly disagree”). To simplify
motivation and belief variables. The Swedish sample was chosen interpretations, the scale for instrumental motivation was
as Sweden was one of few countries that included a measure of reversed so that it matched that of enjoyment (from “strongly
self-reported effort in the PISA 2015 student questionnaire, disagree” to “strongly agree”). The scale showed high internal
allowing us to include both time-based and self-reported effort consistency (Cronbach’s alpha 0.923).
measures. Additionally, Sweden was among the countries with
the lowest test effort in the previous PISA assessment, PISA 2012 Interest
(Swedish National Agency for Education, 2015), making it an Interest was measured through five items, asking students to rate
interesting context to study. Swedish 15-year-old students were to what extent they were interested in different issues pertaining
selected through a stratified two-stage clustered design (OECD, to science (example item: “To what extent are you interested in:
2017). The data is publicly available at the OECD home page.1 Energy and its transformation (e.g., conservation, chemical
reactions)”). Students rated their interest on a 5-point scale
Measures where alternative 1-4 represented “not interested”–“highly
There are several constructs relating to motivation and beliefs in interested” while the fifth alternative represented “I don’t
the PISA 2015 student questionnaire. For this study, we chose to know what this is”. In this study, the fifth alternative was
focus on enjoyment, instrumental motivation, interest, epistemic coded as a missing value to allow interpretation of the level of
beliefs, and self-efficacy. All items can be found in the official students’ interest directly from the scale. The internal consistency
PISA 2015 result report (OECD, 2016). All these constructs were for the interest scale was good (Cronbach’s alpha 0.853).
targeting science in PISA 2015. In the following paragraphs,
information about the measures is provided. However, Self-Efficacy
information about descriptive statistics of the scales is Like the interest scale, the self-efficacy scale presented the
presented in the results (summarized in Table 1). students with a number of science related topics, but in this
case the topics were phrased as tasks (example item: “Describe the
Enjoyment role of antibiotics in the treatment of disease”). Students were
The enjoyment scale consisted of five items (example item: “I asked to rate how easily they would be able to do these tasks on a
have fun when I am learning science”) that the students answered 4-point Likert scale (from “I could do this easily” to “I couldn’t do
in a 4-point Likert-scale (from “strongly disagree” to “strongly this). This scale was reversed so that higher rating indicated a
agree”). The enjoyment scale showed high internal consistency stronger self-efficacy. The internal consistency was high
(Cronbach’s alpha 0.968). (Cronbach’s alpha 0.916).
Justification and Development
Finally, the six epistemic belief items included in the PISA 2015
questionnaire were divided into two separate constructs: beliefs
about the need for justification of knowledge and beliefs that
1
https://www.oecd.org/pisa/data/2015database/. knowledge develops over time. The justification construct was
Frontiers in Education | www.frontiersin.org 5 January 2022 | Volume 6 | Article 791599Hofverberg et al. Who Makes an Effort?
assessed with three items (example item: “Good answers are transformed to the number of standard deviations from all
based on evidence from many different experiments”), as was students’ mean time on that task (z-scores). Finally, the
the development construct (example item: “Ideas in science AveTT-measure was constructed by taking the mean of each
sometimes change”). Both scales were answered on a 4-point student’s deviation from the mean over all the tasks that they
Likert scale (from “strongly disagree” to “strongly agree”) and worked with. Thus, the value of AveTT corresponds to the
showed good internal consistency (Cronbach’s alpha 0.858 for average deviation from mean time used on each task, with
justification and 0.884 for development). positive values indicating a longer time than the mean and
negative values a shorter time. Using the deviation from the
Science Performance mean instead of the raw time makes the scores comparable even
In this study, two categories of outcomes were studied: students’ though different students worked with different sets of items.
performance and students’ effort on the PISA 2015 science RTE was calculated as the proportion of test items that the
assessment. students responded to with solution behavior. We calculated
The PISA 2015 assessment of scientific literacy was comprised RTEs for three different thresholds: 5 s, 10 s, and 10% of the
of 184 test items, assessing three scientific competencies: explain average time of all students (10% of the average time on task
phenomena scientifically, evaluate and design scientific inquiry, ranged from 2.6 to 19.9 s over the 184 test items, with an average
and interpret data and evidence scientifically (OECD, 2016). of 8.1 s). Because the RTE measure had low variability and a
These items can be divided into three classes depending on heavily skewed distribution (e.g., RTE 10% had a mean of 0.972
response format: simple multiple-choice questions, complex and a standard deviation of 0.08 and 74% of the students had a
multiple-choice questions, and constructed response item. value of 1.0, i.e., 100% solution behavior), we chose to use RTE as
PISA uses a matrix sampling design for the test to reduce the a dichotomous variable. Students’ responses were flagged as low-
burden for the individual student. Hence, all students did not effort responses if they did not demonstrate solution behavior on
respond to all 184 test items but were assigned a cluster of science at least 90% of the tasks (i.e., had an RTE >0.90) in line with, for
literacy items designed to occupy 1 hour of testing time (each example, Wise (2015).
student responded to about 30 items). Based on the responses
given and using students’ background data, student science Control Variables
proficiency is estimated through statistical modelling, and each Two control variables were used in this study: gender and the
student is assigned ten different plausible values (“test scores”) for PISA index of economic, social, and cultural status (ESCS). Both
the science assessment (for details, see OECD, 2017). In this these variables were derived directly from the PISA 2015 data.
study, the measure of students’ performance was created through ESCS is a composite score, derived through principal component
multiple imputation of these ten plausible values. analysis, based on students’ parents’ education and occupation,
and indicators of family wealth (including home educational
Effort resources; OECD, 2017). ESCS is standardized with an OECD
How much effort the students invested in the assessment was mean of zero and a standard deviation of one. For more
measured both subjectively, through students’ own reports, and information, see OECD (2017).
through objective measures of time spent solving the science test
items. The subjective measure was based on an effort scale Analysis
distributed to the Swedish students as a national augmentation The data analysis was conducted in three steps: 1) scale evaluation
to the student questionnaire. The scale consisted of four items through confirmatory factor analysis (CFA), 2) classification of
(example item: “I made a good effort in the PISA test”) that the students into subgroups (profiles) through latent profile analysis
students responded to on a 4-point Likert scale (from “strongly (LPA), and 3), predicting outcomes by running profile-specific
agree” to “strongly disagree”). The items were reverse coded to regressions of the outcomes on covariates.
allow a more intuitive interpretation, and the resulting scale had
an acceptable internal consistency (Cronbach’s alpha 0.775). Confirmatory Factor Analysis
This measure of students’ effort is called self-reported effort (SRE) CFA was used to verify that the motivation and belief variables
throughout this paper. It should be noted that the SRE is a global were separate constructs and to create composite measures from
effort measure, students estimate their effort for the entire PISA the individual items. All individual items were entered into one
test, not only the science part of the test. model, where they were restricted to load on their hypothesized
The objective measures of students’ effort were based on the latent variable (i.e., enjoyment, instrumental motivation, interest,
time they spent on test items. A complicating factor is the PISA justification, development, or self-efficacy). Latent variables were
matrix sampling design where different students complete allowed to covary, but not individual items. The analysis was
different test items that vary in type, length, complexity et conducted in Mplus 8.6 using the robust maximum likelihood
cetera. Taking this into consideration, two different measures (MLR) estimator. MLR is robust against violations of normality
were derived: the average time on task (AveTT) and the response and can handle missing data through full information maximum
time effort (RTE). The first step in constructing the AveTT- likelihood (FIML) methodology (Muthén and Muthén, 1998-
measure was calculating the mean and standard deviation in time 2017). We evaluated the fit of the CFA-models through chi-
spent on each individual task for all students that had that task in square values and four goodness-of-fit indices: root mean square
their test version. Then, each student’s time on each task was error of approximation (RMSEA), standardized root mean square
Frontiers in Education | www.frontiersin.org 6 January 2022 | Volume 6 | Article 791599Hofverberg et al. Who Makes an Effort?
residual (SRMR), comparative fit index (CFI), and Tucker-Lewis covariances between indicator variables within classes are
index (TLI). We relied on Hu and Bentler (1999) fixed to zero (i.e., conditional independence is assumed).
recommendation of cut-off criteria for good fit, namely • Class-varying, diagonal (B)—variances are freely estimated
RMSEA < 0.06, SRMR < 0.08, and CFI and TLI values >0.95. and covariances between indicators within classes are fixed
After confirming that the CFA model fitted the data acceptably to zero.
(see the results section), student’s factor scores on the latent • Class-invariant, unrestricted (C)—indicator variables’
variables from the final model was exported to be used in further variances are constrained to be equal in all classes and
analyses. Using factor scores is advantageous compared with indicators are allowed to covary within classes, although
using, for example, the average of the items on a subscale covariances are constrained to be equal across classes.
because factor scores provide a weighted measure, partially • Class-varying variances, class-invariant covariances (D)—
controlled for measurement error (Morin et al., 2016). variances are freely estimated and indicator variables are
The self-reported effort scale (SRE) used as outcome variable allowed to covary within classes, but covariances are
in this study was compiled through a separate CFA-model and constrained to be equal across classes.
the factor scores were used. Factor scores for motivation and • Class-varying, unrestricted (E)—indicator variables are
belief variables as well as SRE were transformed to the same scale allowed to covary within classes, and both covariances
they were originally answered in (scale 1–4) to facilitate the and variances are allowed to vary between classes.
interpretation of results.
In all LPA analyses, MLR was used as estimator and the
Latent Profile Analysis COMPLEX option was used to specify that students were nested
LPA belongs to a group of latent variable models called finite in schools. Using the COMPLEX option, Mplus adjusts standard
mixture models. Finite mixture models are labelled so because errors to take into account the nested structure of the data.
they assume that the distribution of variables is a mixture of an Models were estimated with at least 400 random start values
unknown but finite number of sub-distributions. The purpose in the first step, and the 100 sets of random starts with the best
of LPA is to identify and describe these sub-distributions in the log-likelihood values were chosen for final optimization in the
form of groups of individuals (called profiles in LPA) that share second step. If more random start values were needed to replicate
similarities in one or more indicator variables. As the focus is the best log-likelihood values (to verify that the solution is not a
on grouping individuals rather than variables, as many other local maximum), it was increased to a maximum of 10,000
common statistical methods do, LPA is often labeled a person- random starts in the first step and 2,500 in the second step.
centered approach to statistical analyses (as opposed to a To compare different models, we used several statistical fit
variable-centered approach). It should be noted that the indicators: log-likelihood, information criteria (AIC Akaike
term LPA in this paper is used as an umbrella term for information criterion, BIC Bayesian information criterion,
models with several different variance-covariance matrix SABIC sample-size adjusted BIC, CAIC consistent AIC,
specification, although the term LPA is sometimes used AWE approximate weight of evidence criterion), likelihood
only for models that assume conditional independence ratio tests (LMR-LRT Lo-Mendell-Rubin adjusted likelihood
(i.e., restricts the covariance between indicators to zero, cf. ratio test, BLRT bootstrapped likelihood ratio test) and
conventional multivariate mixture models in Muthén and likelihood increment percentage per parameter (LIPpp). The
Muthén, 1998-2017). information provided by the different information criteria was
We used LPA to classify the students in subgroups based on very similar in the results, so for the sake of parsimony only AIC,
similarities in their factor scores on the enjoyment, instrumental BIC, and AWE will be presented.
motivation, interest, justification, development, and self-efficacy A good fit is indicated by a high log-likelihood (least negative
latent variables from the CFA. As for the CFA-analyses, Mplus 8.6 value) and low values on the information criteria for the model
was used for these analyses. In accordance with recommendations under evaluation. Furthermore, both nonsignificant p-values in
by, for example, Masyn (2013) and Johnson (2021), models with the LMR-LRT or BLRT and low LIPpp for the model with one
several different variance-covariance matrix specification were more profile than that under evaluation signal that adding
tested, with the number of classes varying between 1 and 8 where profiles do not increase fit substantially compared to the
possible. In some of the less restricted variance-covariance added complexity. Besides these fit indicators, the classification
specifications, convergence became an issue with increasing accuracy (i.e., how well separated the profiles are) was evaluated
number of profiles and the maximum number of profiles had through the entropy value and the profiles were examined to
to be reduced. evaluate the interpretability and utility of the solution.
Five different variance-covariance structures were compared.
These five have previously been described by, for example, Masyn Predicting Outcomes
(2013) and Pastor et al. (2007). Indicator variables’ means were To study differences in the outcomes between the profiles created
allowed to vary between classes in all models. The five variance- by the LPA-analysis, we ran profile-specific regressions through
covariance specifications compared were: the manual BCH-method included in Mplus 8.6 (Asparouhov
and Muthén, 2020). Mplus’ BCH method is a method suggested
• Class-invariant, diagonal (A)—indicator variables’ by Vermunt (2010) and can be described as a weighted multiple
variances are constrained to be equal in all classes and group analysis in the form of a logistic regression where the
Frontiers in Education | www.frontiersin.org 7 January 2022 | Volume 6 | Article 791599Hofverberg et al. Who Makes an Effort?
classification error in the LPA is accounted for. First, we used the correlated variables could be perceived as subconstructs of the
BCH-method to evaluate the means of students’ science higher-order constructs “interest/intrinsic motivation” and
performance, SRE, and AveTT across the different profiles. “epistemic beliefs,” respectively. Descriptive statistics further
Second, students’ science performance, SRE, and AveTT were suggest that students on average tended to be rather positive in
regressed individually on two covariates (ESCS and gender) their ratings of motivation, beliefs, and self-reported effort.
separately in each profile. The difference in intercept between The three measures of effort were only weakly correlated. The
profiles was used as indicator of different levels of the outcome. two time-based measures (AveTT and RTE) had similar
RTE was treated a bit differently from the other outcomes. correlations to most of the other variables, although the
RTE is designed to sort out low-effort answers from those association between AveTT and other variables tended to be
resulting from students’ solution behavior, so we chose to use stronger than that between RTE and other variables. Even if all
it as a categorical variable by comparing the percentage of low- indicators were positively and significantly correlated with
effort answers (defined as RTE < 0.90) in each profile instead of science performance, the relationship between instrumental
including the values in regressions. motivation and performance was the weakest, while the
strongest relationship with performance was observed for the
epistemic beliefs. Overall, descriptive results are rather well in line
RESULTS with what previous research has shown (e.g., Guo et al., 2021).
Regarding control variables, ESCS was significantly but very
In the following sections, our results will be presented. First, we weakly correlated with all three effort measures (r 0.075–0.118),
present information about the validation of the constructs and and moderately correlated with students’ science performance (r
descriptive statistics of the variables together with zero-order 0.336). Moreover, a series of t-tests showed that there were significant
correlations. Next, we present the classification of students into differences between female and male students for all effort measures.
profiles, including how we chose the best fitting model, and These differences were relatively small. Mean SRE was slightly higher
describe the resulting profiles in more detail. Finally, we for male students (M 3.16, SD 0.62) than for female students (M
describe the association between the profiles and students’ 3.11, SD 0.54), t (4,870) −2.917, p 0.004. On the other hand,
science performance and effort. AveTT showed that male students (M −0.006, SD 0.51) spent a
little less time on tasks than female students (M 0.095 SD 0.51), t
Confirmatory Factor Analysis (4,981) 7.053, p < 0.001. RTE showed similar results: for the 10%
The CFA model including the six latent factors enjoyment, threshold (results for the other thresholds were comparable to these),
instrumental motivation, interest, justification, development, male students (M 0.969, SD 0.08) had slightly smaller proportion
and self-efficacy fitted the data well, χ 2 (335, N 4,995) of solution behavior than female students (M 0.976, SD 0.06), t
3,173.2, RMSEA 0.041, SRMR 0.031, CFI 0.962, and (4,982) 3.362, p 0.001. Science performance did not differ
TLI 0.958. Moreover, all item loadings on the latent factors between the genders, t (4,984) 0.045, p 0.964.
were acceptably high (all standardized loadings were equal to or
higher than 0.60). An alternative model with the two epistemic Classification of Students Into Profiles
beliefs constructs combined into one factor was also constructed. Determining the best fitting model in LPA is a complex endeavor
Again, the fit was good χ 2 (340, N 4,995) 3,711.8, RMSEA that involves both statistical and substantive considerations. We
0.045, SRMR 0.032, CFI 0.955, and TLI 0.950. However, the chose to follow the process used by Johnson (2021) and first
model with justification and development separated showed determined the optimal number of profiles for each variance-
better fit and was therefore chosen as basis for further covariance specification and then compared the best model from
analyses and the factor scores from this model were saved. each specification with each other. Information about the models
The SRE scale was treated in a similar way, but in a separate is displayed in Table 2.
CFA-model only including the four SRE indicators. This model No more than two profiles could be extracted with the class-
showed excellent fit, χ 2 (2, N 4,995) 2.06, p 0.36, RMSEA varying unrestricted variance-covariance matrix (specification E).
0.002, SRMR 0.003, CFI 1.000, and TLI 1.000, and all As this specification therefore seems to be overly complex, it was
standardized loadings were equal to or higher than 0.60. excluded from further consideration.
The log-likelihood value did not reach a maximum for any
Descriptive Statistics number of profiles for any variance-covariance specification.
Descriptive statistics, based on the factor scores from the Neither did the information criteria reach a minimum. It is not
previous step in the case of SRE, motivation, and belief unusual for fit to continue increasing for each added profile, and in
variables, are presented in Table 1 (for RTE, only the 10% such cases it is recommended to examine a plot of the fit statistics to
threshold is displayed). As shown, all indicator variables and determine if there is an “elbow” where model improvement is
outcomes were significantly correlated with each other. diminishing (Nylund-Gibson and Choi, 2018; Ferguson et al.,
Despite being significant, most correlations were under 0.3. 2020). Such plots, together with the likelihood increment
On the other hand, two correlations between indicators stand percentage per parameter (LIPpp) and log-likelihood ratio tests
out as strong: that between enjoyment and interest (r 0.802) comparing pairs of models, were the primary sources of
and that between justification and development (r 0.944). information for the decision of the number of profiles that fitted
These high correlations are not surprising, since the highly best for each model.
Frontiers in Education | www.frontiersin.org 8 January 2022 | Volume 6 | Article 791599Hofverberg et al. Who Makes an Effort? TABLE 2 | Model overview for all latent profile analysis (LPA) models. No. Npar LL AIC BIC AWE p p LIPpp Entropy Smallest of LMR- BLRT class profiles LRT size % Class-invariant diagonal variance-covariance matrix (A) 1 12 −31,607.4 63,238.7 63,316.9 63,455.1 100.0 2 19 −28,180.0 56,397.9 56,521.7 56,740.5 0 0 1.55 0.805 42.6 3 26 −25,932.0 51,916.0 52,085.5 52,384.9 0 0 1.14 0.922 7.4 4 33 −24,561.2 49,188.5 49,403.5 49,783.5 0 0 0.76 0.945 3.6 5 40 −23,493.0 47,066.1 47,326.7 47,787.4 0 0 0.62 0.873 3.5 6 47 −22,584.0 45,262.0 45,568.3 46,109.5 0.0003 0 0.55 0.890 3.5 7 54 −21,931.2 43,970.4 44,322.3 44,944.2 0 0 0.41 0.885 3.5 8 61 −21,421.0 42,964.0 43,361.5 44,064.0 0 0 0.33 0.891 3.4 Class-varying diagonal variance-covariance matrix (B) 1 12 −31,607.4 63,238.7 63,316.9 63,455.1 100.0 2 25 −26,130.9 52,311.8 52,474.7 52,762.6 0 0 1.33 0.963 45.8 3 38 −22,237.5 44,551.1 44,798.7 45,236.3 0 0 1.15 0.899 23.5 4 51 −20,039.5 40,181.0 40,513.4 41,100.7 0 0 0.76 0.924 8.1 5 64 −18,185.2 36,498.4 36,915.5 37,652.5 0.0004 0 0.71 0.929 8.1 6 77 −16,862.0 33,877.9 34,379.7 35,266.4 0 N/A1 0.56 0.931 8.1 7 90 −15,687.1 31,554.3 32,140.7 33,177.2 0 N/A1 0.54 0.943 2.7 Class-invariant unrestricted variance-covariance matrix (C) 1 27 −21,410.8 42,875.5 43,051.5 43,362.4 100.0 2 34 −20,670.0 41,408.1 41,629.6 42,021.2 0 0 0.49 0.971 4.7 3 41 −20,363.1 40,808.2 41,075.4 41,547.6 0.0008 0 0.21 0.924 7.0 4 48 −19,387.0 38,869.9 39,182.7 39,735.5 0 0 0.68 0.976 3.5 5 55 −19,224.6 38,559.1 38,917.5 39,550.9 0.0158 0 0.12 0.960 3.4 6 62 −18,847.9 37,819.9 38,223.9 38,937.9 0 N/A1 0.28 0.969 3.7 7 69 −18,251.5 36,641.1 37,090.7 37,885.3 N/A1 N/A1 0.45 0.992 3.4 8 76 −16,553.6 33,259.2 33,754.4 34,629.6 N/A1 N/A1 1.33 0.997 3.4 Class-varying variances, class-invariant covariances (D) 1 27 −21,410.8 42,875.5 43,051.5 43,362.4 100.0 2 34 −20,447.6 40,975.1 41,235.8 41,696.4 0.0014 0 0.35 0.973 4.3 3 41 −19,604.1 39,314.2 39,659.6 40,270.0 0 0 0.32 0.966 6.3 4 48 −18,945.0 38,022.0 38,452.1 39,212.1 0.24 0 0.26 0.939 3.2 5 55 −18,663.2 37,484.3 37,999.1 38,908.9 0.23 0 0.11 0.905 3.2 Class-varying unrestricted variance-covariance matrix (E) 1 27 −21,410.8 42,875.5 43,051.5 43,362.4 100.0 2 55 −19,947.1 40,004.3 40,362.6 40,996.0 0 0 0.24 0.597 25.2 Note: Npar, number of free parameters; LL, log-likelihood; AIC, akaike information criterion; BIC, bayesian information criterion; AWE, approximate weight of evidence criterion; p LMR- LRT, p-value for the Lo-Mendell-Rubin adjusted likelihood ratio test; p BLRT, p-value for the bootstrapped likelihood ratio test; LIPpp, likelihood increment percentage per parameter. 1 The best log-likelihood for the k-1 profile could not be replicated in the test. Both diagonal variance-covariance specifications (A and B) For both variance-covariance specification C and D, the four- were discarded in favor of the class-invariant unrestricted profile solution was deemed the best. There was an elbow in the specification (C) and the one with class-varying variances and plots of all statistics, showing that the increase in fit for each class-invariant covariances (specification D). The reasons profile added diminished after four profiles. The LIPpp indicated were that no “best” number of profiles could be identified a similar trend, where adding a fifth profile only increased the fit for the diagonal specifications and that comparisons between with slightly more than 0.1 percent per parameter, close to what is diagonal specifications on one hand and C and D on the other considered a small increase (i.e., LIPpp > 0.1, Grimm et al., 2021). showed that the two latter had a better fit for the same number The BLRT-tests were significant for all models, so it did not of profiles. Moreover, all covariances between indicator provide any useful information for class enumeration. For variables were significant in specifications C and D, variance-covariance specification D, the LMR-LRT was suggesting that the indicators shared variation that was not insignificant for both the four- and the five-profile solution, fully explained by profiles and that allowing indicators to indicating that these were not significantly better than the covary is justified. solution with one less profile and therefore supporting the Frontiers in Education | www.frontiersin.org 9 January 2022 | Volume 6 | Article 791599
Hofverberg et al. Who Makes an Effort?
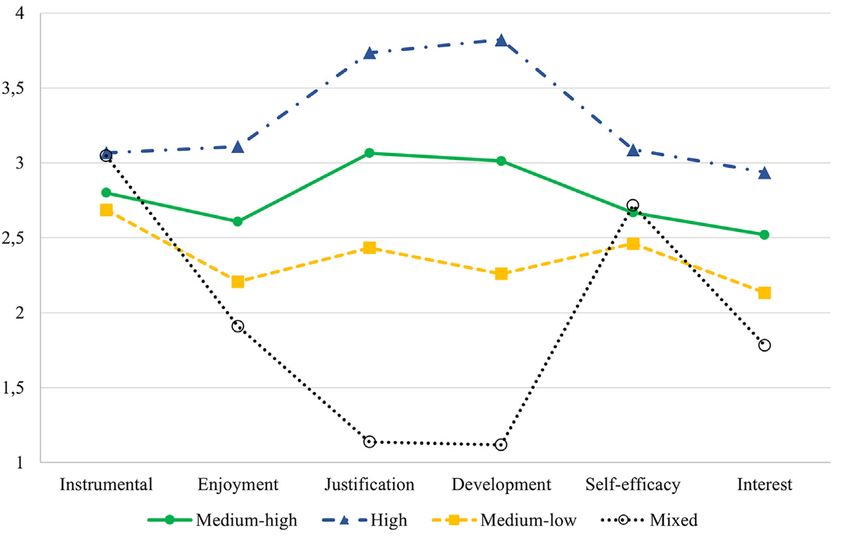
FIGURE 1 | Graph comparing the indicator variables score in each profile in the four-profile solution of model C.
TABLE 3 | Student’s profiles and control variables.
The resulting profiles were close to identical to each other
and the original profile, supporting the reliability of the
Profile n % Of total sample % Females Mean ESCS analysis.
Medium-high 3,377 67.6 52.8 0.54
High 984 19.7 49.0 0.81 A Closer Look at the Chosen Model
Medium-low 458 9.2 48.7 0.36 The profiles of the four-profile solution for variance-covariance
Mixed 176 3.5 37.5 0.43 specification C are described in Figure 1 and additional
Note: n, sample size; ESCS, the PISA, index of economic, social, and cultural status. information is provided in Table 3. In the following
paragraph, the profiles are presented in order from the largest
profile to the smallest (based on the students’ most likely profile
membership).
three- and four-profile solution. However, studying plots and the The largest profile represented 3,377 students (67.6% of the
LIPpp, we found that the four-profile solution was a better total sample) and contains students that, on average, had
solution than the three-profile solution. Also, when we moderately high values on almost all indicator variables
examined the profiles more closely, we concluded that the compared to the other profiles. On instrumental motivation
addition of the fourth profile added relevant information. For and self-efficacy, they had medium to low values compared
variance-covariance specification C, the LMR-LRT was with the other profiles. Overall, this group had medium to
significant at α 0.05 for all profile solutions, but it was high motivation and epistemic beliefs compared to the other
insignificant at α 0.01 for the 5-profile model. Although not profiles, so we labeled it the Medium-high profile. The second
as high as the traditional cut-off for significance (i.e., α 0.05), largest profile represented 984 students (19.7%) and had high
our relatively large sample may lead to significant loglikelihood values on all indicator variables. Thus, we labeled it the High
tests, even when the difference between models is insubstantial profile. The students in the High profile also had a notably higher
(Grimm et al., 2021; Johnson, 2021). We therefore considered this average ESCS-value than the students from other profiles. The
as partial support for the conclusion that the other information third largest profile, with 458 students (9.2%), showed moderately
pointed at: that the four-profile solution was the best solution for low values on all indicator variables, and the lowest of all profiles
variance-covariance specification C. on instrumental motivation and self-efficacy. Consequently, we
Comparing the four-profile solutions for variance- labeled it the Medium-low profile. It is noteworthy that the
covariance specification C and D revealed that D provided students in the Medium-low profile had the lowest average
better fit statistics. However, inspection of the profiles showed ESCS-values of all profiles. Finally, the smallest profile
that the resulting profiles were very similar. Since the represented 176 students (3.5%) and contained students with
information they provided were similar, we chose to focus the highest instrumental motivation value of all profiles and high
on the four-profile solution from variance-covariance self-efficacy, but the lowest score of all profiles on the other
specification C for reasons of parsimony. To check the indicator variables. They had particularly low values on the two
reliability of the final model, we randomly split the sample epistemic beliefs indicators, suggesting the least sophisticated
in two groups and re-ran the LPA in both groups separately. beliefs. Because of the varied pattern of this profile, we labeled
Frontiers in Education | www.frontiersin.org 10 January 2022 | Volume 6 | Article 791599You can also read