Will Students Come Back? - A July 2021 Parent Survey About School Hesitancy and Parental Preferences for COVID-19 Safety Practices in Schools
←
→
Page content transcription
If your browser does not render page correctly, please read the page content below
Research Report

C O R P O R AT I O N

Heather L. Schwartz, Melissa Kay Diliberti, David Grant

Will Students Come Back?
A July 2021 Parent Survey About School Hesitancy and Parental Preferences for
COVID-19 Safety Practices in Schools
For more information on this publication, visit www.rand.org/t/RRA1393-2.

About RAND
The RAND Corporation is a research organization that develops solutions to public policy challenges to help make communities throughout the world safer and more secure, healthier
and more prosperous. RAND is nonprofit, nonpartisan, and committed to the public interest. To learn more about RAND, visit www.rand.org.

Research Integrity
Our mission to help improve policy and decisionmaking through research and analysis is enabled through our core values of quality and objectivity and our unwavering commitment to
the highest level of integrity and ethical behavior. To help ensure our research and analysis are rigorous, objective, and nonpartisan, we subject our research publications to a robust and
exacting quality-assurance process; avoid both the appearance and reality of financial and other conflicts of interest through staff training, project screening, and a policy of mandatory
disclosure; and pursue transparency in our research engagements through our commitment to the open publication of our research findings and recommendations, disclosure of the
source of funding of published research, and policies to ensure intellectual independence. For more information, visit www.rand.org/about/principles.

RAND’s publications do not necessarily reflect the opinions of its research clients and sponsors.

Published by the RAND Corporation, Santa Monica, Calif.
© 2021 RAND Corporation
       is a registered trademark.

Limited Print and Electronic Distribution Rights
This document and trademark(s) contained herein are protected by law. This representation of RAND intellectual property is provided for noncommercial use only. Unauthorized posting
of this publication online is prohibited. Permission is given to duplicate this document for personal use only, as long as it is unaltered and complete. Permission is required from RAND to
reproduce, or reuse in another form, any of its research documents for commercial use. For information on reprint and linking permissions, please visit www.rand.org/pubs/permissions.
About this report

This report provides the survey questions and weighted responses from a July 2021 survey of parents concerning school hesitancy and
preferences for COVID-19 safety practices in schools in the United States. The results are intended to inform school districts’ and health
officials’ planning for operating schools in fall 2021.
A technical appendix describing the survey methods is available at www.rand.org/t/RRA1393-2. Results of a similar survey fielded in
May 2021 are available at www.rand.org/t/RRA1393-1.
In the interest of rapid release, this report was not edited or proofread. It will be superseded by a final version.

RAND Education and Labor
This research was undertaken by RAND Education and Labor, a division of the RAND Corporation that conducts research on early
childhood through postsecondary education programs, workforce development, and programs and policies affecting workers,
entrepreneurship, and financial literacy and decisionmaking. This report is based on research funded by The Rockefeller Foundation.
The authors are grateful to the staff of The Rockefeller Foundation and to the members of the State & Territory Alliance for Testing
(https://www.rockefellerfoundation.org/covid-19-response/stat) for their collaboration and feedback on our surveys. The findings
presented are those of the authors and do not necessarily reflect positions or policies of The Rockefeller Foundation. For more
information and research on these and other related topics, please visit rockefellerfoundation.org.
More information about RAND can be found at www.rand.org. Questions about this report should be directed to hschwart@rand.org,
and questions about RAND Education and Labor should be directed to educationandlabor@rand.org.

About the Authors
Heather L. Schwartz is the director of the Pre-K to 12 Educational Systems program within the Education and Labor division of RAND.
She researches education and housing policies intended to reduce the negative effects of poverty on children and families. She holds a
Ph.D. in education policy.
Melissa Kay Diliberti is an assistant policy researcher at RAND and a doctoral fellow at the Pardee RAND Graduate School. Her
research interests include survey design and methodology and educational equity. She holds a master of public policy degree.
David Grant is a senior social/behavioral scientist at RAND. Grant has extensive survey research experience, including telephone-based
surveys, random digit–dial sampling, address-based sampling, noncoverage, and nonresponse bias. Grant holds a Ph.D. in sociology.

                                                                                                                                             3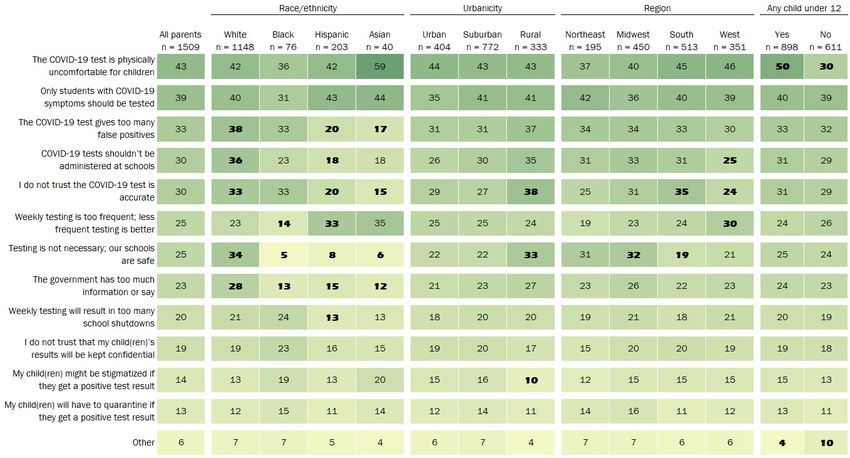
Contents

Key findings . . . . . . . . . . . . . . . . . . . . . . . . . . . . . . . . . . . . . . . . . . . . . . . . . . . . . .    5

Overview of the July 2021 parent survey . . . . . . . . . . . . . . . . . . . . . . . . . . .                               6

Questions about parents’ plans as of July 2021 for sending their
children to school in person in fall 2021 . . . . . . . . . . . . . . . . . . . . . . . . . . .                             7

Questions about parents’ preferred school safety measures to
prevent the spread of COVID-19 . . . . . . . . . . . . . . . . . . . . . . . . . . . . . . . . . .                         14

Questions about COVID-19 testing of children at schools . . . . . . . . . . .                                              20

Questions about COVID-19 vaccination . . . . . . . . . . . . . . . . . . . . . . . . . . . .                               25

                                                                                                                                4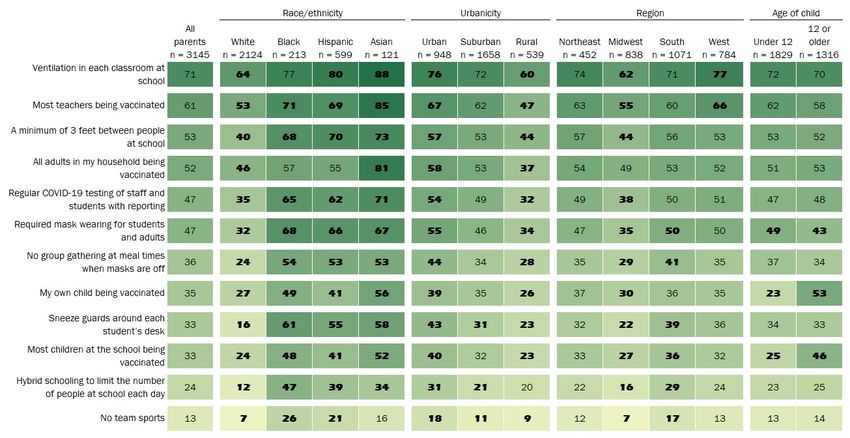
Key findings

1. Eighty-nine percent of parents planned to send their children to school in person in fall 2021 as of July, which was an
   increase from 84 percent in May. Parents took the second survey between July 16 and 29, by which time the number
   of COVID-19 cases nationally had increased since May 2021, due to the delta variant.
2. As of July 2021, 82 percent of Black and 83 percent of Hispanic parents planned to send their children to school in
   person in fall 2021, compared with 94 percent of White and 88 percent of Asian parents. Although this racial gap was
   substantial, it was smaller than in May 2021.
3. Parents with children under 12—who are too young to be eligible for COVID-19 vaccines—were just as likely to plan to
   send their kids back fully in person as parents with children 12 years and older.
4. COVID-19–related health concerns remained the top reasons for parents not sending their children to school in
   person in fall 2021, as opposed to concerns about academics, racial discrimination, bullying, or critical race theory.
5. About two-thirds or more of Black, Hispanic, and Asian parents needed each of the following practices in place to feel
   safe sending their children to school in person: ventilation in classrooms, teachers being vaccinated, social distancing,
   mandatory masking, and regular COVID-19 testing. Substantially fewer White parents needed these practices in place
   to feel safe. As in May 2021, parents who were unsure about sending their children to school in person especially
   wanted all of these safety practices, and more.
6. Only 27 percent of parents said that they already knew in detail which specific COVID-19 safety measures their child’s
   school will have in place. Sixty percent of parents wished to know more about which COVID-19 safety measures their
   child’s school is enacting for fall 2021. Sixty-one percent of parents selected a school staff member—most commonly,
   the principal—as the source from which they most trust information about school safety measures.
7. Fifty-one percent of parents supported voluntary, free weekly COVID-19 testing at school in July 2021, which was
   similar to the percentage in May 2021. Seventy-five percent supported COVID-19 testing if their child showed COVID-
   19 symptoms. The most common reason parents did not support COVID-19 testing at schools was a concern that the
   test was physically uncomfortable for children.
8. Fifty-seven percent of parents overall planned to get their child vaccinated for COVID-19 as of July 2021. This was true
   for 79 percent of vaccinated parents but only 10 percent of unvaccinated parents.
                                                                                                                               5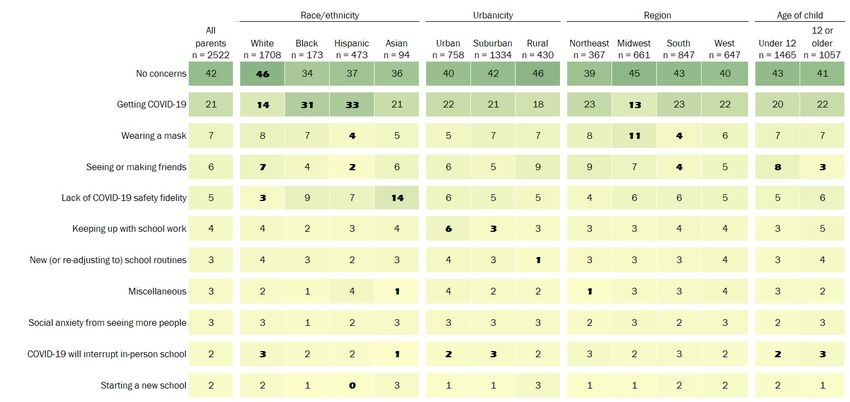
Overview of the July 2021 parent survey

• The State & Territory Alliance for Testing (representatives from more than 40 states and territories) and
  The Rockefeller Foundation worked with RAND to develop a survey of parents of school-age children
• 3,146 parents of children ages 5–18 took the survey. The survey was open from July 16 to July 29, 2021.
• The results are nationally representative of U.S. parents of children ages 5–18
• The completion rate was 52 percent
• The July 2021 survey included three similarly worded survey questions from the May 2021 survey to
  gauge change in parent attitudes over time
• Results of the May 2021 survey can be found at www.rand.org/t/RRA1393-1
• Because children under 12 were not eligible for a COVID-19 vaccine at the time of this survey, we
  focused some questions on the youngest school-age child to understand parents’ willingness to send
  their unvaccinated children to school. Overall, 62 percent of parents who took the survey had one or
  more child under age 12.
• Survey methods and a description of the parent sample are available in the technical appendix at
  www.rand.org/t/RRA1393-2
• Information about the State & Territory Alliance for Testing is available at
  https://www.rockefellerfoundation.org/covid-19-response/stat

                                                                                                              6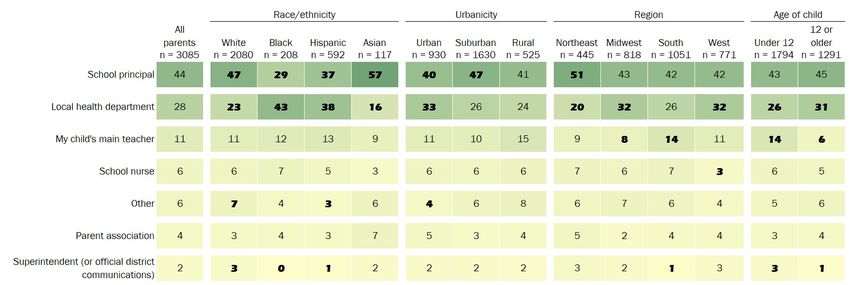
Questions about parents’ plans as of July 2021 for
sending their children to school in person in fall 2021

                                                          7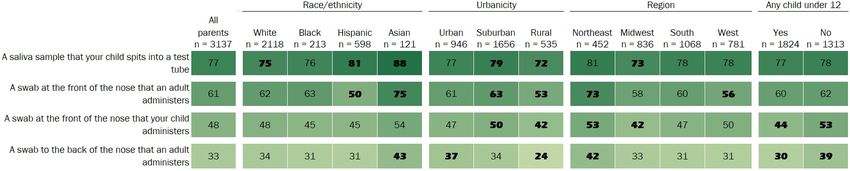
Will you send your child(ren) to school in person at least one day per week
this fall 2021? [Comparison of May and July]

Figure notes: An * indicates that the percentage of a given parent subgroup (e.g., urban, Midwest) who selected a response is statistically different (p < 0.05)
from the balance of all parents at the same time point. Black bars represent 95% confidence intervals. When May and July confidence intervals for a parent
subgroup do not overlap, parents’ responses in May are statistically different from July. Percentages might not sum to 100 due to rounding.                        8
Are you sending your youngest school-age child to school in person this
fall 2021?

Figure notes: An * indicates that the percentage of a given parent subgroup (e.g., urban, Midwest) who selected a response is statistically different (p < 0.05)
from the balance of all parents. Parents could select only one response to this question. Percentages might not sum to 100 due to rounding.                        9
Why do you plan to send your youngest school-age child to school in
person?
Only parents who responded yes to “Are you sending your youngest school-age child to school in person
this fall 2021?” (n = 2,801) answered this question.

Figure notes: The numbers in the shaded cells correspond to the percentage of parents who selected the response. Parents could select multiple response
options. Bold font indicates the percentage of a parent subgroup selecting a response is statistically different (p < 0.05) from the balance of parents’ responses.   10
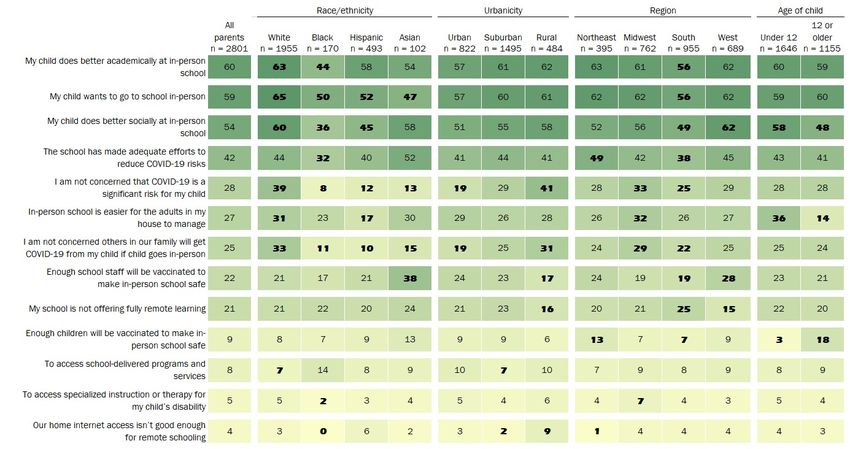
Why are you not sending (or unsure about sending) your youngest school-
age child to school in person in fall 2021?
Only parents who responded no or unsure to “Are you sending your youngest-school age child to school
in person this fall 2021?” (n = 315) answered this question.

Figure notes: The numbers in the shaded cells correspond to the percentage of parents who selected the response. Parents could select multiple response
options. Bold font indicates the percentage of a parent subgroup selecting a response is statistically different (p < 0.05) from the balance of parents’ responses.   11
If the pandemic were over and you had the choice, what would you
PREFER your youngest school-age child do this fall 2021?

Figure notes: An * indicates that the percentage of a given parent subgroup (e.g., urban, Midwest) who selected a response is statistically different (p < 0.05)
from the balance of all parents. Parents could select only one response to this question. Percentages might not sum to 100 due to rounding.                        12
What is your youngest school-age child’s biggest concern about returning
to school in-person? [Open response question]

Figure notes: The numbers in the shaded cells are percentage of parents that wrote in a response relating to each theme, which RAND then coded. Parents
could write in as many concerns as they wished. One percent or fewer of parents overall (and no more than 2 percent of any single parent subgroup) wrote in
concerns about the following list in descending order of frequency (categories not shown): bullying; missing the parent or home; not liking school; uncertain
lunch and snack routines; getting a good teacher; not enough recess; COVID-19 bullying including mask wearing when others aren’t or not being vaccinated
when others are; length of school day; school not being fun; following COVID-19 safety rules; and quality of learning. Bold font indicates the percentage of a
parent subgroup selecting a response is statistically different (p < 0.05) from the balance of parents’ responses.                                               13
Questions about parents’ preferred school safety
 measures to prevent the spread of COVID-19

                                                   14
Which of the following need to be in place for you to feel your youngest school-age child will be safe at school in person? Figure notes: The numbers in the shaded cells correspond to the percentage of parents who selected the response. Parents could select multiple response options. Bold font indicates the percentage of a parent subgroup selecting a response is statistically different (p < 0.05) from the balance of parents’ responses. 15
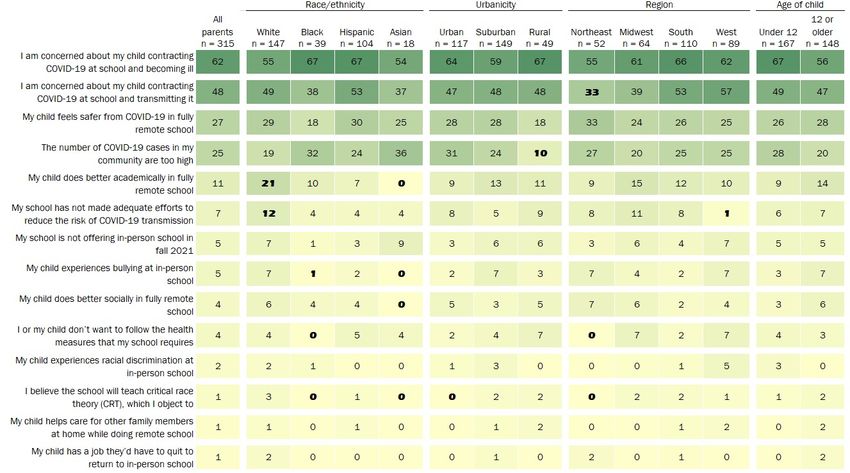
Which of the following need to be in place for you to feel your youngest
school-age child will be safe at school in person?
This graph includes only parents who were unsure if they would send their youngest child to school in-
person in fall 2021 (n = 254).

Figure notes: The numbers in the shaded cells correspond to the percentage of parents who selected the response. Parents could select multiple response
options. Bold font indicates the percentage of a parent subgroup selecting a response is statistically different (p < 0.05) from the balance of parents’ responses.   16
Do you know what specific COVID-19 safety measures (e.g., masking,
ventilation, social distancing, etc.) your youngest school-age child’s school
is enacting this fall 2021?

Figure notes: An * indicates that the percentage of a given parent subgroup (e.g., urban, Midwest) who selected a response is statistically different (p < 0.05)
from the balance of all parents. Parents could select only one response to this question. Percentages might not sum to 100 due to rounding.                        17
Do you wish to know more about what COVID-19 safety measures your
youngest school-age child’s school is enacting this fall 2021?

Figure notes: An * indicates that the percentage of a given parent subgroup (e.g., urban, Midwest) who selected a response is statistically different (p < 0.05)
from the balance of all parents. Parents could select only one response to this question. Percentages might not sum to 100 due to rounding.                        18
From which source do you most trust information about your youngest
school-age child’s school safety measures for COVID-19?

Figure notes: The numbers in the shaded cells correspond to the percentage of parents who selected the response. Parents could select multiple response
options, including an “other” option. RAND coded the “other” responses, but did not list them in the figure as each had one percent or fewer parents who wrote
them in. The most common “other” option not listed in the figure was the school board, family doctor, CDC, teacher’s union, and research the parent does
themselves. Bold font indicates the percentage of a parent subgroup selecting a response is statistically different (p < 0.05) from the balance of parents’
responses.                                                                                                                                                       19
Questions about COVID-19 testing of children at schools

                                                          20
If there was voluntary, free, weekly COVID-19 testing of students at your child(ren)’s school(s), would you support your children getting tested? [Comparison of May and July] Figure notes: An * indicates that the percentage of a given parent subgroup (e.g., urban, Midwest) who selected a response is statistically different (p < 0.05) from the balance of all parents at the same time point. Black bars represent 95% confidence intervals. When May and July confidence intervals for a parent subgroup do not overlap, parents’ responses in May are statistically different from July. Percentages might not sum to 100 due to rounding. 21
For which of the following reasons would you not support or are not sure if
you would support your child(ren) getting tested weekly for COVID-19?
Only parents who responded no or not sure to the question about voluntary, free, weekly COVID-19
testing (n = 1,509) answered this question.

Figure notes: The numbers in the shaded cells correspond to the percentage of parents who selected the response. Parents could select multiple response
options. Bold font indicates the percentage of a parent subgroup selecting a response is statistically different (p < 0.05) from the balance of parents’ responses.   22
If your child(ren) had COVID-19 symptoms, would you support getting
your child(ren) tested for COVID-19 at school?

Figure notes: An * indicates that the percentage of a given parent subgroup (e.g., urban, Midwest) who selected a response is statistically different (p < 0.05)
from the balance of all parents. Parents could select only one response to this question. Percentages might not sum to 100 due to rounding.                        23
How comfortable are you with your child(ren) taking the following kinds of
COVID-19 tests?

Figure notes: The numbers in the shaded cells correspond to the percentage of parents that are “comfortable” with the listed kind of COVID-19 test.
Respondents provided separate answers for each of the four listed kinds of COVID-19 tests. Bold font indicates the percentage of a parent subgroup selecting a
response is statistically different (p < 0.05) from the balance of parents’ responses.                                                                           24
Questions about COVID-19 vaccination

                                       25
“I will get my child(ren) vaccinated for COVID-19 when a vaccine is authorized and available for their age.” [1 of 2 slides; Comparison of May and July] Figure notes: An * indicates that the percentage of a given parent subgroup (e.g., urban, Midwest) who selected a response is statistically different (p < 0.05) from the balance of all parents at the same time point. Black bars represent 95% confidence intervals. When May and July confidence intervals for a parent subgroup do not overlap, parents’ responses in May are statistically different from July. Percentages might not sum to 100 due to rounding. 26
“I will get my child(ren) vaccinated for COVID-19 when a vaccine is
authorized and available for their age.” [2 of 2 slides; Comparison of May
and July]

Figure notes: An * indicates that the percentage of a given parent subgroup (e.g., urban, Midwest) who selected a response is statistically different (p < 0.05)
from the balance of all parents at the same time point. Black bars represent 95% confidence intervals. When May and July confidence intervals for a parent
subgroup do not overlap, parents’ responses in May are statistically different from July. Percentages might not sum to 100 due to rounding.                        27
Have your child(ren) who are age 12 and over gotten vaccinated for
COVID-19?
Only parents with children age 12 and over (n = 2,021) answered this question.

1 The undecided category includes three responses: (1) “Undecided; they or I want to wait a while to see how it’s working”, (2) “Some have, and some haven’t,”
and (3) “Not yet, but they are planning to.”
Figure notes: An * indicates that the percentage of a given parent subgroup (e.g., urban, Midwest) who selected a response is statistically different (p < 0.05)
from the balance of all parents. Parents could select only one response to this question. Percentages might not sum to 100 due to rounding.                        28
Have you personally received the COVID-19 vaccine?

Figure notes: An * indicates that the percentage of a given parent subgroup (e.g., urban, Midwest) who selected a response is statistically different (p < 0.05)
from the balance of all parents. Parents could select only one response to this question. Percentages might not sum to 100 due to rounding.                        29
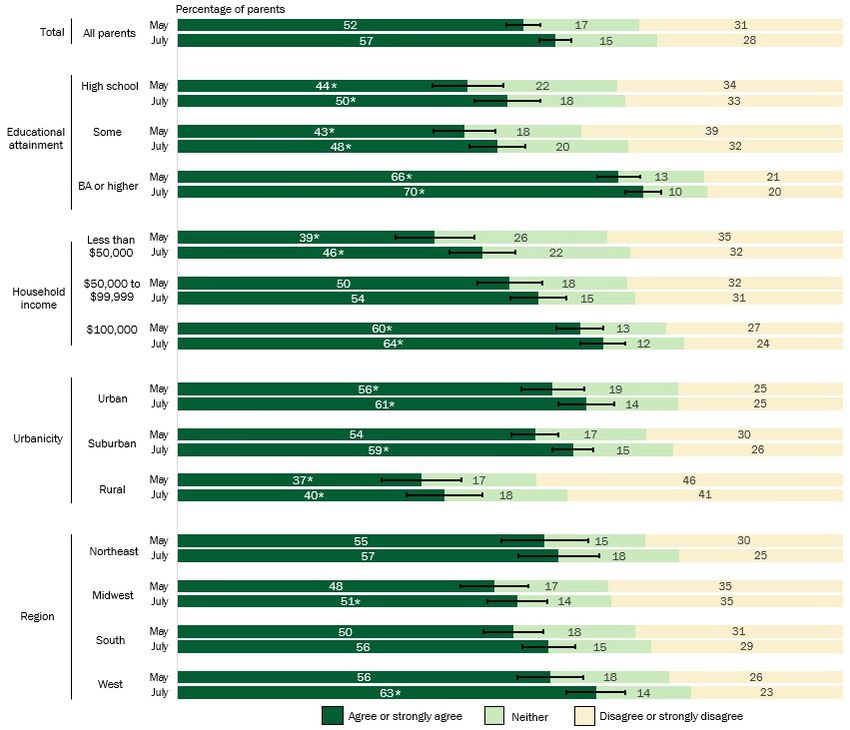
“Being offered a $25 gift card in fall 2021 would make me more likely to
allow my child(ren) to participate in voluntary, free, weekly COVID-19
testing at school.”

Figure notes: An * indicates that the percentage of a given parent subgroup (e.g., urban, Midwest) who selected a response is statistically different (p < 0.05)
from the balance of all parents. Parents could select only one response to this question. Percentages might not sum to 100 due to rounding.                        30
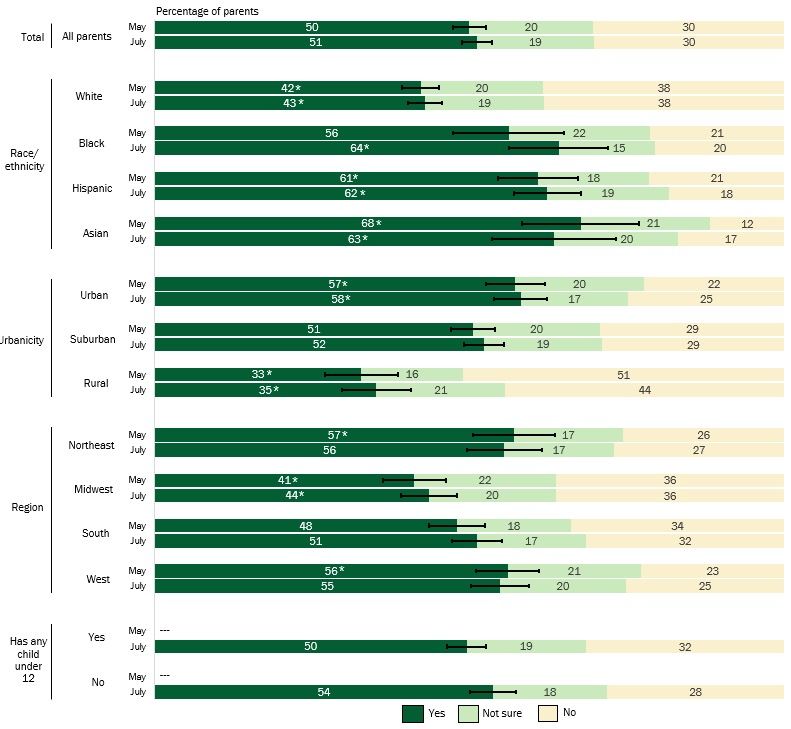
“I would support getting my child(ren) vaccinated at school for routine
vaccines such as polio, TdaP, and/or MMR if they lacked the
immunizations.”a

a The survey question went on to read: “(TdaP is the diphtheria and tetanus toxoids and acellular pertussis vaccine. MMR is the measles, mumps, and rubella
vaccine.)”
Figure notes: An * indicates that the percentage of a given parent subgroup (e.g., urban, Midwest) who selected a response is statistically different (p < 0.05)
from the balance of all parents. Parents could select only one response to this question. Percentages might not sum to 100 due to rounding.                        31
You can also read