Schools - 117_ - Infrastructure Report Card
←
→
Page content transcription
If your browser does not render page correctly, please read the page content below
Schools

                 117
                ________

2021 INFRASTRUCTURE REPORT CARD
     www.infrastructurereportcard.org
EXECUTIVE SUMMARY
                 School facilities represent the second largest sector of public infrastructure
                 spending, after highways, and yet there is no comprehensive national data
                 source on K-12 public school infrastructure. What data is available indicates
                 that 53% of public school districts report the need to update or replace
                 multiple building systems including HVAC systems. More than one-third of
                 public schools have portable buildings due to capacity constraints with 45%
                 of these portable buildings in poor or fair condition. Meanwhile, as a share of
                 the economy, state capital funding for schools was down 31% in fiscal year
                 2017 compared to 2008. That is the equivalent of a $20 billion cut. The best
                 estimates indicate a minimum of $38 billion annual funding gap for public
                 school facilities across the country. Meanwhile, public schools increasingly
                 serve a secondary function as emergency shelters and community resource
                 facilities during man-made or natural disasters, and facility upgrades are
                 needed to effectively fulfill this important community purpose.

CAPACITY & CONDITION
There are approximately 84,000 public schools with                       based on a wide variety of assumptions and definitions
nearly 100,000 buildings1 in the U.S. with a projected                   regarding both conditions and needs.
enrollment of 56.8 million by 2026.2 Every community
                                                                         School facilities represent the second largest sector of
across the U.S. has public school buildings and facilities.
                                                                         public infrastructure spending, after highways, and yet
They are used not only for learning, libraries, sports, and
                                                                         there is no comprehensive national data source on K-12
feeding children, but also for community meetings and
                                                                         public school infrastructure. The most comprehensive
as emergency centers and shelters. To provide a safe and
                                                                         data available is a National Center for Education Statis-
healthy environment that is conducive to learning for
                                                                         tics (NCES) survey for the 2012-2013 school year.4 The
children of all ages, school buildings need to be in good
                                                                         U.S. General Accountability Office (GAO) issued a lim-
condition and provide adequate spaces, natural light,
                                                                         ited, one-time survey of school districts in 2020, which
working heating and air conditioning, clean water, and
                                                                         found that 53% of public school districts needed to up-
modern technology to fulfill a host of other functions.
                                                                         date or replace multiple building systems, reinforcing
A 2015 Congressional Research Service report3 con-                       the findings of the NCES report that found that 53% of
cluded that national data on the condition of school                     public schools needed to spend money on repairs, reno-
infrastructure and the investment needs are extremely                    vations, and modernizations to bring the infrastructure
limited and outdated, and comprehensive findings re-                     into good overall condition.5 Nearly 41% reported issues
main elusive. There is no consistent federal data collec-                with HVAC systems, a significant concern for facilities
tion process to aggregate information on the condition                   where children routinely spend eight hours a day.
of schools. Furthermore, the data that is collected is

                                                               118
                                                              ________

                                            2021 INFRASTRUCTURE REPORT CARD
                                                 www.infrastructurereportcard.org
The NCES report, while older, was more comprehensive overall building conditions were rated as fair or poor.
and found that 24% of overall building conditions were Additionally, outdoor features were rated as fair or poor,
rated as fair or poor, while 14% to 32% of systems and including school parking lots and roadways; fencing; bus
features within these permanent buildings were rated in lanes and drop-off areas; outdoor athletic facilities; and
fair or poor condition. Among the 31% of public school outdoor play areas/playgrounds.
systems with portable (temporary) buildings, 45% of
OPERATION & MAINTENANCE
State and local governments face a constant challenge to ity to classrooms with outdoor classrooms, temporary
keep pace with operations and maintenance and the need buildings, or leasing new space, all with limited budgets.
for new school construction, in addition to accommodat-
The GAO estimates that while 65% of school districts
ing improved health and safety standards, stronger acces-
have assessed their facilities within the past 10 years (86%
sibility requirements, and new technology. Great strides
of those do so yearly), 16% of districts have not done so
have been made in infusing technology into schools and
within the past 10 years. Planning is often lacking, as four
into the instructional process. Some school districts have
in 10 public schools do not have a long-term facility plan
invested heavily in the infrastructure required to accom-
in place to address operations and maintenance. Better
modate technology. As the COVID-19 pandemic illus-
planning through life-cycle cost analysis will lead to a bet-
trated, investments in technology are critical to ensure
ter allocation of resources. Such analysis should review
continued learning, yet despite progress, many school dis-
costs associated with planning, funding, design, construc-
tricts have not been able to keep pace. Meanwhile, school
tion, operation, maintenance, and decommissioning.
districts need to upgrade HVAC systems and add capac-
Percent
Among of building
public schools withsystems and features
permanent inthe
buildings, fairbuilding
and poorsystems/features
condition
were rated as being in fair or poor condition in their permanent buildings
in public schools with all permanent buildings
in 14% to 32% of the schools:
32% 30%
31% 29%
each
each
25%
each
22%
21% 19%
each
18%
14%
Windows Plumbing/ Heating Energy Roof, interior Electrical Technology Interior Exterior Framing,
lavatories system, air management finishes/ system infrastruc- lighting walls/ floors, and
conditioning system, trim, internal ture and life finishes foundations
system, security communica- safety
ventilation/ system, tion system features
filtration exterior
system lighting
U.S. Department of Education, National Center for Education Statistics, Institute of Education Sciences, “Condition of America’s Public School Facilities: 2012
–13,” NCES 2014-022, March 2014.
119
________
2021 INFRASTRUCTURE REPORT CARD
www.infrastructurereportcard.orgFUNDING & FUTURE NEED
An estimated 55% of districts use local revenues as their Between 1994 and 2013, school systems spent $973
primary source of funding for school facilities, compared billion for new school construction and capital projects
to 36% that rely mainly on state funds. The most com- to improve existing infrastructure. This spending totaled
mon source of local funding is property taxes, which $49 billion annually. However, to provide healthy and
are used in 77% of school districts. Other local funding safe 21st century learning environments, it is estimated
comes from grants, bonding, other taxes, and public-pri- that the nation should be spending $87 billion per year
vate partnerships. on capital needs.7 This leaves an additional $38 billion per
year that is required to regularly upgrade existing facilities’
The Center on Budget and Policy Priorities reports that as a
systems, components, fixtures, equipment, and finishes as
share of the economy, state capital funding for schools was
they reach the end of their anticipated life expectancy;
down 31% in fiscal year 2017 compared to 2008.6 That’s
systematically reduce the backlog of deferred mainte-
the equivalent of a $20 billion cut. Thirty-eight states cut
nance that has accumulated; and alter existing facilities to
school capital spending as a share of the state economy
respond to changing educational requirements.8
over the 2008-2017 period, in many cases drastically.
The number Every school day,
of students nearly
Those who
nationwide
are enrolled 50 million
enrolled in K-12 students and
school was make up
24.7% six million
76.4 million a dults occupy close
in 2017 of the
to 100,000
(pre-school — population public school
college), not age buildings on an
statistically three and older. estimated
different from the
level in 2016.
(U.S. Census)9
2 million acres
of land. (NCES)
(U.S. Census)
Enrollment is
The student projected to
population
increased by nearly increase by 3%
between the 2013-
5 million 2014 and 2025-26
between 1994 and academic years —
2013, requiring an rising from
additional
13,000 50 million to
K-12 51.4 million
schools. students.
(NCES)11
(NCSF)10
120
________
2021 INFRASTRUCTURE REPORT CARD
www.infrastructurereportcard.orgAlmost all schools (99%)
have some permanent
buildings.
31% have additional
portable (temporary)
buildings.
The overall condition
of schools with only
permanent buildings was
excellent in 20%, good in 56%,
fair in 21%, and poor in 3%.
Among schools with
portable buildings, overall
condition was excellent in
6%, good in 49%, fair in 36%,
and poor in 9%.
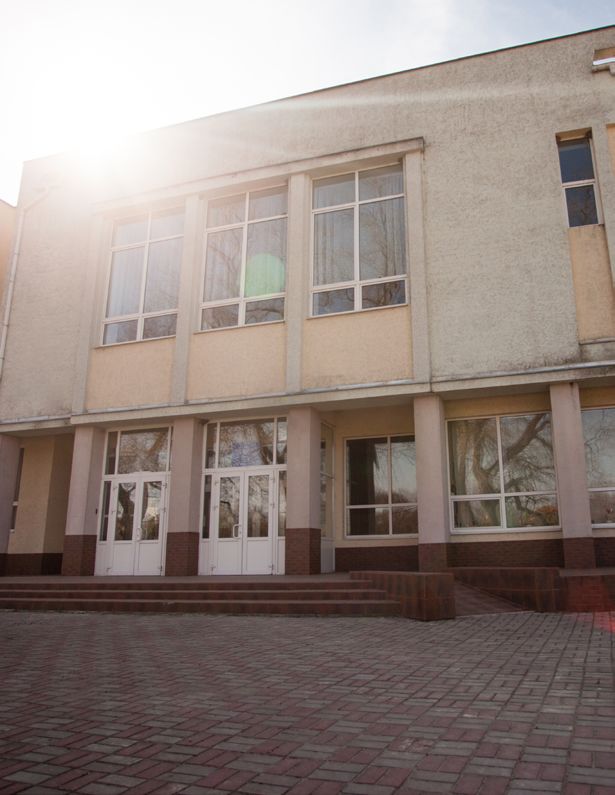
Photo by Kevin Longley
A TEMPORARY SCHOOL BUILDING IN MARYLAND.
Though the current school infrastructure funding gap is higher due to school systems’ loss of income during the
nearly $40 billion annually, the true cost is undoubtedly 2020 pandemic and its impact on tax revenues.12
PUBLIC SAFETY AND RESILIENCE
To provide a safe and effective learning environment for
the nation’s K-12 students, public schools need to be in
good condition.
Public schools often serve a secondary function as emer-
gency shelters and community resource facilities during
man-made or natural disasters. This critical function has
a significant role in public health, safety, and welfare, and
requires facilities to be maintained to function in emer-
gencies and help communities recover quickly. Schools
require upgrades to effectively fulfill this important com-
munity purpose, including windows that can withstand
high winds, structures designed to survive earthquakes, Photo courtesy of Brian Pallasch
and rooms specifically designed as shelters from tornados.
SCHOOL CONSTRUCTION IN NORTH CAROLINA
121
________
2021 INFRASTRUCTURE REPORT CARD
www.infrastructurereportcard.orgRECOMMENDATIONS
TO RAISE THE GRADE
· All schools (new and existing) should be designed to withstand seismic, wind, and
Schools flood events. State and local governments must support the widespread adoption
and enforcement of modern building and infrastructure codes, such as ASCE 7: Min-
imum Design Loads and Associated Criteria for Buildings and Other Structures. ASCE
7 describes the means for determining flood, tsunami, snow, rain, atmospheric ice,
earthquake, wind, and other loads and their combinations for general structural de-
sign. ASCE 7 is continuously updated to reflect our changing world and to make
infrastructure more resilient in the face of new challenges.
· The U.S. Department of Education should coordinate with state agencies and local
school districts to obtain and publish nationwide statistics on school infrastructure
at regular intervals.
· School districts should focus on Life-Cycle Cost Analysis (LCCA) principles in the
planning and design processes to evaluate the total cost of projects.
· Design new campuses for the lowest net present value cost that includes life-
cycle O&M in addition to capital construction.
· Implement building condition assessment of existing school infrastructure.
· Budget for the total cost of ownership and train facilities staff to implement
these policies.
· School districts should develop capital planning frameworks that can be nimble and
responsive to changing technologies and demographics, in order to optimize learn-
ing environments and consider the holistic needs of the community.
· Continue to encourage school districts to adopt regular, comprehensive ma-
jor maintenance, renewal, and construction programs, and implement preventive
maintenance programs to extend the life of school facilities.
· Explore alternative financing for public school facilities, including lease financing, as
well as ownership and use arrangements, to facilitate school construction projects.
122
________
2021 INFRASTRUCTURE REPORT CARD
www.infrastructurereportcard.orgSOURCES
1. 21st Century School Fund Inc., U.S. Green Building Council Inc., and the National
Council on School Facilities, “State of Our Schools: America’s K-12 Facilities,”
2016.
Schools
2. Institute of Education Sciences, National Center for Education Statistics,
“Projections of Education Statistics to 2026.” April 2018.
3. Congressional Research Service, “School Construction and Renovation: A Review
of Federal Programs and Legislation,” updated August 31, 2020.
4. U.S. Department of Education, National Center for Education Statistics, Institute
of Education Sciences, “Condition of America’s Public School Facilities: 2012–13,”
NCES 2014-022, March 2014.
5. “ K-12 Education: School Districts Frequently Identified Multiple Building
Systems Needing Updates or Replacement,” file:///G:/GRA/Word/Report%20
Card/2021%20Report%20Card/Categories/Schools/GAO%20Report%20
June%202020.pdf GOA-20-949, June 2020.
6. Center on Budget and Policy Priorities, “School Infrastructure Needs a Funding
Infusion.” April 17, 2018.
7. 21st Century School Fund Inc., U.S. Green Building Council Inc., and the
National Council on School Facilities, “State of Our Schools: America’s K-12
Facilities,” 2016.
8. 21st Century School Fund Inc., U.S. Green Building Council Inc., and the
National Council on School Facilities, “State of Our Schools: America’s K-12
Facilities,” 2016.
9. U.S. Census Bureau “More Than 76 Million Students Enrolled in U.S. Schools,
Census Bureau Reports,” 2018.
10. 21st Century School Fund Inc., U.S. Green Building Council Inc., and the
National Council on School Facilities, “State of Our Schools: America’s K-12
Facilities,” 2016.
11. U.S. Department of Education, National Center for Education Statistics,
Institute of Education Sciences, “Condition of America’s Public School Facilities:
2012 –13,” NCES 2014-022, March 2014.
12. U.S. Department of Education, National Center for Education Statistics,
Institute of Education Sciences, “Condition of America’s Public School Facilities:
2012 –13,” NCES 2014-022, March 2014.
123
________
2021 INFRASTRUCTURE REPORT CARD
www.infrastructurereportcard.orgYou can also read