YOUTH EMPLOYMENT IN NIAGARA: MAPPING THE OPPORTUNITIES - Brock University

Page created by June Mclaughlin
 
CONTINUE READING
YOUTH EMPLOYMENT IN NIAGARA: MAPPING THE OPPORTUNITIES - Brock University
Niagara Community Observatory

     YOUTH EMPLOYMENT IN NIAGARA: MAPPING THE OPPORTUNITIES
                                                                                               Policy Brief #28, October 2017
                                                                         By Charles Conteh, Carol Phillips, and Nicole Ferguson

The disruptive forces of global economic restructuring over the                  WHY IS THIS A PROBLEM?
past three decades mean that local communities have become                       An aging population has become of great policy concern as
increasingly vulnerable. The regions that successfully combat                    more people leave the workforce due to retirement than those
the threats and exploit the opportunities of these forces are                    entering the workforce to replace them. Economists fear that
those that can leverage their tangible and intangible economic                   not only would this stunt economic growth, but would put
and social assets to reinvent themselves. The true wealth of a                   pressure on the tax system as insufficient revenue would be
region is no longer measured only by the stock of tangible assets                generated to support the growing need for services.
but increasingly, by the pool of its human assets in the
knowledge-driven economy of the 21st century. A core element                     The Canadian population is aging, much like Niagara, due to a
of those human assets is the skills and talents of its young people.             low birth rate coupled with a low mortality rate (i.e. fewer
How a region cultivates and engages the skills and talents of                    babies are being born while more people are living longer). In
the younger members of its population is one of the clearest                     this scenario, Canada’s natural rate of population growth is
indicators of its socioeconomic destiny in a rapidly changing                    expected to decline steadily over approximately the next 20
world. This policy brief is an attempt to explore the nature,                    years (Fields 2014). Immigration is now considered a key
challenges and prospects of youth employment in Niagara.                         component to population growth. On a local level, this is
                                                                                 expressed as a desire for positive net-migration – that is, more
Canada has an aging population with more seniors than children                   people moving into the area from other cities and provinces, as
and the characteristic is more acute in Niagara, according to the                well as other countries, than are leaving.
2016 Census. The concern at all three levels of government is
that this phenomenon will have a negative effect on economic                     THE AIM OF OUR POLICY DISCUSSION
growth and put pressure on a tax system with insufficient rev-                   This policy brief is premised on the importance of jobs for youth
enues generated to support a growing need for services as more                   within local economic growth and job creation strategies. With
people leave the workforce than are entering it . According to                   that focus, we have set out to use the empirical data from our
this narrative, a younger skilled workforce helps attract employ-                recent Binational Prosperity Initiative (BPI) to illustrate the
ers to the region and fuels the economy. This robust workforce                   current local employment landscape. While this data does not
supports a community with the tax revenues it generates to                       allow us to fully analyze strengths and weaknesses of the labour
fund services and amenities, and the quality of those services is                market3, we can begin to investigate what employment
indicative of the quality of life for the residents. The economy                 opportunities exist for young people in Niagara.
stagnates and quality of life worsens if there are not enough
workers to continue this cycle.                                                  The emergence of this policy brief is two-fold. First, it is a
                                                                                 progression from our January 2017 demographic study Growing
Niagara Region has recognized this pattern in its 2015 Strategic                 Niagara which took a closer look at the region’s aging population
Priorities Implementation Plan, which seeks to improve                           as seniors begin to outnumber children, and its difficulty in
economic prosperity. One of its initiatives aims to attract and                  keeping residents in the 30-44-year age cohort.
retain youth as one means to grow the population. One of the
keys to this plan is improving job prospects for its youth.                      2
                                                                                   The BPI is a joint research undertaking involving the NCO and the
                                                                                 University at Buffalo School of Architecture and Planning to explore
                                                                                 cross-border economic opportunities for cooperation.
1
For a fuller discussion of this issue, please see the NCO’s Policy Brief #26     3
                                                                                   Statistics Canada will be releasing 2016 Census data on education, labour,
Growing Niagara: A closer look at Niagara’s aging population, Jan. 2017, by      workflow, and mobility/migration on Nov. 29, which is after the publica-
Carol Phillips and Adam Durrant. See also Fields (2014), Canada (2012) and       tion of this introductory brief. Our aim is to use this brief as a starting point
Conference Board of Canada (2006).                                               for a deeper analysis once all Census data is available.
YOUTH EMPLOYMENT IN NIAGARA: MAPPING THE OPPORTUNITIES - Brock University
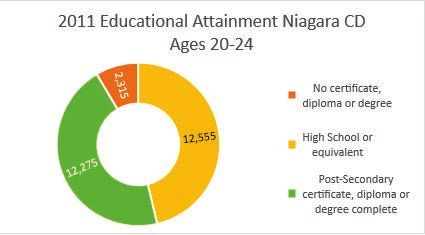
Second, it uses primary research conducted by the NCO in                         concern was that these negative impacts would “hinder timely
partnership with the University at Buffalo School of Architecture                transition from school to work” and that such impediments into
and Planning originally used to determine industry sectors ripe                  entering the workforce may have long-term effects on an
for binational collaboration to create jobs and grow the                         individual’s well-being (Marshall 2012).
economies on both sides of the border.
                                                                                 The federal government Youth Employment Strategy (YES),
The BPI amassed a database of more than 98,000 businesses                        targeting those aged 15 to 30 years, was launched in 1997 with
across five sectors in the Buffalo-Niagara-Hamilton economic                     an annual budget of $330 million and the goal of helping youth
region: advanced manufacturing, agribusiness, culture and                        transition to the workplace. In the past year, it has received a
tourism, goods transportation and warehousing, and life                          budgetary boost of several hundred million dollars to create
sciences. More than 35,000 of those businesses were based in                     more summer jobs and on-the-job skills training.
Niagara.
                                                                                 In 2014 the House of Commons Standing Committee on
Although this information is useful for all age cohorts, we will                 Finance conducted hearings to investigate ways to “improve
be analyzing the numbers from a youth perspective to support                     youth employment outcomes”. After hearing from 38 groups
ongoing local government policy goals of youth retention and                     and individuals, it reported a need for greater high school
attraction. After a brief portrait of our 15-29-year-old population,             education in advanced technology and specialized skills, and
we will review asset maps created to illustrate the density in                   more students needed in the sciences, maths, technologies and
Niagara of five industry sectors as well as employment trends.                   trades.
We aim to describe where these businesses are located in the
region to identify clustering, and how demographic and transit                   In 2016, a federal “Expert Panel on Youth Employment”
patterns line up with the geographic location of these sectors.                  convened to investigate “Why has youth unemployment always
                                                                                 been higher than the general population?” Its final report
ON YOUTH EMPLOYMENT – THE ISSUES                                                 concluded there were several barriers specific to youth employ-
While Niagara’s overall population grew 3.8 per cent from 2011                   ment, including lack of labour market and youth employment
to 2016, the region’s proportion of youth (age 15-29) fell to 17.6               data, attitudes towards young people and discrimination,
per cent. That’s down from 18.3 per cent in 2011. This is consis-                precarious work, training gaps, and a lack of resources for
tent with the ongoing narrative that Niagara is getting older                    Indigenous youth. Its final recommendations include improving
and that local policy initiatives, such as job creation, are needed              the YES program to make it easier for employers to access,
to both retain and attract young people to the region. The                       establishing federal government youth hiring targets (especially
unemployment rate for those aged 15-29 in the St. Catharines-                    in rural and remote areas), updating labour standards,
Niagara CMA was 9.7 per cent in 2016 with a labour force                         broadening employment insurance eligibility, and devolving
participation rate of 78.9 per cent. Unemployment for the general                youth programs to the provinces. (Canada 2017).
population (15 and over) was 7.1 per cent with a labour force
participation rate of 63.3 per cent (Statistics Canada 2017).                    On a global scale, the International Labour Organization has
                                                                                 also made similar conclusions regarding the lasting effects of
The importance of youth employment is recognized in national                     youth unemployment. Its 2015 report Global Employment
and global forums, particularly since the economic downturn                      Trends for Youth states the importance of focusing policy efforts
of 2008 and the slower recovery of youth unemployment rates.                     on youth employment, as “It matters for economic growth,
A 2012 Statistics Canada report determined that the percentage                   health, civil unrest, demographics, environmental sustainability,
of 15- to 29-years-olds in Canada that had been neither enrolled                 and certainly personal levels of happiness and life satisfaction
in education nor employed (NEET) hovered between 12 and 14                       (ILO 2015).” It suggests investment in education and training
per cent in the previous 10 years. That was lower than the aver-                 programs, “yet the most effective strategies are those which
age among G7 countries. Still, the report determined that the                    acknowledge that such targeted interventions must go hand in
economic downturn had a disproportionate effect on youth                         hand with an integrated strategy for growth and job creation.”
unemployment rates, job stability, and declining job quality. The
                                                                                 To conclude, youth employment is a concern across all levels of
                                                                                 governance. This coincides with two issues: 1. that unemployment
4
  Those over the age of 65 (seniors) make up 21.4 per cent of Niagara’s          rates for young people remain noticeably higher than the
population, compared to 14.9 per cent in the under-14 cohort (children).
The NCO’s January 2017 policy brief Growing Niagara, which summarized            general population and have been slower to recover since the
Niagara’s population characteristics, found that the region tends to begin       economic downturn of 2008, and that 2. there will soon be a
losing its population to out-migration in the 30-44 age cohort and the           shortage of skilled workers as Canada’s baby boomers age into
0-14 age cohort is also relatively low, suggesting residents over 30 are
leaving for better employment and taking their children with them.
                                                                                 5
Numbers in the 15-29 cohort may also be skewed by the growth of                   A March 26, 2017 press release from Employment and Social
population at post-secondary institutions Brock University and Niagara           Development Canada announced an additional $395.5 million over the
College.                                                                         next three years to the YES program.
                                                                             2
retirement and there aren’t enough younger people to take their                                Niagara                 Ontario  downturn of
places (Canada 2012, Conference Board of Canada 2006).                                       pop. 447,888          pop. 13,448,494
                                                                                                                                2008      hit
                                                                             15-19 years     25,715                811,675      youth harder
                                                                             20-24 years     28,155                894,390
These two observations seem contradictory at first glance - that             25-29 years     25,130                874,350
                                                                                                                                than other
surely once boomers move out of the workforce there will no                  Proportion 2016 17.6 %                19.2 %       age groups
longer be a youth employment problem. However, former                        Proportion 2011 18.3 %                19.7 %       and it has
Statistics Canada chief economist Philip Cross argues that the            Table 1: Statistics Canada 2016 Census of Population, taken them
                                                                          Focus on Geography Series; 2011 Census of Population
true challenge comes in achieving “labour market efficiency”                                                                    longer to re-
(Cross 2015). Does the labour supply match the demand? Does              turn to pre-recession levels (ILO 2015, Cross 2014, TD Econom-
the labour force have the proper education and skills? Are the           ics 2014, Marshall 2012).
right people in the right place for employment? This policy
brief, with its asset maps and demographic analysis, is merely           Youth unemployment in Canada (defined by Statistics Canada
the first step in answering those questions, as we have set out          as ages 15-24) sits at 13.1 per cent for 2016 – an improvement
to describe the current situation in Niagara. Our aim to is to use       from 2009 when it peaked at 15.3 per cent, but still above a
this information to set a path for further research that would           pre-recession low of 11.2 per cent in 2007. In comparison, the
answer those questions.                                                  unemployment rate for Ontario youth was 14.0 per cent in
                                                                         2016, down from a high of 17.5 per cent in 2009, but still above
OUR DEFINITION                                                           the pre-recession rate of 12.9 per cent (Statistics Canada 2017).
We define youth as between the ages of 15 and 29. This is
the broadest range generally accepted in the literature,                 However, youth in the St. Catharines-Niagara CMA are an anomaly.
which tends to hover from either 15-24 to 15-29 depending                Our custom tabulation shows 15-24-year-olds have a 2016
on the study.                                                            unemployment rate of 8.5 per cent, which is better than its
                                                                         pre-recession level of 11.7 per cent in 2007 and a formidable drop from
However, logistical problems occur with our data gathering as            its 2010 peak of 18.4 per cent. The reason for this anomaly is beyond
some employment numbers are broken down into the 15-24                   the scope of this research, but we can note that this region’s abundance
group, but not usually the 25-29 group (this older group is often        of jobs in tourism’s food-service and accommodation sector – a strong
lumped in with older cohorts). Also, some data (such as                  employer of youth – may have helped. Another indicator of this, is that
employment numbers) is only available at the level of the St.            the youth labour force participation rate for St. Catharines-Niagara
Catharines-Niagara Census Metropolitan Area, which does not              CMA is 73.2 per cent, well above Canada’s youth rate of 63.7 per cent.
include Grimsby or West Lincoln. Where possible, we have tried           The numbers for the full CMA 15-29 cohort in 2016 are a 9.7 per cent
to use numbers available at the Niagara Census Division level,           unemployment rate and a 78.1 per cent participation rate, respectively.
which includes the entire Regional Municipality of Niagara. Also,        (Statistics Canada 2017).
where possible, we have tried to use numbers for the entire 15-
29 group. We seek to answer some basic questions within this
cohort. What is their educational attainment to prepare them
for the labour force? What is their participation rate and where
are they working? What jobs are out there that might keep
them in the region for the long haul?

A PORTRAIT OF NIAGARA’S YOUTH
Niagara’s percentage of youth in its population is dropping. As
of the 2016 Census, the 15-29-year age cohort now makes up
17.6 per cent of Niagara’s population, down from 18.3 per cent
                                                                         7
                                                                           Cross’s concern for youth employment is based on his own observations:
in 2011. Table 1 breaks it down in more detail. Our goal in the          that the higher unemployment rate accompanies a shift from college
following section is to provide an understanding of youth labour         education to university education (leading him to wonder if youth are
force characteristics in this region so that decision-makers             getting the proper skills) and that the 15-24 age group seems to be averse
                                                                         to interprovincial migration (moving to where there are jobs).
within the local economy have a clearer picture of this emerging
                                                                         8
asset.                                                                     On a side note, there is also discussion in the literature about the negative
                                                                         effect teenagers have on the overall youth employment numbers. Both
                                                                         Cross and a 2014 report from TD Economics state that the problem of youth
What do we know about Niagara’s youth?                                   employment is not as bad as the numbers suggest. The 15-19 age cohort,
In a span of the past 10 years, the highest level of unemploy-           they argue, negatively distorts the numbers. Cross argues that 15-year-olds
                                                                         should be taken out of the equation altogether, to follow the U.S. example,
ment across all age groups came right after the recession and            as this age group is typically still in school, living at home, and doesn’t drive.
has been gradually falling ever since. However, the economic             9
                                                                          All numbers used when discussing the proportion of youth in Niagara must
                                                                         come with a footnote that the community is home to a college and
                                                                         university, which would artificially boost those numbers with a highly
6
    We acknowledge that this holds true for all age groups.              nomadic demographic.
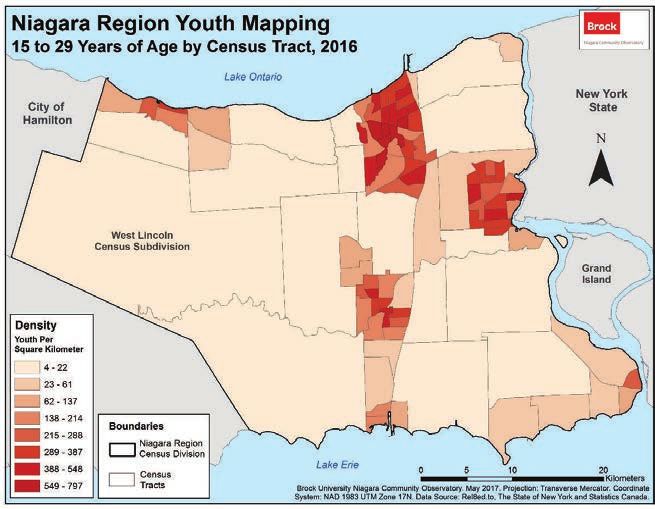
                                                                     3
Niagara’s youth are primarily concentrated
                                                                                                               in the region’s three major urban centres of
                                                                                                               St. Catharines, Welland, and Niagara Falls.
                                                                                                               However, there are denser pockets of young
                                                                                                               people located in the outer areas of the re-
                                                                                                               gion, specifically in Port Colborne, Fort Erie,
                                                                                                               and the growing communities of Grimsby
                                                                                                               and Lincoln. As we will see later in this brief,
                                                                                                               this does have repercussions for transit ac-
                                                                                                               cessibility, and the employment accessibility
                                                                                                               that ensues.

Niagara vs Ontario: Percentage of Total Population
Aged 15 and Older (2011)
 Highest Educational Attainment                            Niagara %      Ontario %                 EDUCATIONAL ATTAINMENT
 No certificate, diploma or degree                         20.4           18.7                      Table 2 demonstrates Niagara’s education levels as compared
 High school or equivalent                                 30.2           26.7
                                                                                                    to Ontario. While the region has a greater proportion of
 Apprenticeship or trades cert/dipl                        9.5            7.4
 College, CEGEP, Non univ cert/dipl                        22.2           19.8                      residents with at least a high school, college, or
 University certificate below bachelor                     3              4.1                       apprenticeship/trades education, Niagara falls behind the
 University Bachelor’s degree                              9.1            14.5                      province in the proportion of its population with a university
 University certificate, diploma or degree                 5.6            8.9                       degree or above.
 above Bachelor’s (incl. Master’s, Doctorate,
 degree in medicine, dentistry, optometry,
 veterinary medicine
  Table 2: Statistics Canada - 2011 National Household Survey. Catalogue Number
  99-010-X2011048

                                                                                                    The 20-24-year age cohort represents the primary
                                                                                                    post-secondary years and the age at which youth typically
                                                                                                    begin transition into full-time labour-force participation. The
                                                                                                    2011 Census shows us that only 8.5 per cent (2,315 youths)
                                                                                                    of that cohort in Niagara region still needs to complete their
                                                                                                    high school education. Meanwhile, 45 per cent of that cohort
                                                                                                    (12,275 youths) has already completed some form of post-
                                                                                                    secondary certificate, diploma, or degree. Note that those
                                                                                                    with high school or equivalent includes those still in the
                                                                                                    middle of their post-secondary education.
        Figure 1: Statistics Canada, National Household Survey 2011, Catalogue No. 99-004-XWE

10
   Updated education data from the 2016 Census will not be available until Nov. 29, past our publication date. However, we will be publishing a second study
on youth employment in the new year, using all current Census data.

                                                                                                4
Post-Secondary Fields of Study 2011
                                         Post-Secondary Certifications Niagara CD Age 20-24

                                                           Total                                                                12,270
                                          Health & related fields                   1,960
                         Business, Management & Public Admin                        1,895
               Architecture, Engineering & related technologies                    1,835
                 Personal, Protective & Transportation Services                   1,570
                              Social/Behavioural Science & Law                    1,540
                                                     Humanities                990
                Visual & Performing Arts, Communications Tech                 700
                                                      Education               585
                          Physical/Life Sciences & Technologies              495
                 Agriculture, Natural Resources & Conservation               435
               Mathematics, Computer & Information Sciences                 260
                                                                    0          2000     4000        6000    8000     10000 12000 14000

                                                          Youth with completed certification

             Figure Ϯ: Statistics Canada - 2011 National Household Survey. Catalogue Number 99-010-X2011048

                       percent
             Some 16 per    centofofthose
                                      those aged
                                          aged    20-24
                                                20-24    years
                                                       years     with
                                                              with     a post-secondary
                                                                   a post-secondary        certificate,
                                                                                      certificate, diplomadiploma  or degree,
                                                                                                             or degree,
             earned it in the “health  and related” fields. Meanwhile,   only two  per cent  of them  received
             earned it in the “health and related” fields. Meanwhile, only two per cent of them received        their   their
             education
             educationcredentials
                          credentialsinin
                                        “math, computer,
                                          “math,  computer, and and
                                                                information   sciences”
                                                                     information        (Statistics
                                                                                   sciences”        CanadaCanada
                                                                                                (Statistics  2011). 2011).

                                                     2011 Employment in Niagara CD Age 20-24
                               Accommodation & Food Services                                                                                          4,460
                                                      Retail Trade                                                                          3,855
               Admin & Support, Waste Mngment & Remediation                                                1,525
                                                     Construction                                         1,480
                               Arts, Entertainment & Recreation                                       1,250
                                 Health Care & Social Assistance                                     1,230
                                                   Manufacturing                                    1,160
                                                   Other Services                                  1,105
                                                Education Services                                1,025
                                            Public Administration                       745
                     Professional, Scientific & Technical Services                     685
                                                  Wholesale Trade                    535
                         Agriculture, Forestry, Fishing & Hunting                   510
                                  Transportation & Warehousing                     415
                                              Finance & Insurance                 345
                               Information & Cultural Industries                265
                                    Real Estate, Rental & Leasing               240
                                                          Utilities           115
                                                                        0         500       1000     1500     2000    2500   3000   3500   4000     4500   5000

                                                                      Total Youth Employed by Industry (20,970)

             Figure ϯ: Statistics Canada - 2011 National Household Survey. Catalogue Number 99-010-X2011048

Within the 20-24-year-old group across all levels of education,                                        educational attainment are released in late November 2017.
the 2011 Census tells us in which industry they are working.
                                                                                                       What is noteworthy in these two lists is the juxtaposition
Accommodation/food services and retail trade employs 39.7                                              between the top fields of study for this age group, and where
per cent working in this age group in Niagara, or two of every                                         they are working. If young people cannot find employment in
five employed aged 20-24 (Statistics Canada 2011) and is in                                            their areas of interest or training, it should not be surprising
keeping with the findings of the 2016 Interim Report of the                                            they search outside the region. The reasons for the disconnect
federal government’s Expert Panel on Youth Employment                                                  between the lists is worthy of further study.
(p. 24). Both sectors are dominated by part-time work,
low-wage work and can be seasonal. These numbers should be
revisited when the updated 2016 Census numbers in

                                                                                              5
¯
WHERE ARE THE JOBS? - MAPPING OUR REGION 11                                                                                                                               Niagara Region Asset Mapping
After having identified the post-secondary credentials and employ-                                                                                                        Agribusiness Asset Density
                                                                                                                                                                                                                                            St. Catharines
                                                                                                                                                                                                                     Lake Ontario
ment taken by those aged 20-24, we now turn toward the fu-                                                                                                                                                                                                              Niagara-on-the-Lake                        New York
                                                                                                                                                                            City of
ture. We want to compare this contemporary situation with                                                                                                                  Hamilton
                                                                                                                                                                                                 Grimsby
                                                                                                                                                                                                                                                                                                                     State

industries identified by the Binational Prosperity Initiative as crucial                                                                                                                                                  Lincoln

to a binational economy.
                                                                                                                                                                                                                                                            Thorold
                                                                                                                                                                                              West Lincoln

Our Niagara asset maps created through the BPI provide visual                                                                                                                                                                            Pelham
                                                                                                                                                                                                                                                                                         Niagara                     Grand
                                                                                                                                                                                                                                                                                          Falls                      Island
evidence of where firms in the five selected industry groupings
                                                                                                                                                                                                                                                             Welland

are in this region. These “hot spots” on the map represent the                                                                                                               Haldimand
                                                                                                                                                                              County

numbers of firms in an area. We have also provided employment                                                                                                                                                                Wainfleet                                                                  Fort Erie

numbers for the Niagara region within these groupings via EMSI                                                                                                            Density
                                                                                                                                                                          Assets Per
                                                                                                                                                                                             Asset Count: 1,461
                                                                                                                                                                                                                                                                Port Colborne

                                                                                                                                                                          Square Kilometer

Analyst to identify where there appears to be job growth versus                                                                                                                  4
                                                                                                                                                                                             Boundaries
                                                                                                                                                                                                   Niagara Region
                                                                                                                                                                                                   Census Division
stagnation or decline over the past five years.                                                                                                                                                    Census                            Lake Erie                          0            5           10                        20
                                                                                                                                                                                                                                                                                                                            Kilometers
                                                                                                                                                                                 0                 Subdivisions                            Niagara Community Observatory. April 2017. Projection: Transverse Mercator. Coordinate System:
                                                                                                                                                                                                                                           NAD 1983 UTM Zone 17N. Data Source: Rel8ed.to, The State of New York and Statistics Canada.

The information can be used to help policy makers view
industry clustering in the region so that they may make more                                                                                                                                                             AGRIBUSINESS
                                                                                                                                                                                                                          Job Numbers*
informed decisions on matters such as infrastructure and public
transit. The information is also presented in the spirit of the                                                                                                           2010                                                2016                                                                                  2021
                                                                                                                                                                          3,650                                               3,273                                                                                 3,021
ILO’s Global Employment Trends for Youth report (2015) which
                                                                                                                                                                          *job numbers are approximate only, using 2-digit NAICS codes via EMSI
recognizes, as stated previously, that a youth strategy should                                                                                                            Analyst to illustrate trends.
be part of an overall economic growth and job creation
strategy.

     Niagara Region Asset Mapping
     Advanced Manufacturing Asset Density
                                                Lake Ontario
                                                                     St. Catharines
                                                                                                                                                          ¯               Niagara Region Asset Mapping
                                                                                                                                                                          Goods Transportation Asset Density
                                                                                                                                                                                                                       Lake Ontario
                                                                                                                                                                                                                                            St. Catharines
                                                                                                                                                                                                                                                                                                                                 ¯
                                                                                                  Niagara-on-the-Lake                        New York                                                                                                                    Niagara-on-the-Lake                        New York
       City of                                                                                                                                                              City of
      Hamilton                                                                                                                                 State                       Hamilton                                                                                                                                   State
                            Grimsby                                                                                                                                                              Grimsby

                                                     Lincoln                                                                                                                                                               Lincoln

                                                                                      Thorold                                                                                                                                                               Thorold
                         West Lincoln                                                                                                                                                         West Lincoln

                                                                Pelham                                                                                                                                                                   Pelham
                                                                                                                   Niagara                     Grand                                                                                                                                     Niagara                      Grand
                                                                                                                    Falls                      Island                                                                                                                                     Falls                       Island

                                                                                       Welland                                                                                                                                                                Welland
        Haldimand                                                                                                                                                            Haldimand
         County                                                                                                                                                               County

                                                        Wainfleet                                                                 Fort Erie                                                                                   Wainfleet                                                                  Fort Erie
                                                                                          Port Colborne                                                                                                                                                          Port Colborne
     Density                                                                                                                                                              Density
                        Asset Count: 829                                                                                                                                  Assets Per
                                                                                                                                                                                             Asset Count: 870
     Assets Per
     Square Kilometer                                                                                                                                                     Square Kilometer
                        Boundaries                                                                                                                                                           Boundaries
            9                                                                                                                                                                    6
                              Niagara Region                                                                                                                                                       Niagara Region
                              Census Division                                                                                                                                                      Census Division
                                                                    Lake Erie                     0            5           10                        20                                                                                Lake Erie                        0            5            10                        20
                              Census                                                                                                                  Kilometers                                   Census                                                                                                                    Kilometers
            0                 Subdivisions                           Niagara Community Observatory. April 2017. Projection: Transverse Mercator. Coordinate System:              0                 Subdivisions                            Niagara Community Observatory. April 2017. Projection: Transverse Mercator. Coordinate System:
                                                                     NAD 1983 UTM Zone 17N. Data Source: Rel8ed.to, The State of New York and Statistics Canada.                                                                           NAD 1983 UTM Zone 17N. Data Source: Rel8ed.to, The State of New York and Statistics Canada.

                                  ADVANCED MANUFACTURING                                                                                                                      GOODS TRANSPORTATION & WAREHOUSING
                                      Niagara Job Numbers*                                                                                                                                Job Numbers*
     2010                                      2016                                                                                           2021                        2010                2016             2021
     7,523                                     7,789                                                                                          8,119                       5,696               6,375            6,590
     *job numbers are approximate only, using 4-digit NAICS codes via EMSI                                                                                                *job numbers are approximate only, using 2-digit NAICS codes (minus
     Analyst to illustrate trends.                                                                                                                                        scenic and sightseeing transport) via EMSI Analyst to illustrate trends.

11
  The following NAICS codes were used for each of the five sectors: Advanced Manufacturing (332, 333, 334, 335, 336, 339), Agribusiness (11), Culture
and Tourism (71, 72, 487110, 487210, 487990, 5100-5152, 561510, 561520, 561590), Goods Transportation and Warehousing (48-49), Life Sciences
(325412-4, 334512, 3391, 41451, 423450, 423460, 541380, 541711, 541940, 611310, 621511, 621512, 622110, 622310, 8132). NAICS Canada 2017 ref-
erence at http://www.statcan.gc.ca/pub/12-501-x/12-501-x2016001-eng.pdf
                                                                                                                                                                      6
Niagara Region Asset Mapping
     Life Sciences Asset Density
                                                Lake Ontario        St. Catharines
                                                                                                                                                        ¯                   Niagara Region Asset Mapping
                                                                                                                                                                            Tourism Asset Density
                                                                                                                                                                                                                           Lake Ontario      St. Catharines
                                                                                                                                                                                                                                                                                                                                   ¯
                                                                                                Niagara-on-the-Lake                        New York                                                                                                                       Niagara-on-the-Lake                        New York
       City of                                                                                                                                                                 City of
      Hamilton                                                                                                                               State                            Hamilton                                                                                                                                 State
                            Grimsby                                                                                                                                                                   Grimsby

                                                   Lincoln                                                                                                                                                                    Lincoln

                                                                                   Thorold                                                                                                                                                                    Thorold
                         West Lincoln                                                                                                                                                             West Lincoln

                                                                 Pelham                                                                                                                                                                    Pelham
                                                                                                                 Niagara                     Grand                                                                                                                                         Niagara                     Grand
                                                                                                                  Falls                      Island                                                                                                                                         Falls                      Island

                                                                                       Welland                                                                                                                                                                 Welland
        Haldimand                                                                                                                                                               Haldimand
         County                                                                                                                                                                  County

                                                      Wainfleet                                                                 Fort Erie                                                                                        Wainfleet                                                                Fort Erie
                                                                                          Port Colborne                                                                                                                                                           Port Colborne
     Density            Asset Count: 411
                                                                                                                                                                            Density
     Assets Per                                                                                                                                                              Assets Per
                                                                                                                                                                                                 Asset Count: 5,574
     Square Kilometer                                                                                                                                                        Square Kilometer
                        Boundaries                                                                                                                                                  143
                                                                                                                                                                                                 Boundaries
            6
                              Niagara Region                                                                                                                                                           Niagara Region
                              Census Division                                                                                                                                                          Census Division
                                                                                                                                                                                                                                             Lake Erie
                                                             Lake Erie                          0            5           10                        20                                                                                                                     0            5           10                        20
                              Census                                                                                                                Kilometers                                         Census                                                                                                                 Kilometers
            0                 Subdivisions                         Niagara Community Observatory. April 2017. Projection: Transverse Mercator. Coordinate System:                   0                  Subdivisions                          Niagara Community Observatory. April 2017. Projection: Transverse Mercator. Coordinate System:
                                                                   NAD 1983 UTM Zone 17N. Data Source: Rel8ed.to, The State of New York and Statistics Canada.                                                                               NAD 1983 UTM Zone 17N. Data Source: Rel8ed.to, The State of New York and Statistics Canada.

                                                  LIFE SCIENCES                                                                                                                                                  TOURISM ASSET DENSITY
                                                   Job Numbers*                                                                                                                                                       Job Numbers*
     2010                                              2016                                                                             2021                                 2010                                          2016                                                                                  2021
     9,649                                             9,753                                                                           10,263                                30,136                                       32,955                                                                                33,362
     *job numbers are approximate only, using 4-digit NAICS codes via EMSI                                                                                                   *job numbers are approximate only, using 4-digit NAICS codes via EMSI
     Analyst to illustrate trends.                                                                                                                                           Analyst to illustrate trends.

                 TRANSIT ACCESSIBILITY
                                    Industry                                Total                                   400m Service Area                                           600m Service Area                                           800m Service Area
                                                                          Regional                                Assets in    Percent                                       Assets in    Percent                                       Assets in   Percent
                                                                         Assets (# of                              Service                                                     Service                                                     Service
                                                                           firms)                                   Area                                                        Area                                                        Area
                        Advanced                                                             829                                      352                           42.5%                       413                      49.8%                        445                              53.7%
                        Manufacturing
                        Agribusiness                                                     1461                                          96                            6.6%                       118                       8.1%                        139                               9.5%
                        Goods                                                             870                                         418                           48.0%                       474                      54.5%                        506                              58.2%
                        Transportation
                        Life Sciences                                                     411                                      310                              75.4%                    333                         81.0%                     340                                 82.7%
                        Tourism                                                          5574                                     4100                              73.6%                   4334                         77.8%                    4456                                 79.9%
                        Table 3: Public transit data courtesy Niagara Region

                OUR ANALYSIS SHOWS:                                                                                                                                      We also looked at transit accessibility as the ability of young
                  • Life Sciences and Tourism industries were the most                                                                                                   people (and all those looking for work, especially
                    accessible to public transit riders.                                                                                                                 “vulnerable” populations) to get to their jobs should also be
                  • Agribusiness was the least accessible, which is
                                                                                                                                                                         taken into consideration when discussing the employment
                    consistent with the concentration of assets outside of
                                                                                                                                                                         landscape, as it is not reasonable to expect everybody to be
                    the urban areas serviced by public transit.
                  • Advanced Manufacturing and Goods Transportation                                                                                                      able to drive a car, or to own one, especially in the 15-29 age
                    presented moderate accessibility.                                                                                                                    cohort. Table 3 illustrates the results of our transit
                                                                                                                                                                         accessibility analysis in which we measured the distance
                By expanding the service area from 400 m to 800 m,                                                                                                       between public transit stops and businesses within each
                accessibility increased by an average of 7.6 per cent. Despite                                                                                           sector under study. It identifies businesses (assets) within a
                the increase, the overall trends in accessibility rankings are                                                                                           400-metre, 600-metre and 800-metre walk to the nearest
                consistent across service-area size.
                                                                                                                                                                         stop.

12
  There are limitations to the analysis: it assumes sidewalks are present on all streets, it does not account for streets without sidewalks or pedestrian
paths that do not follow the street network, it assumes all transit users walk to transit stops and does not account for users traveling to transit stops by
other means of transportation. The walking-distance thresholds used by analysis are variable. That is, the distance people are willing to walk to a transit
stop may be influenced by additional factors not accounted for in the analysis. Therefore, the results are only estimates and provide an indication of ac-
cessibility ranking between industries.
                                                                                                                                                                     7
WHAT DOES THIS MEAN FOR OUR YOUTH?                                   3) The goal of any public policy input – from post-
The subject of youth employment is an intrinsically multidi-            secondary institutions as well as government initiatives
mensional problem. It touches on issues of economic prosperity          – should include efforts to synchronize youth skills
and market efficiencies from the standpoint of leveraging a re-         coming out of their education with the region’s growing
gion’s full human capital to adapt to the rapid changes of a glob-      sectors. Ideally, we want young people to find jobs
ally-integrated knowledge-driven economy. It is also a question         locally in their chosen fields of study and working for a
of a community’s sense of social solidarity from the standpoint         competitive rate that keeps them from searching
of poverty alleviation and reduction of income inequality. Fi-          outside the region.
nally, and most importantly, it is an existential issue in as much
as the capacity of a region to address the challenges of youth         One important element of this step would be a further
unemployment determines its long-term survival and prosper-            study to understand the reasons for any mismatch
ity as a viable community.                                             between education and local employment (see
                                                                       suggestion #1). Also, undertaking a systemic revamp of
This policy brief by the NCO is an attempt to throw light on the       our job placements strategies, including coops and
complex, multifaceted problem of youth unemployment con-               internships, would be a vital second element. Several
fronting Niagara, with the aim of generating discussion among          noteworthy job placement initiatives have been taken
public officials and citizens about appropriate measures that are      in the region, but providing a more coherent and
specific to the needs and circumstances of Niagara. It will take       synchronized training placement system that minimizes
systemic and multi-pronged efforts to address this challenge,          fragmentation, duplication and loopholes would
but fully understanding the nature and nuances of the problem          constitute significant milestone on this front.
is a first step in that direction.
                                                                     4) A fourth action step we recommend emerges from the
The data and discussion in this policy brief is descriptive in its      indications of the geospatial maps, pointing to
nature, but points to several aspects in need of further investi-       concentrations of certain industry groupings in Niagara.
gation with more focused data.                                          The academic and policy literature indicates regions that
    1) The creation of an expert panel on youth employment              successfully adapt to global economic changes are often
       in Niagara could facilitate the link between our                 the ones that build on their current strengths rather
       understanding of existing data and the core program              than pursuing pies in the sky. We encourage the use of
       priorities that should follow, including employment              these maps as a starting point for further research into
       needs and perceived skills mismatches. The complexity            scale-up opportunities.
       of this issue demands a sustained and focused
       discussion to guard against potential distraction from          Also, pursuant to an improved job-placement strategy,
       competing local policy issues.                                  the region could strategically link its youth training and
                                                                       employment strategy to the current and emerging
    2) Discussions on expanded public transit accessibility for        human capital needs of these five core economic drivers.
       the region’s residents should link more closely to
       employment accessibility for its vulnerable populations,
       including youth.
REFERENCES
Bartlett, R. 2014. Young and Restless: A Look at the State of Youth Employment in Canada. TD Economics Special Report. December.
https://www.td.com/document/PDF/economics/special/YoungAndRestless.pdf

Canada. 2012. Economic and Fiscal Implications of Canada’s Aging Population. Dept. of Finance. http://www.fin.gc.ca/pub/eficap-rebvpc/eficap-rebvpc-
eng.pdf

Canada. 2014. Youth Employment in Canada: Challenges and Potential Solutions. Report of the Standing Committee on Finance, House of Commons
Canada (41st Parliament, Second Session, June). http://www.ourcommons.ca/Content/Committee/412/FINA/Reports/RP6658485/finarp06/finarp06-
e.pdf

Canada. 2017. 13 Ways to Modernize Youth Employment in Canada. Strategies for a New World of Work. Report from the Expert Panel on Youth Employ-
ment. http://publications.gc.ca/collections/collection_2017/edsc-esdc/Em4-13-2017-eng.pdf

Conference Board of Canada. 2006. Canada’s Demographic Revolution: Adjusting to an Aging Population. March. http://www.conferenceboard.ca/e-li-
brary/abstract.aspx?did=1599

Cross, Philip. 2015. The Recession’s Impact on Canada’s Labour Market. University of Calgary School of Public Policy Research Papers. Vol. 8 (July), Issue
28. https://ssrn.com/abstract=2630663

Cross, Philip. 2015. Serving Up the Reality on Youth Unemployment. Macdonald-Laurier Institute. http://www.macdonaldlaurier.ca/files/pdf/MLI-
PCrossYouthUnemployment10-15-webready.pdf

EMSI 2017.1 (Employees, Niagara) Custom Tabulation. http://www.economicmodeling.com/canada

Fields, Daniel. 2014. “Chapter 2: Demographics. Demographic Time Bomb Continues to Tick.” In Canadian Outlook 2015 Long-Term Economic Forecast.
Conference Board of Canada. http://www.conferenceboard.ca/e-library/abstract.aspx?did=6737

International Labour Organization. 2015. Global Employment Trends for Youth. Geneva. http://www.ilo.org/wcmsp5/groups/public/---dgreports/---
dcomm/---publ/documents/publication/wcms_412015.pdf

Marshall, K. 2012. Youth Neither Enrolled Nor Employed. Statistics Canada. May. http://www.statcan.gc.ca/pub/75-001-x/2012002/article/11675-
eng.pdf

Phillips, Carol & A. Durrant. 2017. Growing Niagara: A closer look at Niagara’s aging population. Niagara Community Observatory, Brock University. Janu-
ary. https://brocku.ca/niagara-community-observatory/wp-content/uploads/sites/117/A-closer-look-at-Niagara%E2%80%99s-aging-population.pdf

Niagara Region. 2015. Regional Council Strategic Priorities, Implementation Plan. February. https://www.niagararegion.ca/priorities

Statistics Canada. 2013. National Household Survey Profile. 2011 National Household Survey. Statistics Canada Catalogue no. 99-004-XWE. Ottawa.
Released June 26, 2013. http://www12.statcan.gc.ca/nhs-enm/2011/dp-pd/prof/index.cfm?Lang=E

Statistics Canada. 2017. Custom Tabulation. Labour Force Survey (LFS) Estimates, Employment by Age Group, St. Catharines - Niagara CMA, Annual Av-
erage, 2006 to 2016.

Statistics Canada. 2011. National Household Survey. Catalogue Number 99-010-X2011048.

Statistics Canada. Table 282-0087 - Labour force survey estimates (LFS), by sex and age group, seasonally adjusted and unadjusted, annual.
http://www5.statcan.gc.ca/cansim/a26?id=2820087 (accessed: April 28, 2017)

Statistics Canada. 2017. Focus on Geography Series, 2016 Census. Statistics Canada Catalogue no. 98-404-X2016001. Ottawa. Analytical products, 2016
Census. http://www12.statcan.gc.ca/census-recensement/2016/as-sa/fogs-spg/Facts-can-eng.cfm?Lang=Eng&GK=CAN&GC=01

                                                                                                                  Research for this project was funded in part by
     This paper was prepared as part of the Binational Prosperity Initiative, by:
     Charles Conteh, PhD | Director | NCO | Brock University
     Carol Phillips, PhD | Research Coordinator | NCO | Brock University
     Nicole Ferguson, BA, PG (GIS) | Research Assistant | NCO | Brock University

     An electronic version of this brief can be found at www.brocku.ca/nco
          @BrockNCO
You can also read