10 Frequently Asked Questions on Air Quality Index
←
→
Page content transcription
If your browser does not render page correctly, please read the page content below
10

Frequently Asked

  Questions on

Air Quality Index

                         Sarath Guttikunda

     SIM-air working paper series # 46-2021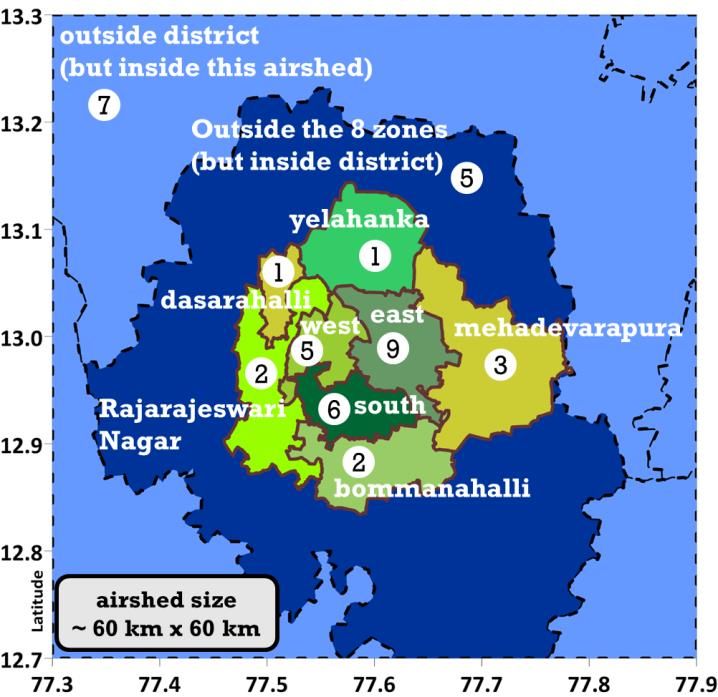
(UEinfo) was founded in 2007 with the vision to be a repository of information, research,
and analysis related to air pollution. There is a need to scale-up research applications to the
secondary and the tertiary cities which are following in the footsteps of the expanding
mega-cities. Advances in information technology, open-data resources, and networking,
offers a tremendous opportunity to establish such tools, to help city managers, regulators,
academia, and citizen groups to develop a coordinated approach for integrated air quality
management for a city.

UEinfo has four objectives: (1) sharing knowledge on air pollution (2) science-based air
quality analysis (3) advocacy and awareness raising on air quality management and (4)
building partnerships among local, national, and international airheads.

This report was conceptualized, drafted, and designed by the members of UEinfo. All the
doodles are made using the open source software https://excalidraw.com.

All the working papers and more are accessible @ www.urbanemissions.info/publications

Send your questions and comments to simair@urbanemissions.info
What is an Air Quality Index?

There are many saying like “seeing is believing”, “picture is worth a thousand words”, and
“what we cannot measure, cannot be managed”. This “air quality index” (AQI) falls under
the same umbrella which makes it possible to see and understand the width and
breadth of air quality at a location or a city.

Air pollution can be measured and presented in many forms (a) as it includes all the aerosols
and gaseous components (b) each with their own way of affecting human health at various
degrees of exposure rates (c) as some pollutants can lead to an immediate response like
carbon monoxide (CO) and Ozone (O3) which require standard metrics presented on a
different time scale (8-hourly) compared to other pollutants (24-hourly) and (d) finally the
presentation – for example aerosols are reported as mass fractions and gases as volumetric
fractions of air.

What AQI does is unifies all this complicated science of pollution composition, exposure rates
based health severity, ambient standards, measurement and standard protocols, into simple
colour coded bins for everyone to see how good or bad or ugly the pollution levels are and
understand the necessary alertness.

                                                                                             1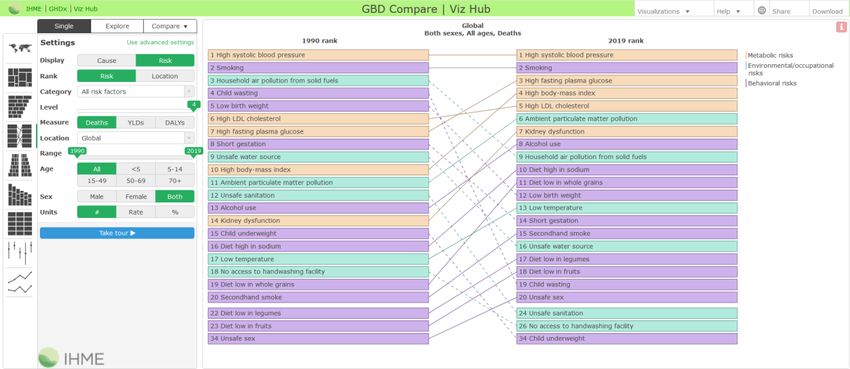
While simple, this topic still raising some confusing questions during a conversation. This
paper is dedicated to answer some of those questions on AQI in the form of 10 Frequently
Asked Questions (FAQs)

   1. What is the difference between air quality and air quality index?

   2. Is it better to report pollutant concentrations or pollutant AQI values?

   3. How is AQI calculated?

   4. Every criteria pollutant has an index value, then which one decides “AQI of the day”?

   5. What is the difference between Indian, Chinese, USA, EU, and other AQI
      methodologies?

   6. How many monitors are required to monitor to calculate AQI of a city?

   7. What is the difference between hourly and daily AQI?

   8. What is the meaning of AQI=500 or AQI=999?

   9. Is PM2.5 the most harmful of all air pollutants?

   10. Where can we access real time updates on air quality and AQI?

                                                                                              2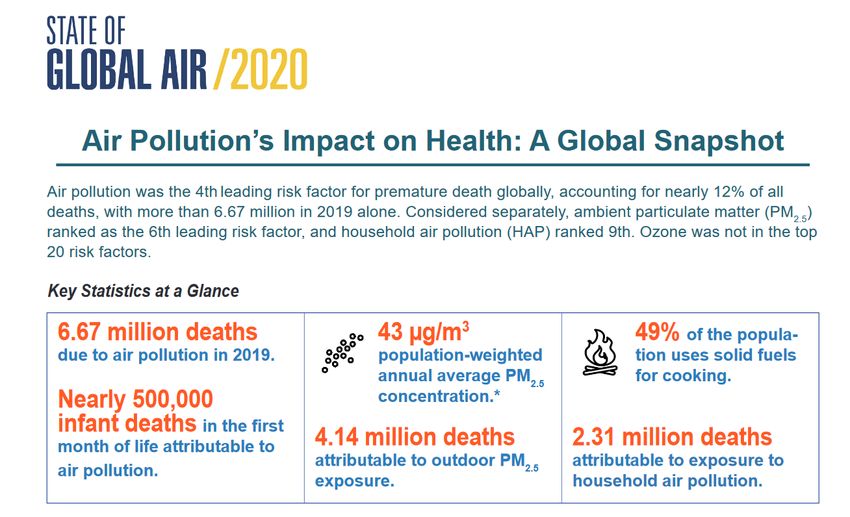
Question #01 - What is the difference between air quality and air
quality index?

It is common to hear conversations where air quality and air quality index are used
synonymously, but these numbers come from two contrasting worlds.

While “Air Quality” is a necessary number to support regulatory and science discussions as it
represents the absolute nature of air pollution, “Air Quality Index” is an extract from air
quality as a number to simplify the pollution alert system and to support public awareness.

                                                                                           3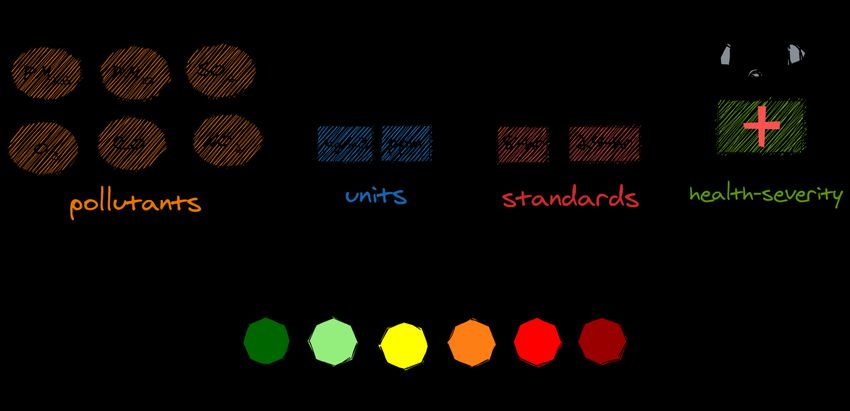
Question #02 – Is it better to report pollutant concentrations or
pollutant AQI values?

Depending on the person talking or talking to, answer to this question varies significantly.

Here are some examples:

   •   Academic/Scientist – absolute values are preferred, which help validate the modelling
       efforts, build a better understanding of how pollution effects the environment, health,
       and our overall well being

   •   Regulator – both the numbers are crucial. While the absolute values are necessary to
       understanding the emission and pollution loads, exceedances, and corresponding
       impacts, the index value is necessary to communicate the severity of the pollution
       levels to the public.

   •   Non-government staff/Parents/Media – an index is preferred as it helps with
       communicating the severity of the pollution levels, without the necessity of knowing
       the science behind the absolute values and trends

   •   Industry – absolute values are preferred as they are required to present and discuss
       the true nature of emissions and pollution at their sources.

                                                                                               4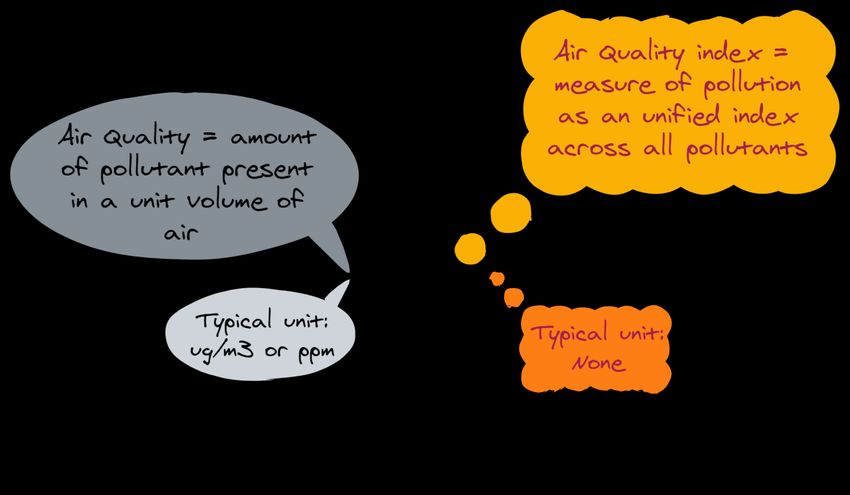
Question #03 - How is AQI calculated?
General equation for calculating the AQI is the following
where
• CONC = concentration of the pollutant
• AQI = air quality index for the pollutant
• BPhi = breakpoint that is greater than or equal to CONC
• BPlo = breakpoint that is less than or equal to CONC
• AQIhi = AQI value corresponding to BPhi
• AQIlo = AQI value corresponding to BPlo
Every pollutant has pre-defined breakpoint and AQI ranges for each of the colour codes. Here
is an example for India.
The numbers in the first column represent the AQI bins (hi and low values to be used in the
calculator). The number ranges under each of the pollutants represent the breakpoints. In
this table, all the breakpoints are in g/m3, except for CO which is listed in mg/m3.
The top of the AQI scale is 500, which means there will be point in the calculation when the
AQI value itself will not change between absolute value of 1000 and 2000 g/m3 of PM2.5 or
PM10. Once the colour code reaches the severe category, there is no other scale.
5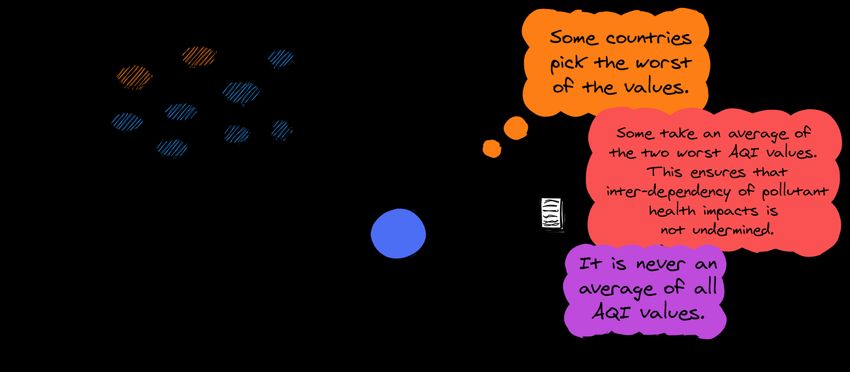
Here are some example calculations using India’s AQI methodology

                                                                   6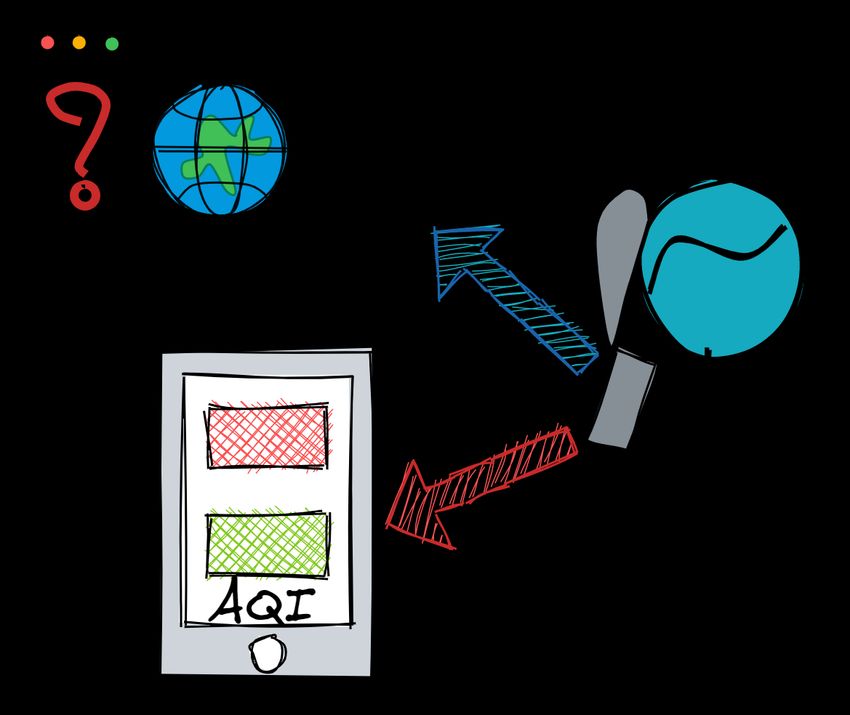
PM2.5 is the most common pollutant that dictates “AQI of the day” for most of countries. In US
and EU countries where industrial activities are minimum and most of the pollution is
sourced from vehicle exhaust, NO2 and/or O3 either precede or follow PM2.5. Other typical
occurrences include PM10 during a dust storm, SO2 for an area dominated by coal combustion
activities, and CO during an open biomass burning days.

                                                                                            7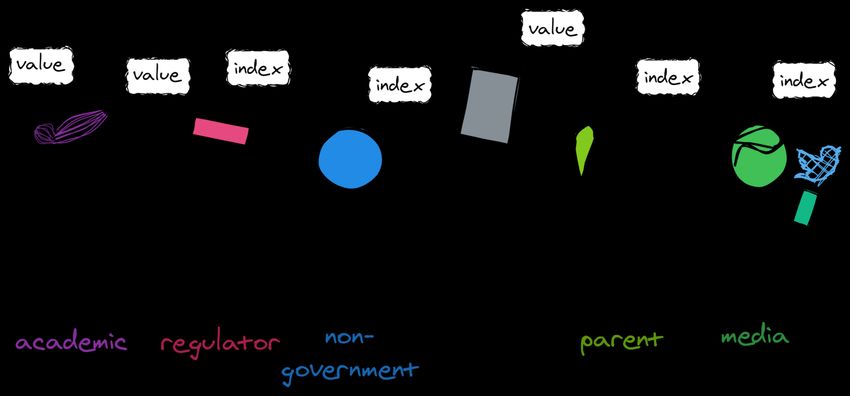
Question #04 - Every criteria pollutant has an index value, then
which one decides “AQI of the day”?
Typically, AQI is calculated for six pollutants – PM2.5, PM10, SO2, NO2, CO, and Ozone. Some
countries also include measurements of NH3 and some carcinogens, where measurements
are available. If AQI is calculated for more than 2 pollutants, these are the two known
methods for picking “AQI of the day”.
• Picking the worst AQI value, ensures that the worst pollutant of the day is immediately
highlighted
• Picking an average of the two worst AQI values also accounts for inter-dependency of
pollutant health impacts is not undermined. This method ensures that we do not over-
emphasize the importance of the worst pollutant and do not under-estimate the
importance of the second worst pollutant.
• Averaging all the pollutants is not advised, as this method has the tendency to nullify
the overall severity of the pollutants.
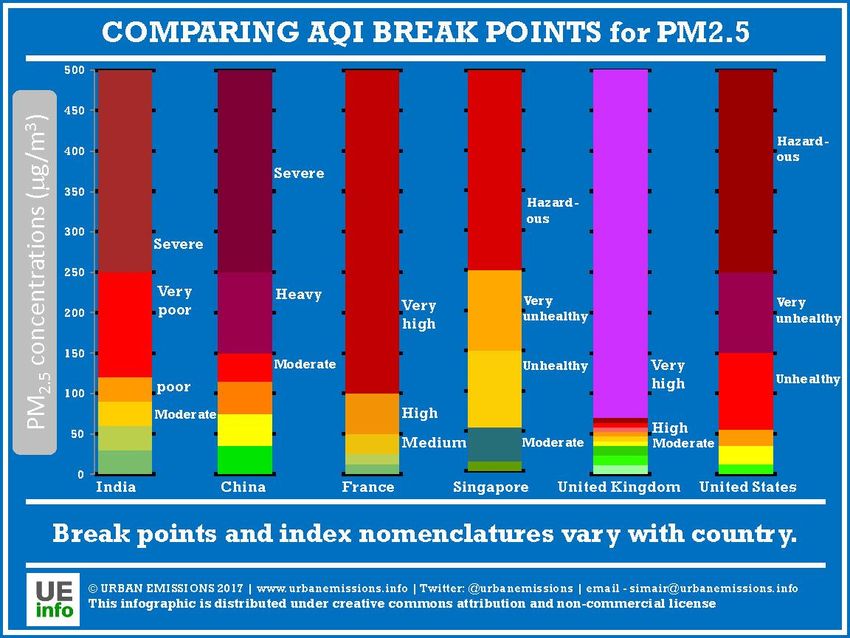
8Question #05 - What is the difference between Indian, Chinese,
USA, EU, and other AQI methodologies?
While the impacts of air pollution on human health are common across the globe, from
country to country these metrics are interpreted differently for regulatory purposes. This is
primary driven by pre-determined local standards and the feasibility of reaching the lowest
possible pollution levels. For example, in a region where presence of dust is natural, it is not
possible to reach WHO guidelines for PM10 and PM2.5. This is one of reasons for India’s annual
standard for PM2.5 being 4 times the WHO guideline. The same principle also trickles into the
formulation of AQI by individual countries, which notionally resembles their standards.
9Question #06 - How many monitors are required to calculate
AQI of a city?
“How much to monitor” primarily depends on the financial status of the city or the concerned
institution. It is important that monitoring stations are established as many as possible, to
create a representative pollution map the city or the area of interest, and this is dependent
on the local institutional capacity, not only for procuring the equipment, but also to operate
and maintain the same.
Typically, a thumb rule for representativeness of a continuous monitoring station is 4-km
diameter. This could be lesser inside the cities with multiple obstructions like tall buildings
and trees or could be more outside the cities which is commonly referred to as “background”.
Placing a monitor every 9-km2 is financially and technically prohibitive for any city or country.
10A representative sample set will include many monitors in densely populated and
commercially active areas of an airshed and lesser number of stations outside the main
urban areas. This is a compromise between technical needs and financial obligations of a
buying and operating a network.
Countries have their own thumb rules on the number of recommended monitoring stations
to represent the trends spatially and temporally in a city or an area of interest. India’s Central
Pollution Control Board created some guidelines (summarized below) for estimating
recommended number of monitoring stations for total suspended particulate matter (SPM),
SO2, NO2, and CO (and other oxidants).
Pollutant Population in the airshed Number of stations
Suspended particulate < 100,000 4
matter (SPM) 100,000 to 1,000,000 4 + 0.6 per 100,000 population
1,000,000 to 5,000,000 7.5 + 0.25 per 100,000 population
> 5,000,000 12 + 0.16 per 100,000 population
Sulfur dioxide (SO2) < 100,000 3
100,000 to 1,000,000 2.5 + 0.5 per 100,000 population
1,000,000 to 10,000,000 6 + 0.15 per 100,000 population
> 10,000,000 20
Nitrogen dioxide (NO2) < 100,000 4
100,000 to 1,000,000 4 + 0.6 per 100,000 population
> 1,000,000 10
Carbon monoxide (CO) < 100,000 1
and Oxidants 100,000 to 5,000,000 1 + 0.15 per 100,000 population
> 5,000,000 6 + 0.05 per 100,000 population
Using these guidelines, an example for the city
of Bengaluru is presented in the adjacent
figure. This assessment used information on
gridded population and gridded urban
settlements area to estimate the
recommended number of 41 particulate
monitors for the city’s airshed.
11Question #07 - What is the difference between hourly and daily
AQI?
While AQI values change every hour for a city (as an average of all the stations data) or for a
station, the index does not represent the air quality at that hour alone.
There is no hourly and daily AQI. There is only AQI.
If AQI is reported for a city every hour, then it is an index value based on average of last 24-
hours or last 8-hours of concentrations data.
If AQI is reported only once every day, then it is an index value based on that day’s 24-hour
average or daytime 8-hour average concentrations data.
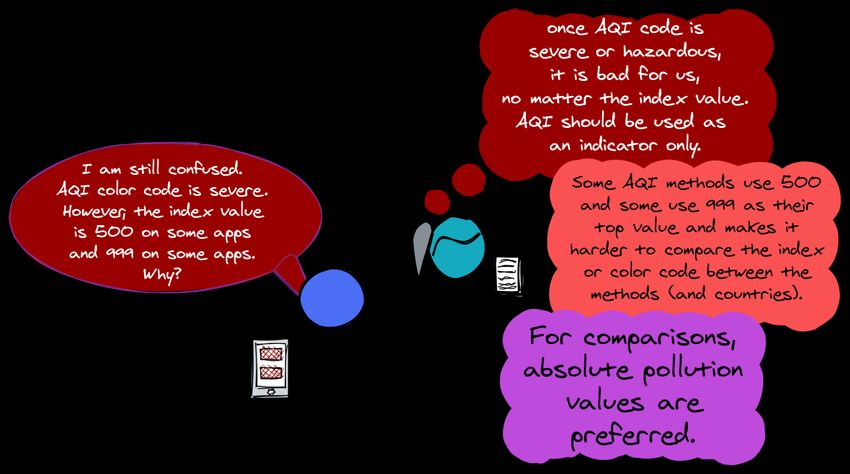
12Question #08 - What is the meaning of AQI=500 or AQI=999?
Differences in AQI values stem from the fact that countries and various data analytical groups
use their preferred methodology in calculating and presenting the numbers. Some methods
use 500 and some use 999 as the top AQI value to present the severe or hazardous category.
However, since AQI is only an index to provide some guidance on where the pollution levels
are, once the index reaches the last category, it does not matter what the value is – the
bottom line is that “air pollution is severe or hazardous or at the emergency levels”.
It is important to understand AQI masks the true severity of the pollution levels. If absolute
PM2.5 concentration is 500 or 1000 or 3000 g/m3, the AQI index will show 500 or 999,
depending on the selected scale. However, breathing air at 3000 g/m3 is very dangerous
than 500 and the bottom line is that “air pollution is severe or hazardous or at the emergency
levels” and needs immediate attention.
.
13Question #09 - Is PM2.5 the most harmful of all air pollutants?
Several studies were conducted worldwide to understand the epidemiological nature of air
pollution with health impacts. The Global Burden of Diseases study, which is updated every
year, provides a library of such studies and a synthesis of results in the form integrated
exposure response (IER) curves linking particulate matter and ozone to various health
endpoints1.
Among the environmental risks, air pollution is among the top 10 for exposure from outdoor
and indoor air pollution and among the pollutants particulate matter and ozone key. The
complexity in singling these two pollutants is primarily due to their chemical composition
(FAQ-02) linked to other pollutants, their tendency to stay in the air for longer periods and
1
Global Burden of Diseases visualization platform @ https://vizhub.healthdata.org/gbd-compare and
@ https://www.stateofglobalair.org/resources
14travel longer distances, and their tendency to go deeper into human body parts and result in
chronic diseases. with inter-independencies and the chemical mechanisms involved in the
formation of the PM, which combines the properties of most of the criteria pollutants.
PM2.5 pollution is directly linked to cause or exacerbate asthma, collapsed lung, chronic
bronchitis, pneumonia, blocked lung artery, lung cancer, diabetes, blood pressure,
complications during pregnancy, early childhood brain function impairment, and even hair
loss. While the IER curves give an indication of the possible impacts of air pollution on human
health, there are other impacts which need immediate attention, such as smog (visibility
impacts), agricultural yield (linked to ozone), and climate change (like changes in monsoon
patterns).
Resource material on health impact analysis:
• Visualization portal for 1990-2018 global burden of disease estimates (IHME-GBD)
o Resource links to methodology and inputs
• Visualization portal for State of the Global Air (SOGA) by Health Effects Institute (HEI)
o India factsheet and more
• India state-level disease burden initiative by ICMR and PHFI (2019)
o State-level reports (PHFI)
• Burden of disease attributable to major sources of air pollution in India (GBDMAPS-India) by HEI
• Air Quality Life Index (AQLI) by U.Chicago
• Health impacts analysis tools
o Household Air Pollution Intervention Tool (HAPIT)
o Air pollution health effects online tool by TERI
o CO-Benefits Risk Assessment (COBRA) health impacts screening and mapping tool by USEPA
o Environmental BENefits MAPping and analysis program (BENMAP) by USEPA
o AirCounts tool by Abt Associates
o Tool for health risk assessment of air pollution – AirQ+ by WHO
o FAst Scenario Screening Tool (FASST) by EU
o Greenhouse gas – Air pollution INteractions and Synergies (GAINS) by IIASA
o The Long-range Energy Alternatives Planning – Integrated Benefits Calculator (LEAP-IBC) by SEI
(all links last accessed in February, 2021)
15Question #10 - Where can we access real time updates on air
quality index?
• https://openaq.org – aggregator of official real-time monitoring data across the globe
(blog piece on how to access data)
• https://waqi.info – aggregator of real-time AQI values only
• https://www.iqair.com - aggregator of official and unofficial data across the globe
• https://www.purpleair.com - a network of low-cost sensors
16www.urbanemissions.info
You can also read