The Space Foundation Report. The Authoritative Guide To Global Space Activity 2015.
←
→
Page content transcription
If your browser does not render page correctly, please read the page content below
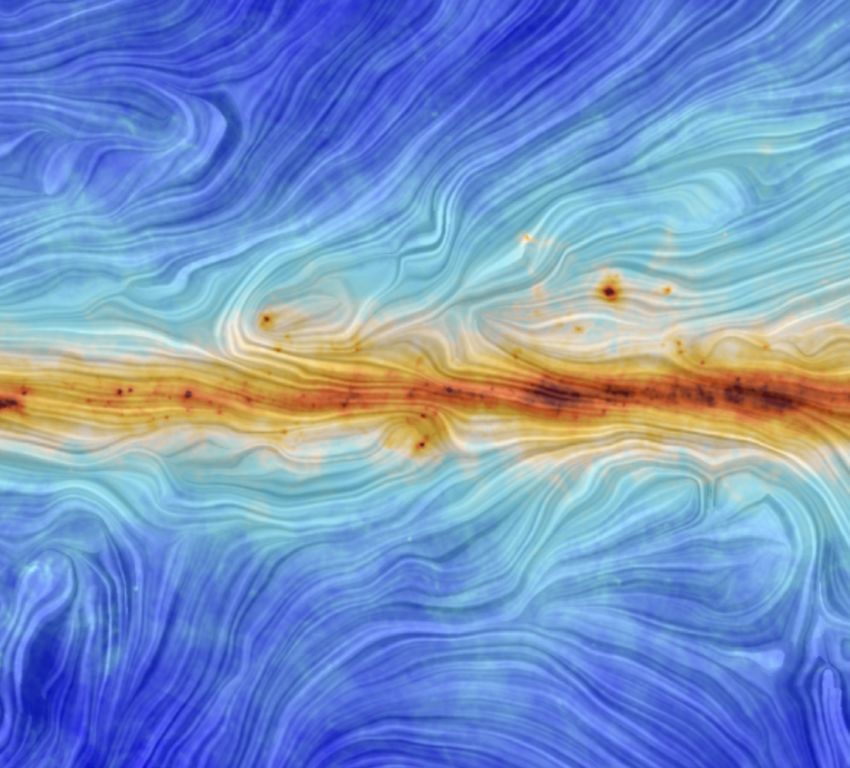
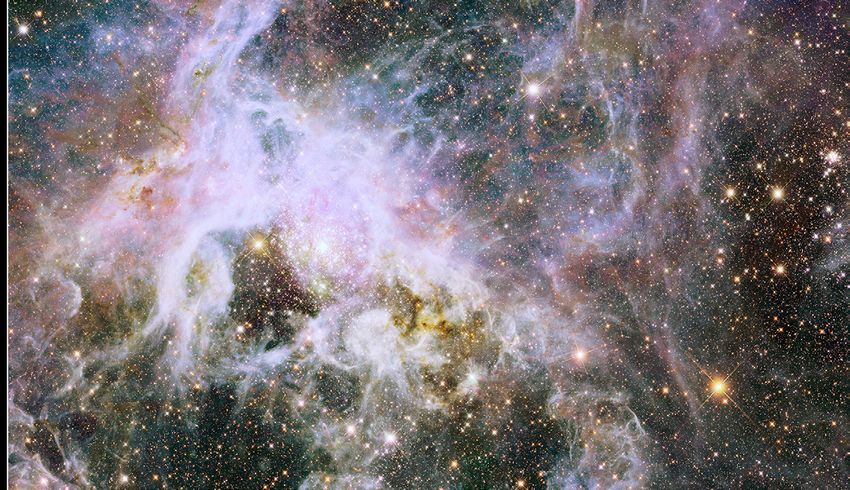
Table of Contents
Overview..................................................................................................................................................................... 1
1.0 | Space Products and Services ................................................................................................................. 4
1.0 Introduction.............................................................................................................................................. 5
1.1 The Benefits of Space Products and Services...................................................................................... 5
1.2 Collaboration Between Space Agencies and the Public.................................................................. 12
2 0 1 5 2.0 | The Space Economy.................................................................................................................................. 13
2.0 Introduction............................................................................................................................................ 14
THE AUTHORITATIVE GUIDE
2.1 Commercial Infrastructure and Support Industries...................................................................... 14
TO GLOBAL SPACE ACTIVITY 2.2 Commercial Space Products and Services........................................................................................ 18
2.3 Government Space Budgets................................................................................................................. 22
2.4 Summary of Data................................................................................................................................... 38
Copyright © 2015
Space Foundation
A Snapshot: The Global Space Economy in 2014................................................................................... 40
All rights reserved. Printed in 3.0 | Space Infrastructure............................................................................................................................... 41
the United States of America.
3.0 Introduction............................................................................................................................................ 42
No part of this book may be
reproduced in any manner 3.1 Orbital Human Spaceflight Systems.................................................................................................. 42
whatsoever without written 3.2 Launch Vehicles...................................................................................................................................... 44
permission except in the case of
brief quotations embodied in 3.3 Space Stations.......................................................................................................................................... 49
critical articles and reviews. 3.4 Satellites.................................................................................................................................................... 50
For more information, 3.5 Spaceports................................................................................................................................................. 60
please contact:
4.0 | Workforce.................................................................................................................................................... 63
Space Foundation
4425 Arrowswest Drive 4.0 Introduction............................................................................................................................................ 64
Colorado Springs, CO 80907 4.1 U.S. Space Workforce............................................................................................................................. 64
1655 N. Fort Myer Drive, 4.2 European Space Workforce.................................................................................................................. 71
Suite 910 4.3 Japanese Space Workforce.................................................................................................................... 72
Arlington, VA 22209
4.4 Other Space Employment.................................................................................................................... 73
www.SpaceFoundation.org
Authors and Contributors......................................................................................................................................... 74
All images used in this
publication are property of
Endnotes........................................................................................................................................................................ 75
their respective owners. Index of Exhibits.......................................................................................................................................................... 81
Sign up for an online subscription at www.TheSpaceReport.org to read
updates, download the data behind the charts in this report, and much more!
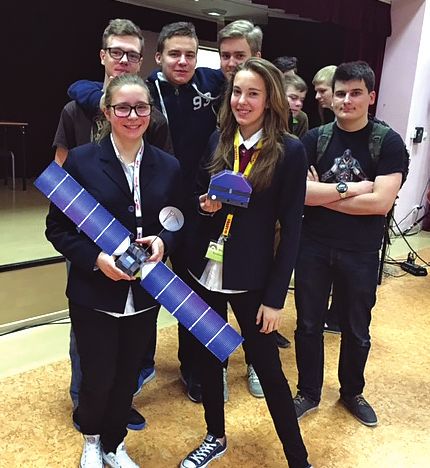
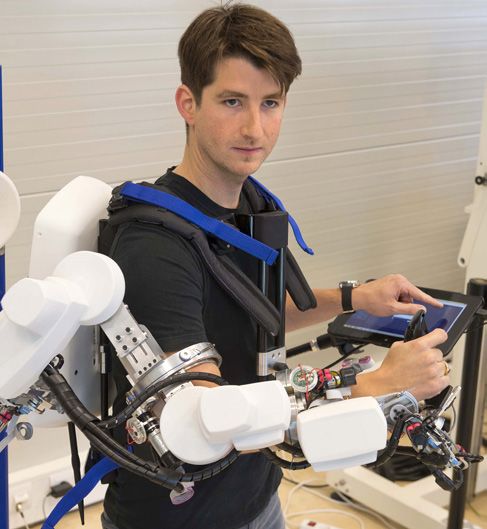
A view of the Milky In an ESA telerobotics Even seasoned NASA Astronauts and Polish high school Radar Technologies Parents and children
Way Galaxy’s magnetic lab, André Schiele Administrator Charles cosmonauts pose students show off International’s use learn to remotely drive
field along the galactic demonstrates remote Bolden gets excited for a photo in the space models during a of GPS, Landsat rovers in the Space
plane. ESA’s Planck robotic operations during NASA’s test of International Space video teleconference imagery, Spaceborne Foundation’s Mars Yard,
satellite provided the with a lightweight the Orion spacecraft in Station. Koichi with the Rosetta Imaging Radar, a simulated Martian
image, which shows exoskeleton. The December 2014. The Wakata, in the Program’s project and Shuttle Radar landscape with various
how the magnetic exoskeleton allows an Orion is designed to center-bottom of the manager. The Rosetta Topography Mission challenging surfaces for
field interacts with operator to control a eventually transport circle, was the first spacecraft travelled technology enabled rovers to drive through.
interstellar gas clouds robot over a cellphone humans to Mars and Japanese astronaut billions of kilometers the company to find The Mars Yard resides in
and dust. Darker network. Credit: ESA other interesting Solar to assume space to rendezvous with a trillions of gallons the Space Foundation’s
colors represent higher System locations. station command. comet and land a small of water beneath Discovery Center in
concentrations of dust. Credit: NASA Credit: NASA probe on it in 2014. drought-ridden Colorado Springs,
Credit: ESA Credit: NASA/JPL Kenya. Credit: NASA Colorado. Credit: Space
Foundation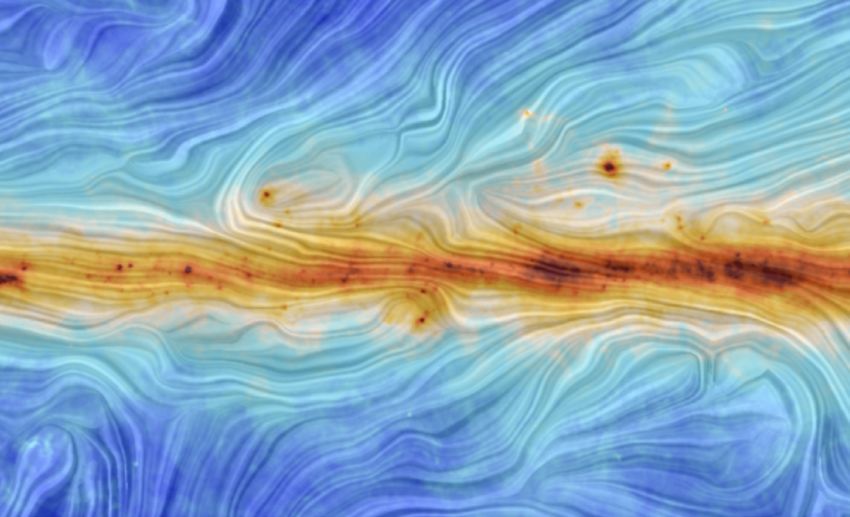
Overview

                  Introduction |          After years of steady, respectable growth, the space industry appears to be on
                  the cusp of a new era of rapid expansion in both capabilities and customers. Startup companies are
                  experimenting with novel approaches for building and deploying constellations of spacecraft and
                  delivering services to their customers in new ways. Long-established space operators are refreshing their
                  offerings as well, taking advantage of the latest technology to offer increasingly powerful products at
                  more affordable prices.

             The global reach of satellites, which has long been one of the space industry’s defining characteristics,
             is attracting interest and investment from other industries, particularly those whose continued growth
             may depend on connecting the billions of people on the planet who currently are without access to
             modern communications. For those customers who are already a part of the modern, networked
             world, there is the prospect of seeing that world in a new way as several space companies vie to provide
             transportation into space and a new view of the world in which we live. The way we go about our
                                                                       daily lives is going to undergo many changes in
EXHIBIT 1. Global Space Activity, 2014
                                                                       next several years, and the skilled professionals who
             $36.21 B                        Commercial Infrastructure constitute the space industry are poised to take a
                                             and Support Industries
               (11%)
                                             Commercial Space Products
                                                                       leading role in making those changes a reality.
                                                                     and Services
         $42.96 B
          (13%)                        $127.65 B
                                         (39%)
                                                                     U.S. Government Space
                                                                     Budgets                 1.0 | Space Products and Services
                                                                            People recognize the benefits of space products and
                                                                     Non-U.S. Government
                                                                            services, using creativity to overcome daily existential
                                                                     Space Budgets

               $123.18 B                                                    challenges and improve lives. The space products and
                 (37%)
                                                                            services industry crosses the spectrum of demands and
                                                                            necessities, and continued to grow in 2014, sometimes
                                                                            leveraging the same kind of technology to help with
    Total: $330.00 Billion                               © Space Foundation different challenges. Space technology benefitting skiers in
                                                                            the backcountry also saved crews from deadly scenarios at
                sea. Neurosurgery, the smallest and finest of surgeries, applied technologies initially developed for manipulating large
                objects around a space station. But perhaps the biggest impact of the space industry was in the form of tool that many
                of us carry around each day.

                  Billions of people use satellite-augmented devices in their lives, whether the cheapest tablet or the most upscale
                  smartphone. More often than not, the processors within those devices have a satellite position, navigation, and timing
                  (PNT) function embedded within. In less than eight years since the smartphone’s introduction, more people than
                  ever use application services on mobile computers to hail and track a ride; find the closest, cheapest, and tastiest food
                  offerings; conduct banking securely; learn about a city’s history, while being guided to prominent tourist sites; and
                  more. None would be as convenient, accurate, or secure without satellite PNT integrated in each device.

                  Satellite-provided imagery became more affordable in 2014 and nearly ubiquitous on every mobile device.
                  Manufacturers included imagery applications on their devices in the form of map and navigation software. Combined
                  with a device’s PNT function, a person could order an updated image of their location. Other users received updated
                  imagery of disaster areas to see if relatives were safe. Combining imagery with PNT and communications networks
                  yielded real-time traffic updates for the drive home, updated delivery estimates of when a gift would arrive for a loved
                  one, or real-time weather conditions in tornado-prone regions.

1    The Space Report 2015 | The Authoritative Guide to Global Space Activity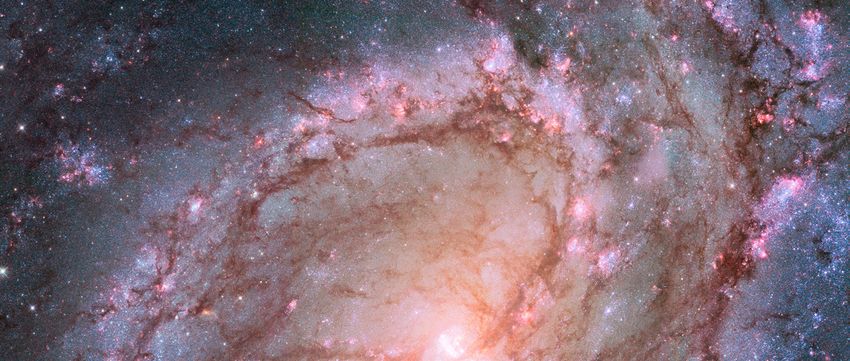
Overview

                   These, and other space products and services, depend on data coming from fleets of satellites, operated by
                   governments and commercial entities. Many entrepreneurs and other talented individuals sought to provide
                   more data and products in unique ways, stimulating more growth in the growing space economy.

                        2.0 | The Space Economy
                   The year 2014 was a good one for the global space economy overall. Consisting of launch and ground services,
                   satellite manufacturing, satellite television and communications, government exploration, military spending,
                   and other interests, the global space economy grew by 9% in 2014, reaching a total of $330 billion worldwide.
                   Together, commercial space activities made up 76% of the global space economy and grew 9.7% in 2014. The
                   remainder was composed of government investments in space, which experienced a combined growth of 7.3%
                   in 2014.

                   U.S. government and military space budgets in aggregate comprised about 54% of space spending by all world
                   governments in 2014. NASA’s budget, which grew 4.6% over the 2013 budget, was 22% of what governments
                   around the world invested in space in 2014. Non-U.S. government space spending grew 12.9%, outpacing space
                   investment growth in the United States, as nations invested in new capabilities or expanded existing ones.

                   Revenue from commercial space products and services, which constituted more than a third of the global space
                   economy, grew modestly—slightly less than 2.5%. Direct-to-home television services dominate this sector,
                   making up more than three-quarters of the global commercial space products and services market in 2014.

                   The biggest growth in 2014 occurred in the commercial infrastructure and support industries sector, which
                   also constitutes more than a third of overall global space revenues. Industries such as launch, ground stations
                   and equipment, and satellite manufacturing were some of the mainstays that helped increase commercial
                   infrastructure and support industry revenues nearly 18% in 2014. High-value military satellite launches
                   decreased, but the number of launches conducted in 2014 increased significantly, rising to levels not seen in more
                   than a decade.

                        3.0 | Space Infrastructure
                   Space infrastructure is associated with launch vehicles, satellite operations and services, human spaceflight, and
                   other critical functions. Rocket launch attempts, the most publicly visible reminder of space activity, increased
                   in 2014 to 92, up from 81 launch attempts in 2013. The United States and Russia conducted the majority of the
                   launch attempts in 2014, but organizations and countries such as the European Space Agency, China, India,
                   and Japan also successfully launched payloads into orbit. New launch systems continued to be explored in 2014,
                   with one company testing space launch vehicle reusability as a possible way to lower the costs of launch objects
                   into orbit. Other companies focused on suborbital rocket flight, hoping to entice potential passengers into an
                   adventure to the edge of space and back.

                   The nature and size of rocket payloads, the satellites, are changing. Of the nearly 300 satellites launched in 2014,
                   slightly less than half weighed 10 kilograms (22 pounds) or less. In 2014, a single Russian space launch vehicle
                   launched and deployed a combination of 33 small satellites and cubesats into low Earth orbit. Some of those
                   deployed satellites eventually deployed more satellites into orbit as well. The size and commonality of parts in
                   cubesats is increasingly attracting researchers, small companies, and schools to invest, build, launch, and operate
                   satellites in space. The International Space Station started to become a launch platform itself, deploying small
                   satellites into orbit.

2   The Space Report 2015 | The Authoritative Guide to Global Space Activity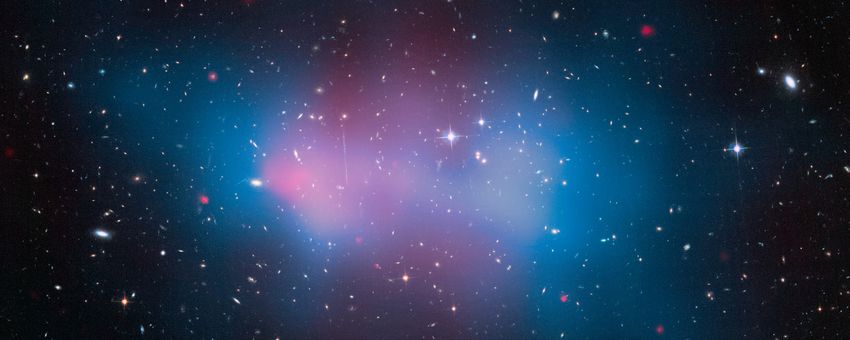
Overview

                   Although the United States spends the most money in space-related activities and industries, it does not currently
                   have its own human-rated space transportation system, instead choosing to buy passage to space from Russia. The
                   U.S. government, in partnership with industry, continued to make progress during 2014 to eventually change this
                   situation. If all goes well, one of NASA’s programs may provide U.S. astronauts direct access to space again by 2017.

                   While NASA will likely continue using established spaceports, other organizations made plans to build, kept
                   building, or finished new spaceports in 2014. One U.S. company broke ground for a new spaceport near
                   Brownsville, Texas, and China was rumored to have completed a new launch site. The Russians continued to build
                   launch facilities in Siberia, hoping to reduce dependence on launch facilities in Kazakhstan. But Russia still wrestles
                   with the question of how to entice a skilled workforce to Siberia to support the new spaceport’s activities.

                        4.0 | Workforce
                   A nation’s space workforce reflects its national priorities. Each spacefaring country’s workforce contains a mix of
                   age, education level, and gender. For 2014, the United States had a civil space workforce that continued to skew
                   older while getting smaller. Japan’s space workforce decreased slightly in 2014 after four consecutive years of
                   growth. European countries continued to foster growth in ESA and the European space industry workforce. In
                   most countries, the space industry is male-dominated, particularly in technical fields, although efforts are being
                   made in many places to increase the number of women in the workforce. The reasons for all these employment
                   fluctuations vary among countries as each makes policy and budget decisions affecting direction and leadership in
                   an increasingly competitive and productive industry.

                   An invitation from the Space Foundation
                   Over the course of the past decade, the Space Foundation research team has gathered an ever-expanding collection
                   of information about the space industry, government policies and priorities, and the evolving trends that influence
                   space activity. Each year, we present the highlights in The Space Report, focusing on the points that we believe are
                   of greatest interest to a broad audience. Beginning in 2015, the Space Foundation is offering an online service that
                   will provide subscribers with access to all the research conducted for The Space Report throughout its existence, as
                   well as new data sets that have never appeared in the report. We hope that this will become an even more valuable
                   resource for the space community, and we look forward to expanding the types of data we offer in response to
                   requests from our readers. To view more information about this new service, please visit www.TheSpaceReport.org.

                                                                                                                                     This Hubble Space
                                                                                                                                     Telescope image shows
                                                                                                                                     the most massive
                                                                                                                                     cluster of galaxies
                                                                                                                                     ever detected, roughly
                                                                                                                                     3,000 times the mass
                                                                                                                                     of our own galaxy. The
                                                                                                                                     blue overlay shows the
                                                                                                                                     distribution of dark
                                                                                                                                     matter, which has to be
                                                                                                                                     inferred from the way it
                                                                                                                                     bends light coming from
                                                                                                                                     more distant galaxies
                                                                                                                                     because the dark matter
                                                                                                                                     itself is not visible.
                                                                                                                                     Credit: NASA, ESA

3   The Space Report 2015 | The Authoritative Guide to Global Space Activity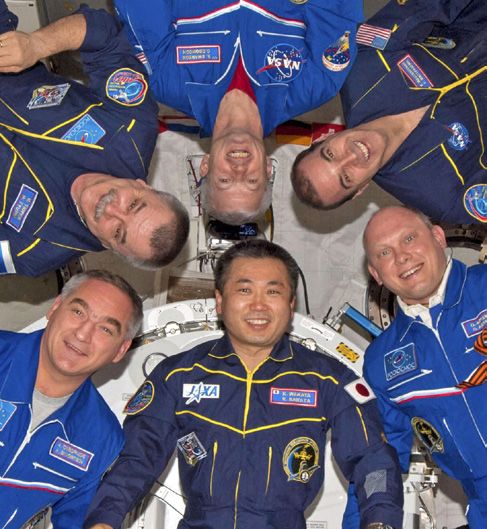
Index of Exhibits

     Overview                                                                   45   EXHIBIT 3e. U.S. Orbital Launches, 2014
     1       EXHIBIT 1. Global Space Activity, 2014                             46   EXHIBIT 3f. Russian Orbital Launches, 2014
                                                                                46   EXHIBIT 3g. Chinese Orbital Launches, 2014
     1.0 | Space Products and Services                                          47   EXHIBIT 3h. Other Orbital Launches, 2014
     5       EXHIBIT 1a. Topics Covered in Space Products and Services          49   EXHIBIT 3i. Spacecraft Mass Delivered by Market, 1995–2014
                                                                                49   EXHIBIT 3j. Number and Mass of Spacecraft Launched by
     2.0 | The Space Economy                                                         Market, 2014
     14      EXHIBIT 2a. Topics Covered in The Space Economy                    50   EXHIBIT 3k. Mass Launched by Intended Orbit, 1995–2014
     14      EXHIBIT 2b. The Global Space Economy                               50   EXHIBIT 3l. Spacecraft Mass Delivered by Manufacturer
                                                                                     Country, 1995–2014
     14      EXHIBIT 2c. Global Space Activity, 2014
                                                                                51   EXHIBIT 3m. Number and Mass of Spacecraft Launched by
     14      EXHIBIT 2d. Revenues for Space Infrastructure, 2014
                                                                                     Mission, 2014
     15      EXHIBIT 2e. Orbital Launch Attempts, 2014
                                                                                51   EXHIBIT 3n. Number and Mass of Spacecraft Launched by
     15      EXHIBIT 2f. Launch Services Value by Market, 2012–2014                  Prime Manufacturer Country, 2014
     15      EXHIBIT 2g. Spacecraft Value by Market, 2012–2014                  51   EXHIBIT 3o. Geosynchronous Communications Capacity
     16      EXHIBIT 2h. Spacecraft Value by Manufacturing Country,                  Launched Per Year and Per Band, 1995–2014
             2012–2014                                                          52   EXHIBIT 3p. Total Available Geosynchronous Communications
     16      EXHIBIT 2i. NASA Commercial Crew Funding                                Capacity Per Year and Per Band, 2000–2014
     18      EXHIBIT 2j. Space Insurance Industry Estimates, 1994–2014          52   EXHIBIT 3q. Total Available Geosynchronous High Throughput
     18      EXHIBIT 2k. Revenues for Commercial Space Products and                  Satellite Capacity per Year and Per Band, 2004–2014
             Services, 2014                                                     52   EXHIBIT 3r. Civil Government and Commercial Satellite
     19      EXHIBIT 2l. North American Direct-to-Home Television                    Communications Contracts By Contractor Country, 2000–2014
             Revenue, 2014                                                      53   EXHIBIT 3s. Positioning, Navigation, and Timing Systems,
     21      EXHIBIT 2m. Earth Observation Revenue Estimates,                        December 2014
             2007–2013                                                          61   EXHIBIT 3t. Spaceports in Operation or Development, 2014
     22      EXHIBIT 2n. Government Space Budgets, 2014
     22      EXHIBIT 2o. Government Space Budget Growth, 2012–2014              4.0 | Workforce
     23      EXHIBIT 2p. U.S. Government Agency Space Budgets, 2014             64   EXHIBIT 4a. Topics Covered in Workforce
     23      EXHIBIT 2q. NASA Fiscal Year 2016 Budget Request                   64   EXHIBIT 4b. Space Workforce Trends in the United States,
     24      EXHIBIT 2r. Funding for Major U.S. National Security Space              Europe, and Japan
             Programs, Fiscal Years 2011–2015                                   65   EXHIBIT 4c. U.S. Space Industry Employment by Sector, 2003,
     26      EXHIBIT 2s. Canadian Space Agency Spending Profile by                   2008, 2012, and 2013
             Program Activity                                                   65   EXHIBIT 4d. U.S. Space Industry Core Employment, 2003–2014
     27      EXHIBIT 2t. Space Spending as a Percentage of Gross Domestic       65   EXHIBIT 4e. U.S. Space Industry Employment and U.S. Total
             Product (GDP), Selected Countries                                       Employment, 2003–2014
     28      EXHIBIT 2u. European Commission Budget for H2020/Space,            66   EXHIBIT 4f. U.S. Space Industry Salaries and Real Salary Growth
             2014–2015                                                               by Sector, 2008–2013
     28      EXHIBIT 2v. ESA Member Contributions to 2014 Budget                67   EXHIBIT 4g. NASA Civil Servant Workforce, FY 2005–2015
     29      EXHIBIT 2w. ESA’s 2014 Budget by Program and Funding Source        68   EXHIBIT 4h. NASA Civil Servant Workforce Age Profiles Over
     30      EXHIBIT 2x. CNES Planned Spending by Program Area, 2014                 Time
     33      EXHIBIT 2y. Indian Space Budgets                                   68   EXHIBIT 4i. NASA Civil Servant Workforce Demographics, Start
     34      EXHIBIT 2z. Japanese Space Spending by Agency, 2014                     of FY 2015
     36      EXHIBIT 2aa. Republic of Korea Government Agency Work on           69   EXHIBIT 4j. U.S. Air Force Space Workforce, FY 2004–FY 2014
             Satellite Applications, 2014                                       69   EXHIBIT 4k. U.S. Air Force Space Workforce Demographics,
     37      EXHIBIT 2bb. South Korean Government Institutions Working               FY 2014
             with Satellite Imagery Applications, 2014                          71   EXHIBIT 4l. U.S. Space-Related Occupations and Projected
     38      EXHIBIT 2cc. Space Budgets of Selected Additional Countries,            Growth Rates
             2014                                                               71   EXHIBIT 4m. European Space Industry Employment, 2003–2013
     39      EXHIBIT 2dd. Summary of Global Space Activity Revenues and         71   EXHIBIT 4n. European Space Industry Employment by Country,
             Budgets, 2012–2014                                                      2008–2013
                                                                                72   EXHIBIT 4o. European Space Workforce Demographics, 2013
     3.0 | Space Infrastructure                                                 72   EXHIBIT 4p. ESA Workforce Demographics, 2014
     42      EXHIBIT 3a. Topics Covered in Space Infrastructure                 72   EXHIBIT 4q. Japanese Space Industry Employment, 2003–2013
     43      EXHIBIT 3b. Number of Launches Attempted and Payload Mass          72   EXHIBIT 4r. Japanese Space Industry Employment by Sector,
             Aboard Attempted Launches, 1983-2014                                    2008–2013
     43      EXHIBIT 3c. Geosynchronous (GSO) and Non-geosynchronous            72   EXHIBIT 4s. JAXA Workforce, 2004–2014
             (NGSO) Historical Commercial Launches and Launch Forecast,         72   EXHIBIT 4t. JAXA Workforce Demographics, 2014
             2015                                                               73   EXHIBIT 4u. Space Agency Employment for Selected Countries,
     44      EXHIBIT 3d. Commercial Satellite and Launch Forecasts,                  2014
             2016–2024

81   The Space Report 2015 | The Authoritative Guide to Global Space Activity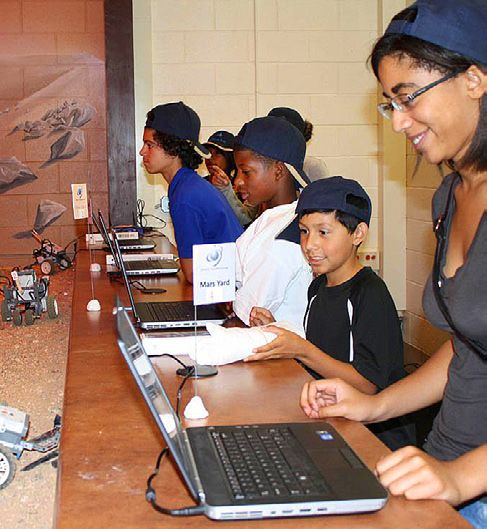
www.SpaceFoundation.org

          TO ADVANCE SPACE-RELATED
                  ENDEAVORS
            TO INSPIRE, ENABLE, AND
              PROPEL HUMANITY.

World Headquarters and Discovery Center                           Washington Office
        4425 Arrowswest Drive                              1655 N. Fort Myer Drive, Suite 910
      Colorado Springs, CO 80907                                 Arlington, VA 22209
            +1.719.576.8000                                         +1.202.618.3060
You can also read