Carbon leakage myth buster - Carbon Market Watch Policy Briefing October 2015
←
→
Page content transcription
If your browser does not render page correctly, please read the page content below
Carbon leakage myth buster
               Carbon Market Watch Policy Briefing
                                   October 2015
Executive summary
    The current EU ETS rules have granted preferential treatment to industrial companies deemed at risk of “carbon leakage”
    in the form of awarding free pollution permits. The ongoing legislative process to revise the EU ETS rules for the post-
    2020 period provides an important opportunity to revisit the rules under which industrial sectors may be deemed at risk
    of carbon leakage. The current rules are in urgent need for reform for the following three reasons:

     1. To date there has been no compelling evidence that EU’s climate policies are forcing companies to move
        abroad and recent academic studies indicate that this is also unlikely to happen in the future even with a complete
        phase-out of free pollution permits.

     2. Free allocation has disincentivised companies to invest in sustainable technologies. The result is that certain
        European industries have fallen behind the global average in carbon efficiency and saw their competitive advantage
        decrease. Phasing-out free allowances and increasing the share of auctioned allowances can mobilise up to €160
        billion that can be ring-fenced for low-carbon breakthrough technologies in industrial sectors.

     3. Handing out free pollution permits has led to windfall profits at the expense of taxpayers. These windfall
        profits are the result of industries letting their customers pay the price for freely obtained carbon permits. Certain
        industrial sectors are furthermore over-allocated with free carbon permits due to flawed EU ETS rules: companies
        receive free carbon permits based on historical production levels even if current production levels are cut by almost
        half. These excess emission rights can be sold for a windfall profit in the market.

     This policy brief sheds light on the myths of carbon leakage and gives recommendations how to change the current rules
     in the overview table on page 10 and 11.

     Key recommendations
     •   Phase out the free allocation of pollution permits by gradually increasing the share of allowances to be auctioned
         from 57% in 2021 to 100% in the future

     •   Limit the industrial sectors on the carbon leakage list to those that really need protection

     •   Only compensate industrial sectors on the carbon leakage list for the share of carbon costs that are not passed on
         to customers

     •   Do not give free pollution permits to sectors that are not on the carbon leakage list (and hence not at risk of carbon
         leakage)

2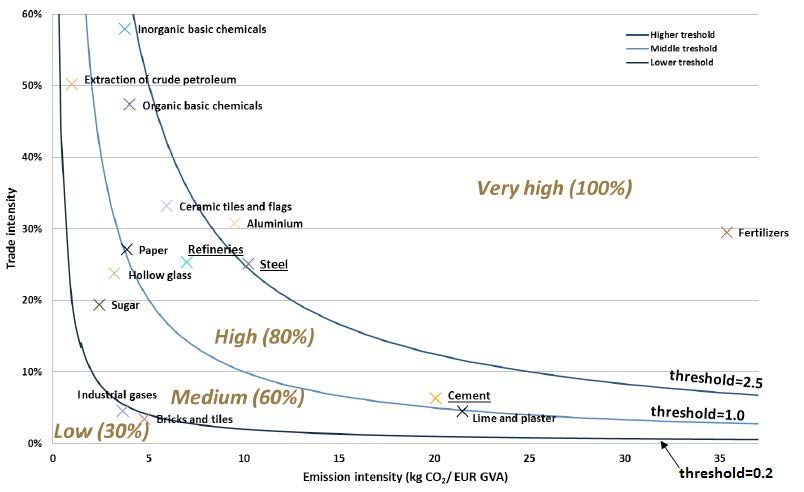
“Carbon leakage” – the threat of production relocation due to the EU ETS
The EU Emissions Trading System (EU ETS) covers just over 40% of the EU’s greenhouse gas emissions from the industry and
power sector. After each year, companies participating in the system must surrender enough allowances to cover all of their
emissions. Since 2013, power generators have to buy all of their allowances to emit CO2 at auction. However, most manufacturing
industries receive up to 100% of their CO2 allowances for free because EU’s policy makers have decided that they are at risk of
“carbon leakage”.

    Carbon leakage is a term used to describe the hypothetical situation where stringent climate policies would force
    companies to move their production abroad to countries with less ambition climate measures to lower their production
    costs. This can lead to a rise in global greenhouse gas emissions.

The provisions to protect the manufacturing industry in Europe for the potential risk of relocation due to the EU ETS are only
valid for the period from 2013 to 2020. Currently, more than 150 sectors, representing more than 97% of industrial emissions, are
deemed to be at risk of “carbon leakage” and receive free pollution permits. Between 2013 and 2020, 6.6 billion allowances will be
given out for free to industry. These free pollution permits have a monetary value of €50 billion1.

A key question is how the concept of “carbon leakage” will be addressed in the next ETS trading round from 2021-2030. Despite
concerns that free allocation rules have not had the desired effects, the European Commission has proposed to continue with
many of the existing rules, including the hand-out of around 6.3 billion free pollution permits in the post-2020 period. Since the
carbon price is expected to increase from around €8 today to an average €25 in the 2021-2030 period, this would represent a
financial subsidy of €160 billion2 to heavy emitters.

Uncovering the “carbon leakage” myth
There has so far been no compelling evidence that the EU’s climate policies are forcing companies to move abroad and recent
academic studies indicate that this is also unlikely to happen in the future:

•     No evidence for production displacement due to the EU ETS so-far: A study commissioned by the Commission concluded
      in 2013 that no conclusive evidence of carbon leakage occurrences can be detected3. Some sectors have observed increased
      imports or decreased exports but this was mainly driven by global demand developments, and not by the EU ETS.

•     No evidence for future “carbon leakage” risk: A recent academic paper published by the London School of Economics
      finds that the future impact of more ambitious climate policies on EU companies moving their production abroad is likely to
      be “extremely limited”. A ten-fold increase in the carbon price would, according to the scientists, cause exports to fall by only
      0.5% and would increase imports by 0.07%, even with 100% auctioning4.

•     Industry confirms lack of “carbon leakage” risks: The manufacturing industries themselves have denied the existence of
      carbon leakage risks. Energy-intensive companies last year reported to their shareowners that the competitiveness risks of
      the EU ETS are not an issue for them5.

•     Many relocation destinations have similar climate policies: The number of countries and regions where companies could
      relocate their production to avoid climate policies diminishes greatly as the global efforts to tackle climate change increase,
      especially in light of the future Paris agreement. Jurisdictions that have put a price on carbon currently account for 40%
      of the global economy6 and the number is growing steadily. China will roll-out a national carbon market from 2017 and
      several regions in the United States and Canada have already implemented emissions trading for example. Carbon prices in
      emissions trading systems around the world are often similar to or higher than the EU ETS price.

•     Industry can pass-through the carbon costs: The impact assessment by the Commission shows that all industrial sectors
      are able to pass-through a significant part of the carbon costs. This means that they have to bear only the remaining part
      of costs (i.e. the costs not passed through to customers). If costs can be passed through, then the risk of carbon leakage
      diminishes or disappears, depending on the percentage of pass-through7.

                                                                                                                                      3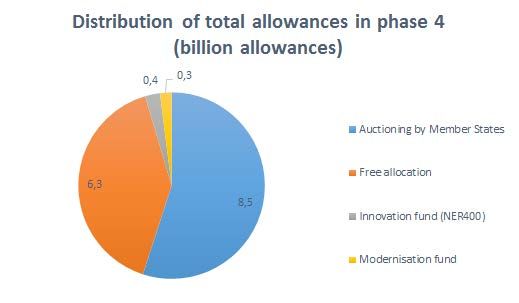
Delivering real investments in the European economy
European industrial companies receive their allowances to emit CO2 for free and are therefore hardly exposed to the carbon
price. That means that European companies are currently not receiving a sufficient price signal to produce more efficiently or
invest in innovative technologies that reduce CO2. A wide range of technological options to reduce emissions in these carbon-
intensive sectors are available that remain unexploited. Free allocation shields industrial sectors from the carbon price signal
and puts European industry at risk of falling behind in deploying low-carbon, state-of-the-art technologies compared to their
competitors abroad. It also fails to reward those companies that have already chosen to shift their production towards efficient,
low-carbon technologies.

At the same time, giving free emission allowances to industry reduces auctioning revenues that could be mobilized by
governments. Taxpayers must then make up the loss of public funds represented by the lower auctioning revenues.
Consequently, free allocation means that less money is available for investments in the low-carbon transition of the European
economy. Moving away from free allocation towards full auctioning of allowances would generate €160 billion in additional
revenues between 2021 and 2030 that could be earmarked to fund breakthrough technologies in industrial sectors.

Europe lacks the abundant availability of cheap labour, energy and raw materials as in other places in the world. This is why
Europe’s industry needs to excel in turning its manufacturing processes into the most energy efficient and innovative in the
world in order to remain highly competitive. Encouraging efficiency improvements through the carbon price and investing the
auctioning revenues in breakthrough technologies in industrial sectors can help achieve this.

        Recommendation how to deliver real investments in the European economy:
        •   Enlarge the innovation fund to an NER1000 by setting-aside one billion allowances. Invest the revenues in the transition
            to a low-carbon economy by supporting the energy and industry frontrunners that want to invest in breakthrough
            technologies in Europe.

    “The EU ETS revision proposes to hand out 6.3 billion free allowances.
       If, instead, these allowances were auctioned, an additional €160
     billion of climate finance could be mobilised and earmarked to fund
                breakthrough technologies in industrial sectors”.

4
Case study: Europe has fallen behind in efficient cement production
Currently, the most efficient cement production occurs in Asia, particularly India and China8. This is because the European cement
industry still uses older and less efficient plants, while most investment occurs in emerging markets where the growth in cement
demand is the highest. By giving away free carbon permits there has hardly been a sufficient economic incentive to leverage
emission reduction options in the cement sector. This has even led to the situation in which cement companies could financially
profit from the EU ETS by selling their surplus of freely obtained carbon permits. According to Lafarge’s 2014 annual report9, the
group has been able to make almost €500 million windfall profits from the EU ETS in the last 5 years, through the sales of excess
carbon permits.
Subsidizing pollution through the allocation of free carbon permits results in less money being available for investments in
breakthrough technologies. This has halted the development of technologies necessary to significantly decrease the energy and
carbon intensity of cement production. Producing cement from magnesium silicates for example will significantly reduce CO2
emissions as magnesium does not contain carbon, in contrast to limestone which is traditionally used to make cement. Further
development of magnesium silicates however appear to be halted due to financial constraints. An enlarged innovation fund
could help make Europe’s cement production more competitive by making available additional financial resources for efficiency
and innovation.
Figure 5: Energy consumption per tonne of cement clinker above benchmark in 2011.
Cement production is particularly efficient in some Asian countries.
USA
United Kingdom
Poland
Egypt
France
Germany
Canada
European average
Czech Republic
Austria
Italy
Brazil
Global average
Spain
Morocco
China
Philippines
Thailand
India
0 5 10 15 20 25 30
Distance to best availiable technology in %
Source: Based on Cement Sustainability Initiative - GNR database.
5Windfall profits for polluters
Some energy-intensive corporations have used the EU ETS to increase their cash flows by using the theoretical risk of carbon
leakage as an argument to receive pollution subsidies from governments. These companies have profited from the EU ETS in the
following ways:
1. Industries have generated windfall profits by letting their customers pay the price for freely obtained carbon permits.
2. Industries have received more carbon credits for free than they actually need, and are able to sell their over-allocation for a
windfall profit in the market.
3. Industries in several countries are subsidized for the hypothetical risk of “indirect carbon leakage”.
Windfall profits from passing on non-existent carbon costs
Several carbon-intensive industries that are not at genuine risk of carbon leakage are still receiving all of their carbon credits for
free. These corporations are able to cash in these freely obtained allowances by letting their customers pay for their non-existent
carbon costs.
Numerous studies including an analysis by Commission10 have found that companies pass through at least part of the costs of
carbon pricing to consumers. The steel and refineries sectors for example pass through 60%-100% of the market price of carbon
to their consumers. This has resulted in windfall profits in the order of €25 billion, assuming an average 50% cost-pass through
rate11.
The Commission therefore underlines that “all sectors analysed would be expected to gain windfall profits” in the post-2020
period based on the current EU ETS revision12. In the steel sector alone for example, the proposed EU ETS revision will lead to at
least €1.3 billion windfall profits, according to the Commission’s analysis13. This stands in contrast to the EU Council Conclusions
of October 2014 stressing that the consideration to “avoid windfall profits will be taken into account”.
Overview of the range of avarage cost pass- through in selected sectors from literature
Sector Product Minimum Maximum # of Estimated in
studies
Iron and steel Flat products 60% 100% 3 McKinsey(2006); Vivid Economics (2014); CE Delft (2010)
sector
Long Products 66% 80% 2 McKinsey(2006); Vivid Economics (2014);
Cement Portland cement, 35% 70% 4 McKinsey(2006); Vivid Economics (2014); Walker (2008); Alexeevi-Talebi (2010)
white cement
Glass Container glass 20% 50% 2 Vivid Economic (2014); Oberndorfer (2010)
Hollow and other 30% 80% 3 Vivid Economic (2014); Oberndorfer (2010); Alexeevi-Talebi (2010)
glass
Refineries Petrol 60% 120% 5 McKinsey(2006) ; Vivid Economic (2014); CE Delft (2010); Alexeevi-Talebi (2010);
Oberndorfer (2010)
Diesel 40% 70% 4 McKinsey(2006) ; Vivid Economic (2014); CE Delft (2010); Oberndorfer (2010)
Petrochemi- Plastic, PE PVC, PS 25% 80% 3 CE Delft (2010); Alexeevi-Talebi (2010); Oberndorfer (2010)
cals
Fertilizers Fertilizers and 0% 75% 2 Alexeevi-Talebi (2010); Oberndorfer (2010)
nitrogen com-
poundsWindfall profits from over-allocation
Carbon-intensive industries have in the past received more free carbon credits than they actually need, and are able to sell off the
surplus carbon credits for a profit in the market. This is the result of flawed rules in the EU ETS directive. Companies receive free
emission allowances based on historical production levels even if current production levels are cut by almost half. Industries that
run their factories at low production levels can use this loophole to receive up to twice as many emission allowances for free than
they actually need. This surplus of freely acquired allowances can be sold on the carbon market for a profit. This has sometimes
led to the perverse situation in which industrial factories tried to maximize their windfall profits by reducing production levels
and cashing in the resulting surplus allowances.
The European Commission found that during 2005-2012, industrial sectors accumulated a considerable surplus of free allowances
of around one billion. If sold on the market against today’s prices, these industries are able to generate a windfall profit of €8
billion.
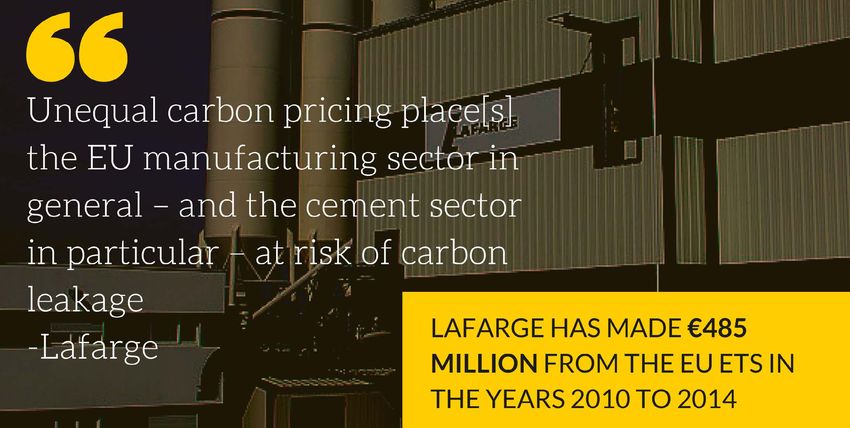
Case study: ArcelorMittal steel factory in Florange (France)
The world’s largest steel company has reduced the production levels of several of its factories in Europe due to the
economic crisis. Yet each installation was still able to receive as many emission allowances for free as it would when
running at full capacity. This has led to unions members accusing ArcelorMittal of artificially inflating its balance sheet
by selling freely obtained pollution permits when it reduced production at its steel plant in Florange (France)14.
ArcelorMittal has so far been able to build-up a surplus of 140 million freely obtained emission allowances15. By selling
these surplus emission allowances ArcelorMittal has generated $500 million windfall profits in the last five years
(around €440 million)16.
THE STEEL COMPANY HAS MADE
MORE THAN €400 MILLION
FROM THE EU ETS IN THE LAST
FIVE YEARS
THE STEEL COMPANY HAS MADE 7Compensation for energy costs
Electro-intensive companies in several countries17 are subsidized for “indirect costs”18 that are the result of higher energy bills
because of the possible impact of the EU ETS on electricity prices. A study for the Commission has concluded that indirect costs
did not have a significant effect on the risk of carbon leakage in most industries19. Indirect costs can be avoided if a company buys
renewable electricity, since there are no carbon costs associated with producing energy from renewable sources. Compensating
electro-intensive industries for their indirect coal consumption hampers the transition to an efficient, climate-friendly energy
system as it reduces the incentive to purchase low-carbon electricity. Little information is available on the amount of subsidies
that are given to industry to compensate them for their high-carbon power consumption. The Netherlands has for example
made available €50 million for the year 2015 alone20.
Recommendations how to avoid over-subsidizing polluters:
• Phase out the free allocation of pollution permits and start auctioning more emission allowances to avoid subsidies for
carbon pollution in the order of €160 billion in the 2021-2030 period.
• Do not allow the use of state aid to compensate industry for indirect carbon costs so that incentives remain for the
transition to a low-carbon energy system.
The formula to determine the amount of free pollution permits
Industrial sectors are given free emission allowances to protect them from EU’s carbon pricing instrument in order to
address the hypothetical risk of “carbon leakage”.
The formula to determine the amount of free allocation for a certain company (both in the current situation as well as
under the newly proposed rules) is:
Free allowances = historic production level x benchmark value x percentage free allocation x correction factor
Benchmark value The amount of free allowances that an installation receives is determined mainly by performance
benchmarks. These benchmarks reflect the greenhouse gas emission performance of the best installations in the EU
producing a specific product.
Percentage of free allocation Industrial sectors that are deemed to be exposed to the risk of “carbon leakage” are
put on the so-called “carbon leakage list” and receive 100% of their allowances up to the benchmark for free. Two
parameters are assessed in order to determine the exposure of each industrial sector to the risk of “carbon leakage”:
their trade intensity (imports and exports) and their emissions intensity. The other industrial sectors not on the list
receive less for free.
Correction factor The maximum amount of free allowances is fixed to a certain percentage (±40%) of the total available
emission allowances. This is to ensure that the amount of allowances available for auctioning and delivering fiscal
revenue to Member States remains predictable. In years in which the demand for free allowances exceeds the fixed
limit, a cross-sectoral correction factor is applied to reduce the amount of free allocation to each industrial installation
accordingly.
8The EU ETS revision proposal
The EU ETS revision21 presented in July 2015 proposes to make available free emission allowances to all industrial sectors,
whether they are at risk of relocating or not. The exposure to “carbon leakage” is determined by the multiplication of the trade
and the emissions intensity of an industrial sector. If the resulting value is above the 0.2 threshold (emissions intensity x trade
intensity>0.2), the sector receives 100% allocation of free allowances, else the sector receives 30% for free. The figure from the
Commission shows that even industries that are hardly at risk of relocating as a result of the EU ETS (sugar, cement, lime) would
be eligible for 100% free allocation. In total 94% of industry’s emissions will be on the “carbon leakage list” and receive 100% for
free.
The total number of free allowances is capped to a certain limit in order to protect the auctioning revenues of Member States.
Since almost all of industry’s emissions are covered by 100% free allocation, it is very likely that the limit on the amount of free
allowances will be exceeded. This makes it necessary to apply the correction factor in the post-2020 period to reduce the amount
of free allocation to each industrial installation accordingly. This situation can be avoided if the 100% free allocation of emission
allowances is reserved for those industrial sectors that are really considered to be at risk of relocation due to the EU ETS. Raising
the threshold for 100% free allocation to 2.5 for example would guarantee that the steel, aluminium and fertilizer sectors are
able to receive 100% of the required allowances for free with little risk that the correction factor reduces their number of free
allowances.
SWD (2015) 135, Impact Assessment accompanying the EU ETS revision
9Overview table comparing current rules with the EU ETS revision and
recommendations
Current carbon leakage EU ETS revision proposal Recommendations
provisions
Over phase 3, ±40% of the total EU Member States decided that the current The minimum share of allowances to be
allowances will be allocated for free share of auctioned allowances (57%) auctioned should gradually increase from
to industry. If the total amount of free should not decline after 2020, which 57% in 2021, to 100% auctioning in the
allowances exceeds ±40% of the total ETS means that a uniform correction factor is future. Auctioning is the most cost-efficient,
cap, the cross-sectoral correction factor applied to the amount of free allowances to simplest, fairest, and most transparent way
is applied to reduce the amount of free all industries if it exceeds ±40% of the total to allocate allowances, fully reflecting the
allowances to all industries. ETS cap. polluter-pays principle. The modernization
fund should be monetized by the European
Investment Bank and should therefore come
on top of the Member States’ auctioning
share.
Industrial sectors not at a risk of carbon Industrial sectors that are not at risk of Industrial sectors that are not on the
leakage receive 80% for free in 2013, carbon leakage (and hence are not on the carbon leakage list (and hence not at risk
down to 30% in 2020, with a view to carbon leakage list) will still receive 30% of carbon leakage) should not receive any
reaching no free allocation in 2027 for free up to 2030 free allocation after 2020
The validity of the carbon leakage list is The validity of the carbon leakage list will The validity of the carbon leakage
5 years. The carbon leakage list identifies be 10 years. list should be no longer than 5 years.
which industrial sectors are deemed to be Regularly updating the list is important
at risk of carbon leakage and receive 100% to make the list responsive to the rapidly
free allocation. changing global market developments
Currently 97% of industry’s emissions Around 94% of industry’s emissions will Sectors that are not deemed to be
receive 100% free allocation. be on the carbon leakage list and receive exposed to carbon leakage (“high risk”)
The carbon leakage criteria to determine 100% free allocation22. should not receive any free allowances
who is on the list and who is not is based The carbon leakage criteria are based on from 2021 onwards. That means that
on the trade intensity and/or the carbon the multiplication of the trade intensity sectors falling below the 2.5 threshold
costs of total production costs. and the carbon intensity. Everyone should not be able to receive any free
above the 0.2 threshold gets 100% free allowances. This will significantly reduce
allocation, even though only sectors above the share of industry’s emissions on the
the 2.5 threshold are at very high risk of carbon leakage list and reserve the limited
carbon leakage. amount of free allowances to those sectors
that could really be at risk of relocation
The trade intensity criterion to assess The trade intensity criterion to assess The trade intensity criterion should
the extent to which sectors are at risk of the extent to which sectors are at risk of exclude trade with countries that have
carbon leakage does not exclude trade carbon leakage does not exclude trade implemented carbon pricing policies
with countries that have implemented with countries that have implemented or are participating in the 2015 global
comparable climate efforts to the EU ETS. comparable climate efforts to the EU ETS. climate agreement. These regions are
deemed to have taken comparable efforts
to reduce emissions and hence the import
+ export to these regions will not bring EU
industries at risk of carbon leakage.
No provisions are introduced to take into No provisions are introduced to take into Sectors should not be compensated for
account the ability of industrial sectors to account the ability of industrial sectors to the carbon costs that they can pass on to
pass-through carbon costs to consumers. pass-through carbon costs to consumers. their customers to avoid windfall profits.
The free allocation of allowances to sectors The free allocation of allowances to sectors Sectors on the carbon leakage list should
that pass-through carbon costs will result that pass-through carbon costs will result only be eligible to receive free allowances
in windfall profits. in windfall profits. for the share of carbon costs that are not
passed on to customers, based on the
minimum cost-pass through rates in table
33 of the Impact Assessment.
10Sectors can still be added to the carbon Sectors below the 0.2 threshold (but above Sectors should not be able to enter
leakage list based on a qualitative a 0.18 threshold) can still be added to the the carbon leakage list through a
assessment by the European Commission carbon leakage list based on a qualitative “qualitative” assessment, based on
taken certain criteria into account, but assessment by the European Commission the opinion of Commission officials.
without specifying how taken certain criteria into account, but This ensures that the assessment of the
without specifying how exposure of sectors to the risk of carbon
leakage is made in the most transparent,
democratic and objective way possible.
The historical production data is taken The historical production data are taken Support the Commission’s proposal
from 2005-2008 or 2009-2010 (whichever from the 2013-2017 and 2021-2025 period
is higher)
If companies reduce their production In addition, if companies significantly If companies decrease their production
by more than 50% compared to their increase their production compared to by 10% or more, their allocation of free
historical production level, then their free their historical production level, then allowances should be reduced accordingly
allocation of allowances will be reduced they are entitled to additional free to avoid windfall profits from selling
accordingly. If companies undertake allowances from the New Entrants Reserve. surplus allowances.
significant capacity extension, they are It is unclear what will be considered a
entitled to additional free allowances “significant” production increase or
decrease, currently it is set at more than
50%.
The benchmark values are determined The benchmark values from 2007-2008 are The benchmark values should ideally be
on the basis of performance data of the reduced by 15% for the 2021-2025 period based on the best available product (in
10% most efficient installations in the EU and by 20% for the 2026-2030 period to terms of GHG emission performance) on
in each sector based on their production reflect technical progress since then (= the global market, consistent with the
in the years 2007 and 2008. These average 1% annual improvement rate). top-runner approach. This ensures that
benchmarks will soon become severely If on the basis of submitted production European installations receive an incentive
outdated as the data will be more than two data it appears that the annual progress to keep up with their global competitors.
decades old by 2030. is much higher or lower than 1%, the In case this is unfeasible, the benchmarks
benchmark values are annually reduced by should be annually adjusted by -1.74% up
0.5% or 1.5% instead to 2020 and -2.2% thereafter to be in line
with the reduction of the overall emission
ceiling. This means that the benchmark
values from 2007-2008 are reduced by
27% for the 2021-2025 period and by 38%
for the 2026-2030 period.
Member States may provide compensation Member States should provide State aid for indirect costs should not be
for indirect carbon costs in line with State compensation for indirect carbon costs allowed in order to keep the incentive for
aid rules. in line with State aid rules and use the industry to switch to low-carbon energy
revenues from auctioning in this regard. sources and avoid a distortion of the
internal market. Innovation support could
instead be directed towards industrial
sectors with relative high indirect costs
to enable efficiency improvements or a
switch to renewables.
300 million allowances have been 400 million allowances will be set-aside to The innovation fund (NER400) should
monetized to fund investments in low- fund low-carbon innovations in energy and be enlarged into an NER1000 in which 1
carbon innovation in the energy sector industry (NER400). Additionally, 50 million billion allowances are set-aside to fund
(NER300) allowances from the MSR will fund low- investments in low-carbon innovations in
carbon innovation projects before 2021 the energy and industry sector
11Contact information:
Femke de Jong, EU climate policy advisor
femke.dejong@carbonmarketwatch.org
Carbon leakage myth buster:
Carbon Market Watch Policy Briefing
1. SWD(2015) 135, Impact Assessment accompanying the EU ETS revision see here p. 27
2. SWD(2015) 135, Impact Assessment accompanying the EU ETS revision see here, p. 27
3. See Ecorys’ Carbon Leakage Evidence Project: Factsheets for selected sectors, September 2013
4. LSE (2015), Asymmetric industrial energy prices and international trade, see here
5. See the 2014 letter of the Institutional Investors Group on Climate Change (IIGCC) to president Barroso here
6. ICAP (2015), see here
7. CEPS (2013), Carbon Leakage: An overview, see here
8. Climate Strategies (2014), Staying with the Leaders: Europe’s Path to a Successful Low-Carbon Economy see here
9. Information taken from Lafarge annual reports: €158 million (2010), €177 million (2011), €99 million (2012), €14 million (2013) and €37
million (2014)
10. SWD(2015) 135, Impact Assessment accompanying the EU ETS revision see here, p. 202 table 33
11. In the 2021-2030 period, assuming 6.6 billion free emission allowances that are sold at today’s prices (±€8/tCO2). The 50% cost-pass
through rate is an estimate based on table 33 of SWD(2015) 135
12. SWD (2015) 135, Impact Assessment accompanying the EU ETS revision see here, p. 182 (using the highest cost-pass through rates
found in literature)
13. SWD (2015) 135, Impact Assessment accompanying the EU ETS revision see here, p. 183 table 24 (using the lowest cost-pass through
rates from the literature)
14. See Le Monde (2012) here
15. Sandbag (2014), Slaying the Dragon see here
16. Information taken from ArcelorMittal’s annual reports: $140 million (2010), $93 million (2011), $220 million (2012), $32 million (2013)
and $14 million (2014)
17. The Netherlands, Germany, Greece, the UK, Spain, Belgium (Flanders) and Norway.
18. Installations covered by the EU ETS face direct carbon costs when buying their CO2 emission allowances at auction. Consumers of
energy and industrial products can face indirect costs when the costs of carbon emissions related to their consumption are being
passed through to them. Indirect carbon costs are the logical result of how the “polluter-pays” principle is implemented in the EU ETS.
If a consumer buys a car for example, the carbon costs of the steel used to produce that car are passed on to him or her. The consumer
hence pays indirectly for the carbon pollution it has caused.
19. Ecorys’ Carbon Leakage Evidence Project: Factsheets for selected sectors, September 2013
20. see here
21. COM(2015) 337, EU ETS revision proposal see here
22. Ecofys (2015) see here
This project action has received funding from the European
Commission through a LIFE grant. The content of this section reflects
only the author’s view. The Commission is not responsible for any use
that may be made of the information it contains.
Cover design in this policy brief is not affiliated with, nor authorized, endorsed or licensed in any way, by Hasbro Corp, its affiliates or subsidiaries. It is a parody.You can also read