CIEEM Ireland Spring 2021 Conference
←
→
Page content transcription
If your browser does not render page correctly, please read the page content below
CIEEM Ireland
                   Spring 2021 Conference
Mapping of Dublin urban green spaces (UGS) and historical land use
             change to determine habitat continuity
                    Maryann Harris1,2 and Tamara Hochstrasser1
    1School   of Biology and Environmental Science and Earth Institute, University College Dublin
                    2Dublin   City Council Parks, Biodiversity and Landscape Services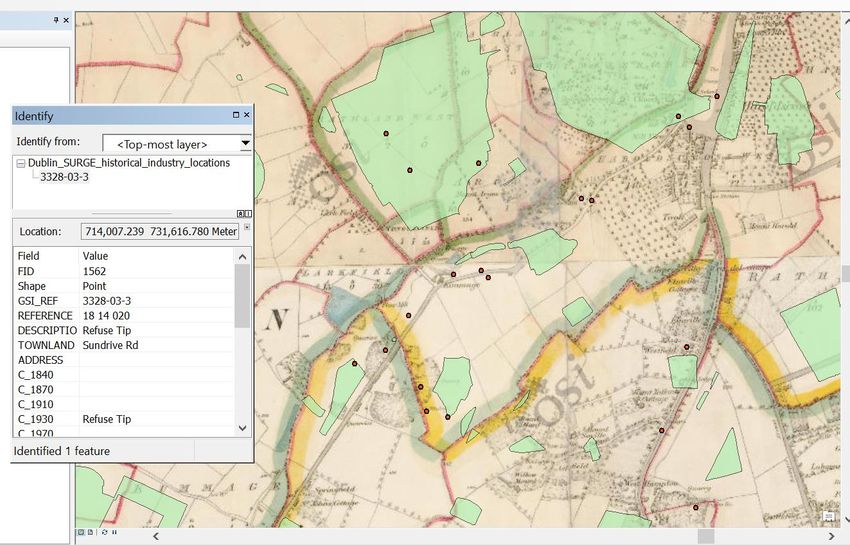
Development of remnant ecosystems of cities
                           (based on Ramalho and Hobbs 2012)

Pre-urban landscape                Transient period of         Re-equilibriation
                                   urbanisation

     • Original                         • Transient species         • Invasion credit of
       biodiversity                     • Extinction debt             exotics
     • Disturbance                      • Past landscape            • Novel ecosystems
       within the system                  influences current        • Remnant
     • Continuous                         biodiversity                ecosystems
       habitats                         • Fragmentation of          • New connectivity
                                          habitats                  • Habitat in patch
                                        • Temporal delays             matrix

                                                                                           2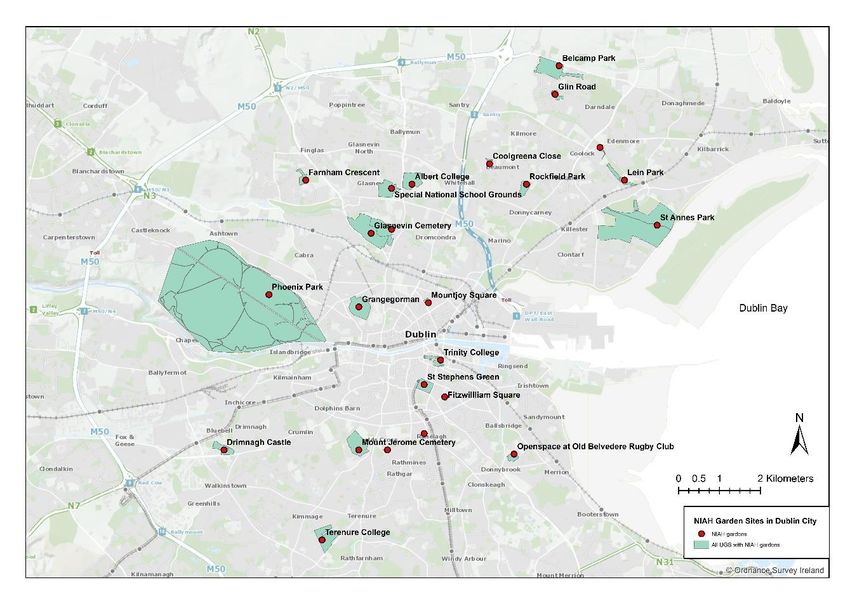
Why does this matter?
“Conservation of urban remnant ecosystems will become increasingly
important for several reasons:
1. Especially in areas with high beta-diversity, remnants provide the only
   remaining habitat for many species.
2. They provide ecosystem services (e.g. water infiltration, microclimatic
   amelioration, sequestration of air pollutants, recreation and aesthetics)
   that improve the urban environment and enhance the wellbeing and
   quality of life of urban dwellers.
3. Urban remnants are the primary connection that many humans have to
   the natural world. Preventing the extinction of this experience is
   important for conservation far beyond city boundaries”.
(Ramalho and Hobbs 2012)
Historical knowledge is needed to implement
Nature-Based Solutions in Dublin
• Need to identify remnant habitats and populations for NBS.
• Age of UGS defines habitat continuity and can be measured to analyse
  factors of urban ecosystems (Onandia et al., 2019).
• So far:
• Limited systematic assessment of UGS in Dublin City at ecosystem level to
  direct NBS.
• Previous ecological studies have been focused mainly on habitat and
  species surveys of individual parks.
• Spatial analysis of UGS in Dublin has primarily focused on audits of
  recreational and amenity characteristics with some inclusion of policies for
  biodiversity in green infrastructure strategies.
• Lack of detail in maps for ecosystem services assessment and targets for
  restoration.
                                                                                 4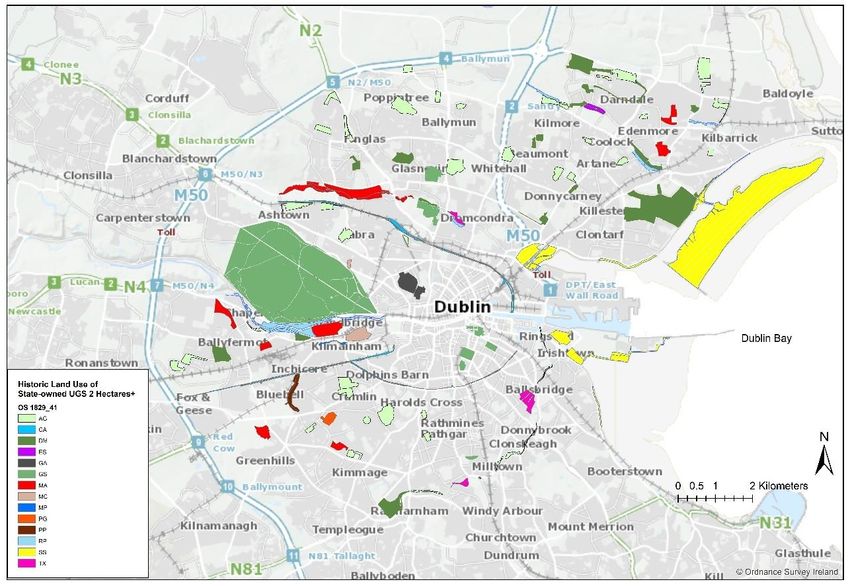
Research Objectives
• To analyse land use history and
  urbanisation of the UGS in terms
  of impacts on biodiversity and
  ecosystems.
• To develop a typology of the
  historical land uses in public UGS
  to determine the continuity of
  habitats in those spaces.

                                       https://www.spookyisles.com/st-stephens-green-dublin/   5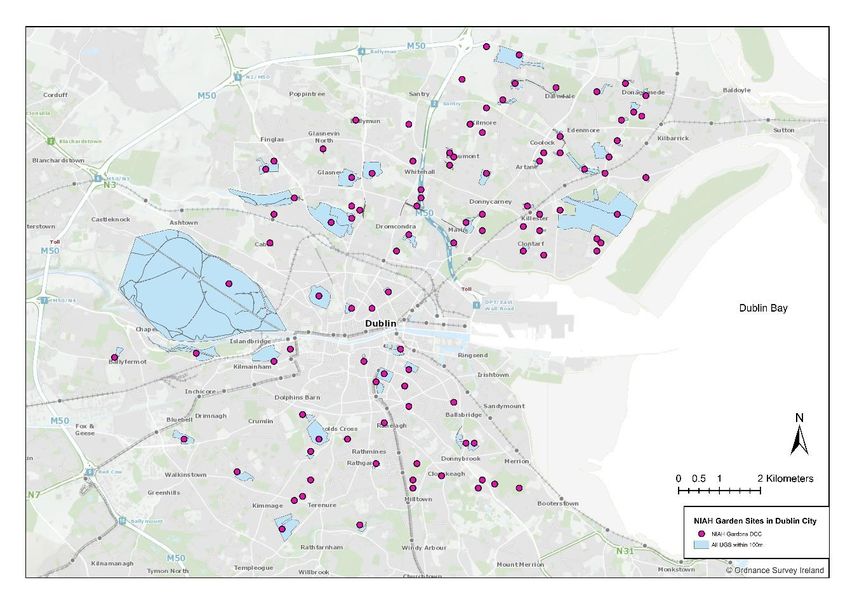
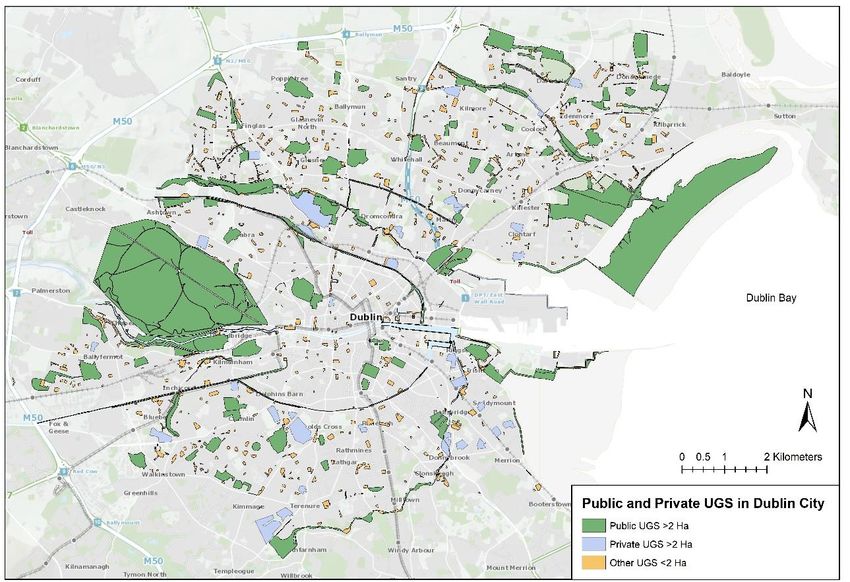
Results - distribution and ownership of UGS
• Of 1,238 polygons mapped
  comprising 300 UGS, 147
  polygons are ≥2 ha.
• 113 UGS sites were confirmed
  as ≥2 ha and in public
  ownership over a total area of
  2,016 ha.
• Within the city centre, there
  are few UGS > 2 ha. Most are
  located north of the River
  Liffey.
• Fragmentation - The biggest
  land banks are not connected.
Base maps: Ordnance Survey Ireland             6
(2019) and Dublin City Council (2016)
Area of UGS                                                60

                                                                51
                                                           50

• Almost half (51/113) of all public

                                        No. of UGS Sites
                                                           40
  UGS are 2-5 hectares in area with                                  32
  the median area calculated at 5.42                       30
  ha.
• Only four UGS > 30 hectares:                             20
                                                                           21

   •   Phoenix Park
   •   North Bull Island
   •   St. Anne’s Park                                     10
                                                                                5
   •   Tolka Valley Park.                                                            1     2   1
• The three largest public parks                           0
  (Phoenix, North Bull Island and St.
  Anne’s) provide 58% (1,163/2,016
  ha) of the public UGS >2 ha in the
  City.                                                                   UGS Area in Ha

                                                                                                   7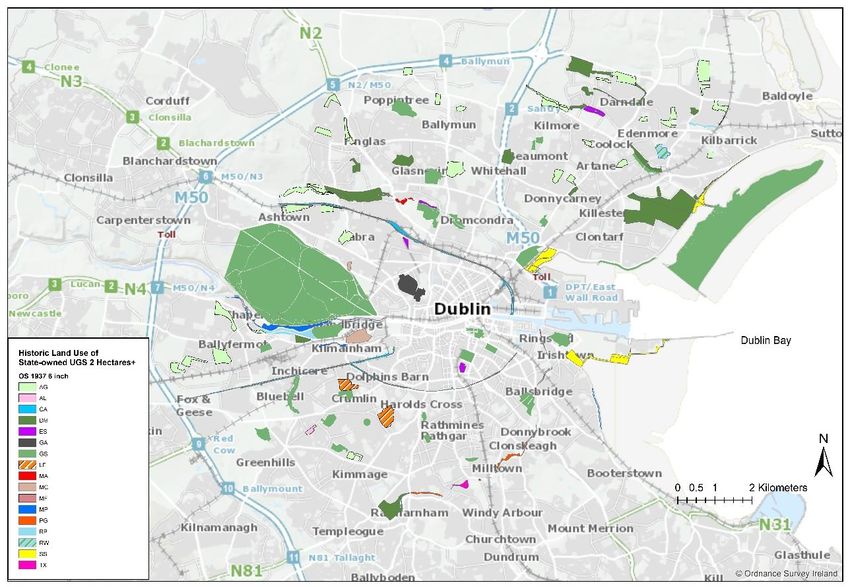
Methods for determining urbanisation
• Year urbanised = UGS was enclosed on at least two sides by built infrastructure (roads,
  buildings) in line with the definition of “green urban areas” in the European Union Urban
  Atlas (Copernicus, 2016).
• 4 key maps used for land use analysis (1757-1937) – Rocque, Ordnance Survey
• Maps obtained from an online viewer with OpenStreetMap (Hollinshead, 2019) which
  are not detailed enough for land use analysis but provide road layouts that indicate
  enclosure of green spaces:
    • British Geographical Section General Staff (GSGS) 3906 series map (GSGS, 1941)
    • Geographia Plan of Dublin (Irish Tourist Board, 1945)
    • Ordnance Survey of 1968 Index to O.S. 1:1000 maps (OSI, 1968)
• After 1968 OS, based on age of housing stock, records of parks (Barry, 1999) and
  reference to the Dublin Ordnance Survey of Ireland Geohive website (OSI, 2019) to view
  recent aerial photography from 1995 to present.
• Intervals of time are determined using Jenks natural breaks classification method (Jenks,
  1967) in ArcMap 10.4.
                                                                                              8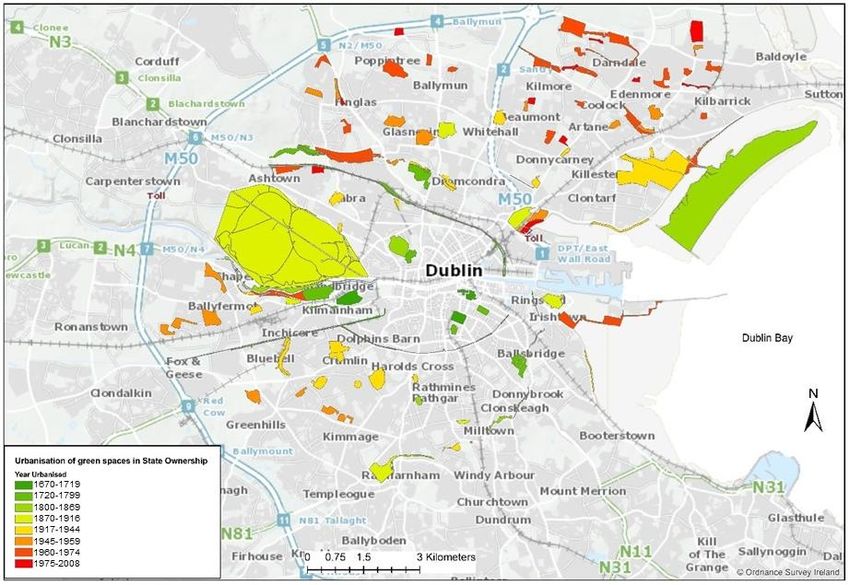
Year of urbanisation of green spaces in State ownership
                                          • 62% were
                                            urbanised since
                                            1945
                                          • Distribution is not
                                            radial
                                          • Concentric a bit
                                            within canals and
                                            prior to 1719
                                          • But suburbs not
                                            uniform gradient
                                            of urban-rural as in
                                            traditional
                                            ecological studies
                                          Ordnance Survey 2019
                                                                   9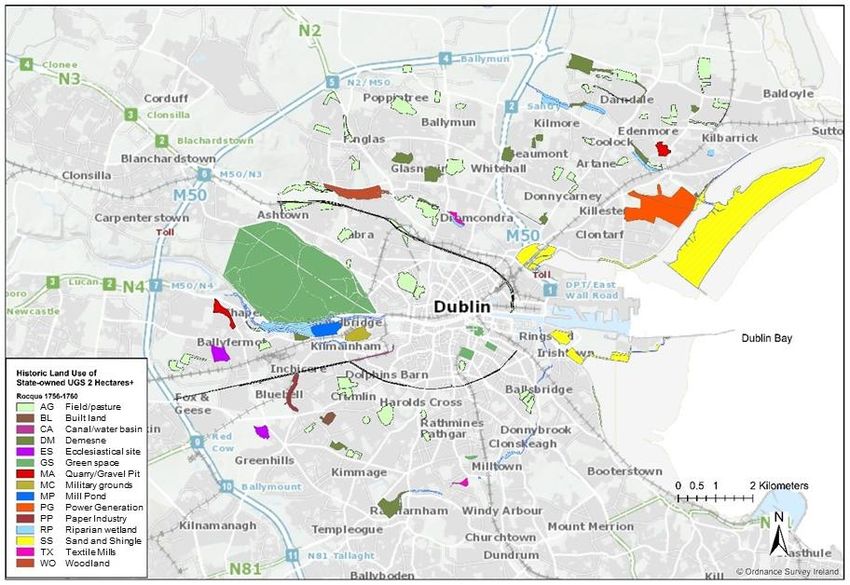
Phases of                                            45

                                                      40

 Urbanisation                                         35

                                NUMBER OF UGS SITES
                                                      30

• Urbanisation of green                               25
  spaces can be seen in three                         20
  phases: 1720-1799, 1917-
  1944 and 1960-1974.                                 15

• 79% (89/113) of public UGS                          10

  ≥2 ha in public ownership                           5

  were urbanised in the past                          0
  century.
• 62% (70/113) urbanised
  since 1945.                                              YEAR OF URBANISATION

                                                                                  10
Categorise historical land uses of patches (public UGS)
• Four key historical maps series were used:
1. Rocque’s Maps of Dublin City and County 1757-1760
2. Historic 6-inch colour (1837-1842) Ordnance Survey map
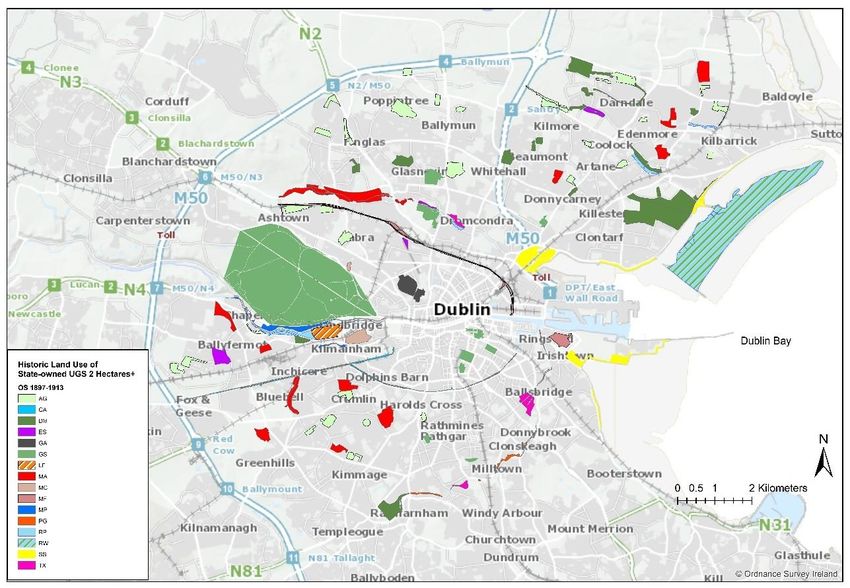
3. Historic 25-inch (1897-1913) Ordnance Survey map
4. 1937-1938 Fourth Edition Six Inch Maps of Dublin Ordnance Survey
• Verification of land uses with multiple sources:
➢ Historic Industries = Geological Survey of Ireland SURGE database (Glennon et al 2012).
➢ Demesnes and Ecclesiastical = National Inventory of Architectural Heritage database (DAHRRG, 2012), DCC Archives.
➢ Landfills = Eastern-Midlands Region Waste Management Plan (2015 – 2021), Noone (2016), interviews, DCC records
➢ Allotments = locations published by Forrest (2011, 2013, pers. comm.)
➢ Woodlands = NPWS database (Perrin and Daly 2010)
➢ DCC Parks and Open Spaces database (DCC 2016)
➢ Historical records
➢ Interviews with DCC staff, grey literature 11Methods: historic industrial activity
• Determine past
industrial uses of
UGS
• GSI SURGE
Historic
Industry
• Historic OS 6”
colour maps
• DCC UGS
• Premium OS
Basemap
• DCC/EMRA
records
• Interviews
• Historical
accounts
• City Archives
• Eamon Ceannt
Park: refuse tip,
clay pit, brick
works
12The perils of point data and landscape fragmentation –
demesnes and current UGS
NIAH dataset is point data for where the actual houses were located (many now destroyed)
Sites (point data) of historic gardens and green spaces of
24 of the NIAH Historic Garden sites (DAHRRG, 2012) national importance as listed in the National Inventory of
directly intersect with 25 of all UGS polygons mapped Architectural Heritage (DAHRRG, 2012) which exist within
by DCC. 100 metres of any public UGS (n=99/113 sites).John Rocque’s Maps of Dublin City and County 1757-1760
• Main UGS within the city
centre originated from 1757
or earlier (Strati, 2005).
• Woodlands mainly along
riparian zones and within
the Phoenix Park.
• Industrial uses of the rivers:
➢ Dodder = Textile
manufacture (TX)
➢ Camac = Pulp and
paper manufacture
(PP)
• Agriculture, demesnes, sand
and shingle and riparian are
most common land uses.
Ordnance Survey 2019
14Ordnance Survey Historic 6" First Edition Colour (1829-41)
• Establishment of many
industrial sites.
• Mineral extraction and
quarrying (MA) were to
the west and northeast.
➢ Navigation and shipping
Construction of North Bull
Wall – island formation.
➢ Both canals (CA) were
built.
• Demesnes (DM) were
established which would
eventually form the key
UGS of the City.
Ordnance Survey 2019
15Ordnance Survey Historic 6" Last Edition B&W (1897-1913)
• Mineral extraction within
the city was prohibited by
legislation and the eskers to
the southwest were heavily
quarried as a result.
• Extensive mineral extraction
and quarrying (MA) taking
place in all areas except the
southeast of the study area.
• The number of demesnes
(DM) established on former
agricultural fields in north
Dublin increased.
• North Bull Island begins to
extend northwards.
Ordnance Survey 2019
16Ordnance Survey Historic 6” B&W 1937
• The sites of current UGS
were predominantly green
spaces (GS), demesnes (DM)
and agricultural lands (AG).
• Landfills (LF) are evident to
the southwest on sites of
former quarries.
• Extensive areas of sand and
shingle (SS) remain.
Ordnance Survey 2019
17180
160
140
120
No. of UGS Sites
100
80
60
40
20
0
AG AL BL CA DM ES GA GS LF MA MC MF MP PG PP RP RW SS TX WO
Land Use Category
Rocque 1756-1760 OS 1829-41 OS 1897-1913 OS 1937 6inch 18Dynamics
of
landscape
change
“Traditional approaches measuring
the degree of urbanisation in study
sites often neglect the temporal
dynamics of landscape change, with
only the most recent spatial
configuration and surrounding land
uses taken into account”
- Ramalho and Hobbs 2012
19Categories of land use and biodiversity impacts
Industrial Built Cultivated (including Natural (area)
(including landfill) allotments)
Description Resource extraction Construction, import of Soil cultivation. Planting Minimal intervention,
materials recreational use
Impact on Significant alteration of Removal of habitat, Active selection of Disturbance, spread of
biodiversity habitats and resources, pollution, restriction of vegetation composition, invasive species
pollution resource access introduction invasive plant
species
Habitat continuity Significant disruption. Permanent alteration and Permanent alteration of Continuous. If disturbed
Change in environmental removal of habitat species composition and chance of recovery and
habitat conditions. soil condition restoration
Number of sites 15 5 (built) 57 2
34 (landfill)
Total area of sites1 241 ha 61 ha (built) 1022 ha 7 ha
685 ha (landfill)
Percentage of total 12% 37% 51% < 1% 20
UGS2In summary
• The result that most of the public UGS (62%) were urbanised since 1945
means that ecological succession after disturbance is still in the early
stages.
• Dublin City has highly fragmented UGS which are highly intensified in terms
of land use and present challenges to maintaining ecological networks.
• Dublin’s biodiversity relies on few large UGS within dense urban matrix.
• Waste disposal sites found 35 locations –mainly wetlands – identified 20
new sites not in EMWR report of historic or legacy landfills.
• Reliance upon single datasets can result in gaps e.g. NIAH point data.
21Discussion
• Some urban-related effects do not decrease in intensity in a simple
linear or concentric pattern from a single centre (McIntyre et al 2000).
• When planning Nature-Based Solutions historical land-use represents
both opportunities and potential limitations:
• Sites of demesnes (DM) important for habitat continuity supports
earlier studies in south Co. Dublin (Kingston et al. 2003)
• Many natural areas maintaining ecosystem functions and services,
particularly wetlands, have a history of waste disposal.
22Recommendations
• Examine private UGS as a support for biodiversity.
• The resulting database identified areas that could be targeted for
ecological restoration and nature-based solutions.
• Further work planned to assess in more detail the relationship
between historical land uses and current biodiversity.
23Acknowledgements
Environmental Protection Agency
Dublin City Council
Principal Supervisor: Dr. Tamara Hochstrasser, UCD
Doctoral Studies Panel: Prof. Thomas Bolger, UCD
Dr. Claire Cave, UCD
Dr. Karen Foley, UCD
Contact: maryann.harris@ucdconnect.ie 24References
Cohen-Shacham, E., G. Walters, C. Janzen, S. Maginnis (eds). 2016. Nature-based solutions to address global societal challenges. Gland, Switzerland:
IUCN. Xiii + 97 pp.
DAHRRG 2012. Historic Gardens Survey. 2017 ed. Dublin, Ireland: Department of Arts, Heritage, Regional, Rural And Gaeltacht Affairs (DAHRRG).
DCC 2014 North Bull Island UNESCO Biosphere Periodic Review Report. Dublin City Council (DCC).
Forrest, M. 2011. Allotments in Dublin 1900-1950. Irish Geography, 44, 265-290.
Forrest, M. 2013. Plots and Plotholders in Dublin 1909-1950. Dublin Historical Record, 66, 3-11.
Glennon, M., Scanlon, R., O’Connor, P. 2012. Dublin SURGE Project database. Dublin, Ireland: Geological Survey of Ireland.
MCDONALD, R., COLBERT, M. L., HAMANN, M., SIMKIN, R. & WALSH, B. 2018. Nature in the Urban Century: A global assessment of where and how
to conserve nature for biodiversity and human wellbeing. Arlington, VA, USA: The Nature Conservancy.
MCINTYRE, N. E., KNOWLES-YÁNEZ, K. & HOPE, D. 2000. Urban ecology as an interdisciplinary field: differences in the use of “urban” between the
social and natural sciences. Urban ecosystems, 4, 5-24.
ONANDIA, G., SCHITTKO, C., RYO, M., BERNARD-VERDIER, M., HEGER, T., JOSHI, J., KOWARIK, I. & GESSLER, A. 2019. Ecosystem functioning in urban
grasslands: The role of biodiversity, plant invasions and urbanization. PLOS ONE, 14, e0225438.
Perrin, P.M. & Daly, O.H. (2010) A provisional inventory of ancient and long‐established woodland in Ireland. Irish Wildlife Manuals, No. 46. National
Parks and Wildlife Service, Department of the Environment, Heritage and Local Government, Dublin, Ireland.
RAMALHO, C. E. & HOBBS, R. J. 2012. Time for a change: dynamic urban ecology. Trends Ecol Evol, 27, 179-88.
Strati, I. 2005. Historical Geographies of Dublin's Public Green Spaces, from Their Origins to 1756. Doctoral thesis. Department of Geography, Trinity
College Dublin.
UNESCO 2016. Culture: urban future; global report on culture for sustainable urban development; summary. In: BOKOVA, I. (ed.). Paris, France:
UNESCO.
25Symbol My category Group GSI Description GSI Type GSI Abb.
AG Agricultural/pasture Cultivated n/a n/a AG Specific land uses of each UGS over
AL
BL
Allotment
Built land
Cultivated
Built
n/a
n/a
n/a
n/a BL
time are analysed for each map.
GA Gaol/asylum/ execution Built n/a n/a
CA Canal/water basin Built n/a n/a
CH Chemical Industrial Glass House Factory Chemical CH
Land uses are then summarised into
CH
DM
Chemical
Demesne
Industrial
Cultivated
Printing Office
n/a
Chemical
n/a
CH
DM
‘Group’ categories to simplify the
ES Ecclesiastical site/church/cemetery Cultivated n/a n/a ES analysis as follows:
FU Fuel Industrial Coal Yard Blank FU
FU Fuel Industrial Gasometer Oil-Gas Industry FU
GS Green space Cultivated n/a n/a GS
•cultivated - includes agricultural
LF Landfill Landfill Refuse Depot MF LF
LF Landfill Landfill Refuse Tip MF LF fields, orchards, gardens, demesnes,
MA
MA
Brick-Clay
Brick-Clay
Industrial
Industrial
Brick Works
Clay Pit
M&A
M&A
BC
BC
churchyards;
MA Gravel Pit Industrial Gravel Pit M&A GR •natural areas -includes unmodified
MA Lime Kiln Industrial Lime Kilns M&A LK
MA Quarry Industrial Quarry M&A QU
riparian wetlands, sand and shingle
MC
MF
Military grounds
Municipal Facilities (MF)
Built
Industrial
n/a
Cleansing Depot
n/a
MF
MC
MF
beaches, woodlands;
MF Municipal Facilities (MF) Industrial Pumping Station MF MF •built -includes buildings, enclosed
MF
MF
Municipal Facilities (MF)
Municipal Facilities (MF)
Industrial
Industrial
Syphon House
Water Works Pressure Station
MF
MF
MF
MF
yards such as military and cavalry
MG Manufacturing and Goods Industrial Factory Blank MG
grounds, reclaimed wetlands, canals
MG Manufacturing and Goods Industrial Goods Shed Blank MG
MP Mill Pond Industrial Mill Pond Blank MP and associated embankments, gaols,
MT
MW
Metal Industry (MT)
Monumental Works (MW)
Industrial
Industrial
Smithy
MW
MT
Blank
MT
MW
prisons and grounds for public
PG Power Generation (PG) Industrial Electricity Station PG PG executions and punishments; landfill
PG Power Generation (PG) Industrial Engine House PG PG
PG Windmill Industrial Windmill Food WM
– includes all waste disposal sites
PP
PP
Pulp-Paper Industry (PP)
Pulp-Paper Industry (PP)
Industrial
Industrial
Axle Tree Mill
Sawmill
PP
PP
PP
PP
•industrial -includes all land uses as
RP Riparian wetland Natural n/a n/a defined by the Geological Survey of
RW
SS
Reclaimed wetland
Sand and Shingle
Built
Natural
n/a
n/a
n/a
n/a
RW
SS
Ireland SURGE dataset as industrial
TX Textile and Woollen Mills Industrial Laundry Textile TX activities
WO Woodland Natural n/a n/a WOConclusions/Take Home Messages
• Recent urbanisation in Dublin has impacts
• Land use change occurs on a continuum
• Phases of urbanisation are evident with periods of intensity and rapid
changes on ecosystem
• Patterns of urbanisation are not concentric and a uniform gradient is
not evident
28Urban KBAs
Biodiverse cities Other KBAs
• Cities have important biodiversity.
• Dublin City has biodiversity of
global importance and is identified
as an Urban Key Biodiversity Area.
• KBAs that will be impacted by
urban growth are shown (top),
where impact is defined as having
more than 5% of their area
urbanised by 2030.
• 10% of KBAs are affected.
• Many of these urban-impacted
KBAs are found in Europe –
including Dublin.
(McDonald et al 2018; IUCN 2020)
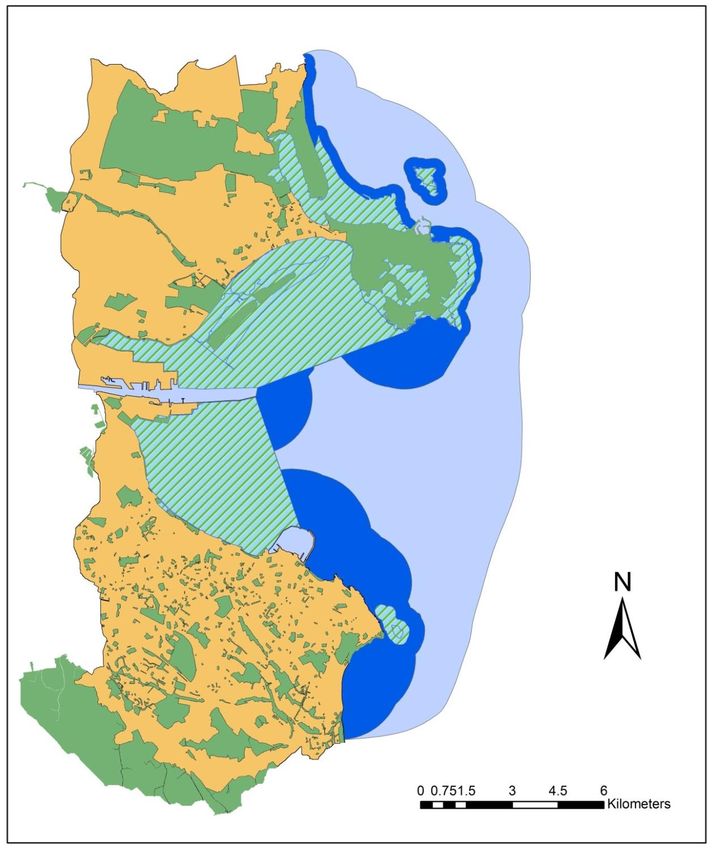
29Dublin Bay UNESCO Biosphere
Baldoyle Bay
Ireland’s Eye
Howth Head
North Bull Island
terrestrial buffer = 51.6 km2
Dublin Bay
So. Dublin Bay
• UGS as a buffer zone to support nature
conservation for core area.
Dalkey I. • Requires an ecosystem-based approach to
UGS management in Dublin City.
• Example of ‘urban biosphere’ (UNESCO 2016).
Source: DCC 2014 30
30Nature-based solutions concepts IUCN (2016)
Category of NBS approaches Examples
Ecological restoration; Ecological engineering;
Ecosystem restoration approaches
Forest landscape restoration
Ecosystem-based adaptation; Ecosystem-based
Issue-specific ecosystem-related approaches mitigation; Climate adaptation
services; Ecosystem-based disaster risk reduction
Infrastructure-related approaches Natural infrastructure; Green infrastructure
Integrated coastal zone management; Integrated
Ecosystem-based management approaches
water resources management
Area-based conservation approaches including
Ecosystem protection approaches
protected area managementYou can also read