2013 CANADA REPORT - CIFFC
←
→
Page content transcription
If your browser does not render page correctly, please read the page content below
CANADA REPORT
    2013
CANADA REPORT
                                         2013

It would be safe to say to that 2013 could easily be compared to 2012 when you consider the level of
activity at CIFFC from an exchange of resources perspective. Some of the other comparisons that
could be made between the two years would be: Fire start, the National Preparedness Levels (NPL)
and the number of resource requests. Although this information may not be data driven, from a coor-
dination point of view, ;you could look at all three throughout the year
and see that 2013 is very comparable to 2012. Something that we
had not seen for a number of years in 2013 was the fire activity at the
same time from agencies at opposite ends of the country with both
the Yukon Territory (YT) and Newfoundland Labrador (NL) experi-
encing higher than normal fire activity. Other agencies such as the
Northwest Territories (NT) and Quebec (QC) also saw some chal-
lenging times during 2013. You could summarize 2013 as the fire
season that was not overly busy but rather steady from a CIFFC
standpoint.

The start of the season was extremely quiet, with a long and it
seemed extended winter, coupled that with a slow melt, this led to YT crew doing classroom training
one Canada‘s quietest start to fire season since CIFFC was first es-
                                       tablished back in 1982. From a mobilization perspective, 2013
                                       started off very similar to 2004, where CIFFC only completed
                                       one resource request before June 5th. Although the season
                                       started slow, the thought of matching 1992 (only 32 resource
                                       orders) was never entered our minds as many of the agencies
                                       had forecasted normal to above normal temperatures for the
                                       fire season. Alberta (AB) for example started the season on
                                       March 1st, due to drier conditions, having to advance the posi-
                                       tioning of their Wildland Firefighters (WFF) across the provinc-
               AB CL-215T
                                       es in preparation for the early fire conditions. Historically in
                                       Canada, the fire season runs from April 1st to October 31st.
                                       The slow start to the season can also be a benefit to fire man-
agement agencies, as it allows them to get their mandatory training in (sometime in snowy condi-
tions), get their equipment up to standard and more importantly allowing the airtanker pilots to get
their spring new and recurrent training completed.

The start of fire season also allowed some agencies to look at
their prescribed burning and fuel treatment projects. Pre-
scribed burning is the knowledgeable application of fire to a
specific land area to accomplish predetermined forest man-
agement or other land use objectives and fuel treatment is the
treatment of living or dead forest fuels to diminish the likeli-
hood of a fire starting, and to lessen the potential rate of
                                                                      BC staff doing fuel reduction burning
spread and resistance to control.

                                                                                                              2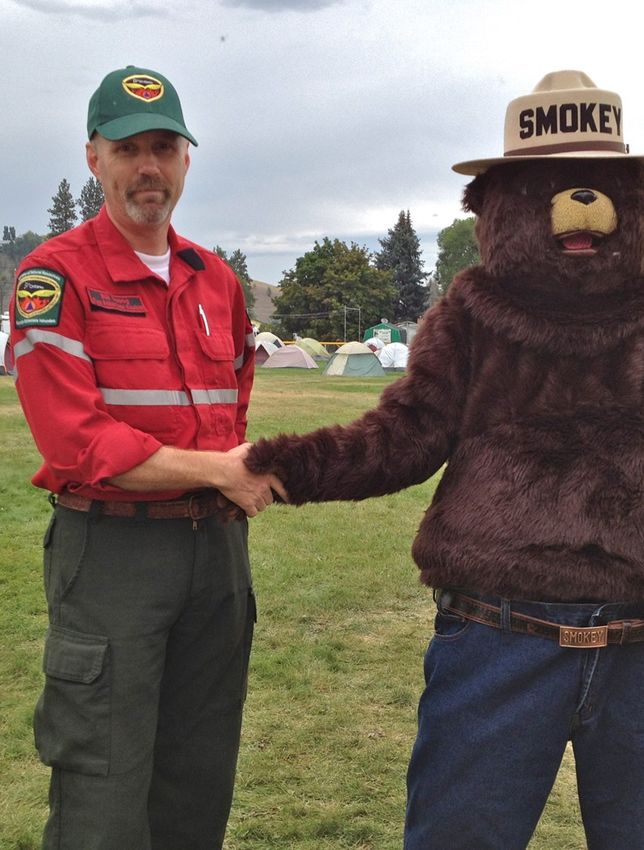
The first sign of fire season in Canada is the beginning of the CIFFC National Wildland Fire Situation
Report (SitRep) in April. The SitRep provides the general public a summary of wildland fire activity in
Canada with information on fire numbers, hectares consumed, Agency
Preparedness Level (APL) as well as historical statistical information. For
some like QC, in early April they were already starting to suspends some of
their burning permits due to the fact that the fire danger was high in several
areas while also getting their prevention message out to inform the public to
be cautious. Agencies spend months preparing for the season with their pre
-suppression plans; prescribe burns, prevention, training of staff, etc.
Until the grass starts to green up and we see leaves on the trees, spring
fires can be some of the most challenging fires, as these types of fires can
move very fast in a short period of time. Agencies like AB and QC were
already seeing 20+ human caused fires per day with AB already at an APL
4. For others, although the majority of their staff are trained in wildland fire
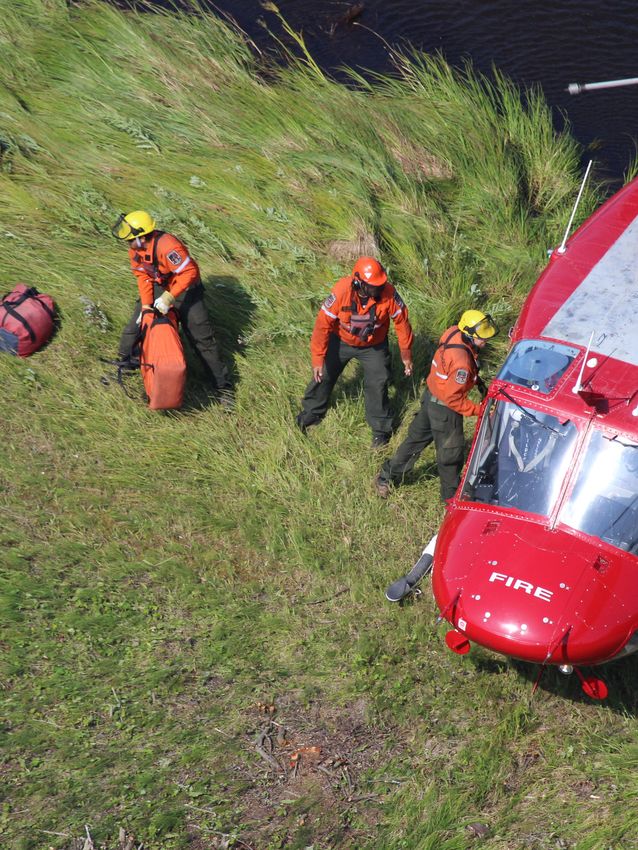
management, many are often called upon to support other incidents such as ON - Bill Droog with Smokey Bear
floods. Wildland fire personnel bring a wide range of skills such as: understanding command and
control, first aid, chainsaw operations and safety, working around helicopters, team structure, self-
sufficient, etc. By-mid April, we were starting to have seasonal
temperatures which brought the fire hazard down. The
collaboration between wildland fire management agencies and
other fire services is essential in the spring, especially during dry
periods when grass fuels are very dry.
For Prince Edward Island (PE), May posed a challenge in
particular on Tuesday May 7th, when PE had to deal with the
Covehead fire, approximately 40 hectares (ha) in size. With the
fuel type, high winds; the fire got up into the top of trees, where it
AB personnel supporting floods effort jumped from crown to crown, which added to the challenge of
suppressing the fire. Six homes were evacuated Tuesday
evening while firefighters tried to contain the blaze. The residents were able to return to their home
that same evening following some excellent work by the PE fire management program. Spring time is
usually the most challenging time for fire activity for the maritime agencies.
PE Covehead Fire PE Covehead Fire
NATIONAL PREPAREDNESS LEVEL DAYS
Levels 1 2 3 4 5
No. of days 66 48 14 0 0
May June July August
Fires by Month
1,417 835 1,236 1,729
3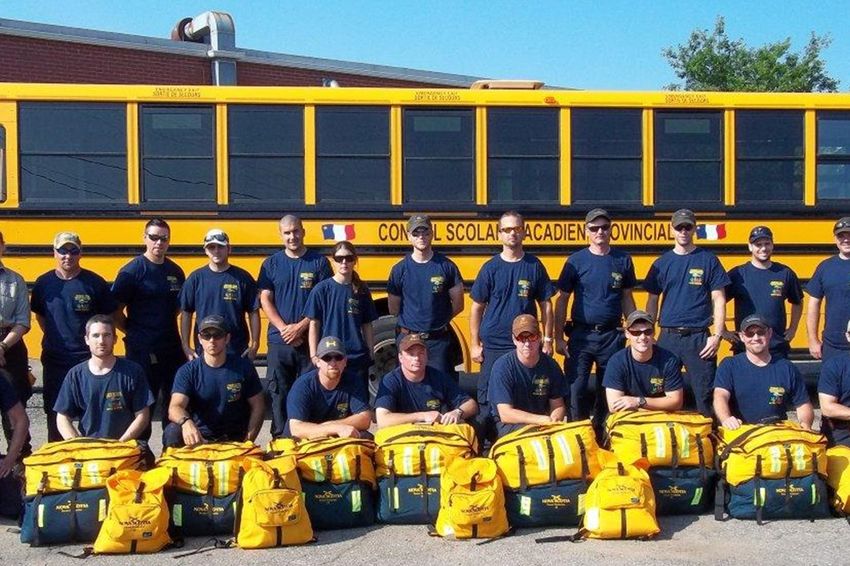
AB was another agency who in May who had a heightened risk of wildfires with high winds; drying
conditions, and dry grass provided the right formula for wildfires.
With those conditions, AB was on alert and well prepared to
respond to any and all situations. Preparedness proved to be
key for AB with seeing 50+ fire days including 92 fires on May
21st; AB had a number of fires that required numerous
resources like personnel, airtankers, helicopters and various
pieces of heavy equipment. AB northern half of province was
experiencing warmer temperatures while the southern half was
fairly wet.

In British Columbia (BC), the Spatsum Creek wildfire forced the
evacuation of around 50 homes in the Thompson River Valley.
Dozens of WFF worked through the night with the goal to bring
                                     this fire under control so
                                     residents could return
                                     home as soon as possible. BC committed over 110 WFF helped
                                     by air support including helicopters dropping water around the
                                     fire to cool down hot spots. The fire was at 1,400 ha, with the
                                     fire being reported contained on May 21st.

                                  On May 23rd, the NT had their first fire of the season. A lightning
                                  strike, 50 km south-west of Enterprise, surrounded by wet
       BC - Spatsum Creek Fire    lowlands, the fire was being monitored. The reason this fire was
                                  being monitored, as it poses no immediate threat to the
                                  community or values-at-risk, as well as its’ performs its role in
maintaining NT northern ecosystems. Fire has long been recognized as a significant and natural
phenomenon in forests of the NT. In general the month of May was fairly quiet for most of the
agencies.

When it came to June, once again in 2013 as was the case in 2012, the month of June registered the
lowest number of fires per month with 835 and 757 respectively. Now we just can’t base the sharing of
resources and the level of activity solely on fire numbers. June could also be described as the start of
the lightning season. Many could see their hazard start to build-up, with Manitoba (MB), Ontario (ON),
and QC were seeing 10+ fires per day and their APL in the 2 to 3 range. Although all three were seeing
fire activity, none of the current fire situation escalated to point of needing assistance through CIFFC.
The first sign of assistance came from the YT on June 19 th, with the YT at APL 4 and with lightning
triggering a number of new starts, the potential for an increase in initial attack (IA) fires was
unavoidable. A request for additional IA crews was sent to CIFFC, and BC was in a position without
compromising their ability to respond to fires in BC, sent 21 IA personnel as well as three overhead to
assist the YT with potential of new starts.

                                                                                                        4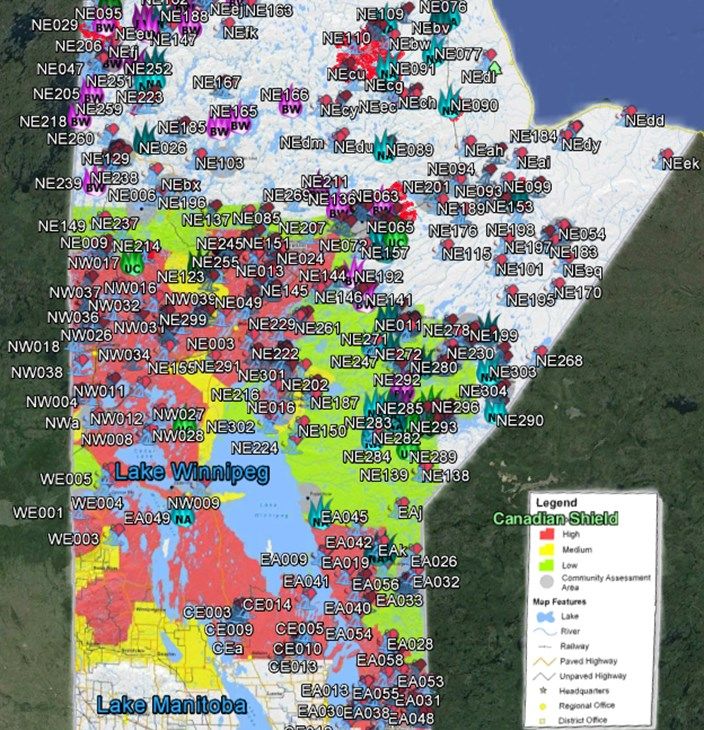
With the change of weather across Canada, many of the agencies were
seeing an increase in their fire danger. The potential for fire activity stretched
from YT all the way to NL. The support through CIFFC continued with both
YT, and now NT, as both agencies continued to be challenged with new and
existing fire. BC was once again able to provide assistance to both with
Sustained Action (SA) crews. SA crews (17-20 person per crew) are usually
take action on a fire that has not been contained or controlled by the initial
attack forces and that require extended attack. With the increase of sharing
resources, CIFFC moved from a NPL 1 to 2. With continued increase in fire            NT CL-215
activity in the YT, additional BC crews were sent with 7/3 person IA crews,
2/20 person SA crews and supervisory personnel which brought the total of 107 people.

                                  Although most of discussion has been around YT and NT, on the
                                  Atlantic coast in NL, they were experiencing one of the busiest
                                  seasons they have had in a long time. A fire near Wabush, NL with
                                  it had possible evacuations implications and loss of structures, put
                                  this fire as one of the priorities that NL was dealing with. With safety
                                  always been number one objectives on all wildfires, NL requested a
                                  Type 1 Safety Officer from NS to assist in ensuring that all safety
                                  concerns were being addresses first and foremost. Although we
         NL—Wabush fire           indicated earlier in this report that June had the lowest number of
                                  new starts, you can see that mid-June to the end of June that many
agencies were been challenged.

Some agencies were happy to see the month of June come to an end. For others, the arrival of July
signalled the start of an escalated time. QC was one of those agencies who in July saw their fire
activity increase with one priority fire after another. Also, CIFFC who also responds to international
requests as such was the case on July 2nd, when the National Interagency Fire Center located in Boise,
Idaho contacted CIFFC for a CV-580 airtanker group. Fortunately, at the time the Canadian airtanker
needs were for skimmer aircraft. Saskatchewan (SK) was able to send two CV-580 airtankers, birddog
aircraft and one of their air attack officers to the United States (US).

                                                                         SK CV-580 airtanker in Boise, ID

                                                                                                            5
With the US request being dealt with and the increase fire activity in
                                       QC, it was just a matter of time before mutual aid assistance would
                                       be requested from QC. When it comes to resource sharing, every
                                       effort is made to try and locate the closest resource as possible to
                                       minimize the time it takes to mobilize resources. Fortunately for QC,
                                       their neighbours to the east, New Brunswick (NB) were in a
                                       downtrend and were able to provide assistance to QC. On July 6 th,
                                       NB mobilized 20 Type 1 WFF, one supervisor; also ON sent 5/4
QC SOPFEU Operations (Broadback forest person Type 1 IA crews. Although the activity in the east was
camp)
                                       increasing, NT situation was also on up-trend with SK providing 20
person SA crew and overhead. With the increase in activity at CIFFC, the need to continue to meet
the members demand, the NPL was moved to 3. NPL 3 provides notice to agencies that the situation
in Canada is increasing, and that the need for additional assistance may also increase. This was the
case once again for QC receiving assistance this time from BC. BC was able to provide over 100
wildland firefighting personnel and additional 22 from SK. With all of the personnel in QC, additional
equipment to support this personnel was mobilized from ON who sent 50 medium pump kits and
4,000+ lengths of hose. Also providing equipment was NB who added to the medium pump count with
24 kits.

With only being ⅓ through the month of July and for some like the YT and NT, the already long fire
season was just getting longer. With new expected starts, the additional support of IA crews came
from BC and ON. With the additional crews, both YT and NT were able to give some of their staff a
much needed rest as the personnel continued their work on the existing and new starts. For others
like MB, receiving a CL-215 group from SK was very timely and appreciated. Receiving the SK
skimmer group was only part of the equation for MB who by now was at an APL 5, to continue to stay
a step ahead of the new starts and ongoing fires. IA and SA crews from AB (6/4p. and 1/20p.) and ON
(10/4p.) proved to be just what MB needed. With these additional resources, MB was able to maintain
an aggressive managed attack on all of their fires.

                 The graph provide a comparisons of RRO from 1982 to 2013.

                                                                                                            6
YT continued their torrent pace with the continued migration of BC
                                  resources with 1/20p. SA crew, miscellaneous overhead, and a
                                  Type 1 incident management team (IMT1). IMT1 are teams of
                                  specialized individuals who are trained and certified to management
                                  incidents, in this case a wildfire. AB who had also been supporting
                                  the efforts in AB with the floods, continued to reach deep to support
                                  their wildland fire partners by sending IA crews and overhead as
                                  well as SK (SA crew) to YT.
 BC IMT1 and overhead in YT
                                    By July 17th, over 450 wildland fire personnel were deployed through
CIFFC. The July trend continued on for MB and QC who continued to receive support from both ON
and NS. With these long extended periods of firefighting, the need to recycle personnel is a priority. In
general, wildland fire management staffs are prepared for a 14-day deployment. Once they reach day
14, there is a need (if required) to bring in fresh personnel to replace those who have earned a well-
deserved rest. The recycling of personnel for all agencies is part of their daily and long-term planning
to ensure that they have sufficient resource to meet their needs. This was true for QC who returned
the BC crews, and transition in the ON crews to continue on with the suppression efforts. The ability,
capacity and mechanism to share resources through the Mutual Aid Resource Sharing Agreement in
Canada is a testament to those who had a vision back in the 80’s with the establishment of CIFFC. As
July came to an end, most of the agencies where hoping that they would get a bit of break to refocus,
recharge and get ready for the final push to the fire season.

For BC, August started off with bang, when following a number of consecutive lightning days that
caused over a 24 hour period close to a 100 new fires. For BC with all of these new starts, they were
well prepared to respond to these new fires. The new fire starts continued for BC with over 300+ fires
over a 4-5 day period with about 99-percent of these fires being held within at an IA stage. The ability
to respond to fires in a quick, efficient and safe manner is a result of all the pre-fire season planning
agencies do. As things quieted down in BC, the same could not be said for our neighbours to the
south. Canada for the past few years has been providing landbased airtanker support to the US. This
trend continued in 2013 with BC, AB and SK sending CV-580 groups. Also for the first time since
2010, that Canada through the CanUS Arrangement sent personnel to the US. Both BC and ON
assisted by sending personnel. BC sent 23 smokejumpers and overhead and ON sent 100 Type 1 SA
WFF and supervisory staff. Smokejumpers referred to as Parattack in BC are WFF deployed with their
equipment by parachute from fixed-wing aircraft, as opposed to the conventional helicopter response.
These individuals as all Canadian WFF go through extensive training to ensure they are well prepared
to perform their duties.

In summary, CIFFC processed 70 resource request orders, which resulted in 997 Type 1 wildland fire
fighters, 133 miscellaneous overhead, 19 skimmers along with 13 landbased airtankers and 74 pumps
kits with 4,248 lengths of hose (includes deployment to the US).

Once again, although the numbers may not show the true level of activity for the 2013 fire season,
agencies such as YT, NT and NL experiences one of the busiest fire season in recent history. Having
to deals with a number of priority fires, these agencies saw their internal resources stretched to the
limit. For others, 2013 was an opportunity to return the favour and provide much need mutual aid
assistance.

                                                                                                        7
AGENCY REPORT SUMMARY
British Columbia

The 2013 fire season, while statistically average, saw scattered
periods of very intense activity across British Columbia.

Weather over the summer was, for the most part, seasonal and
warm. Following a usually dry July in many parts of the province, an
intense low pressure system swept through B.C., bringing unstable
weather and lightning. During this period, as many as one hundred
new fires were starting every day. Thanks to the hard work and quick
response of our crews, most of these fires were contained quickly.
By the Labour Day long weekend, the arrival of cool and wet                      BC SA crews to YT
weather in most areas lowered the fire danger rating and put a stop
to significant wildfire activity.

Given the relatively low level of activity in B.C. during parts of the summer, the Wildfire Management
Branch was able to deploy personnel to assist other jurisdictions, including Alberta, Alaska, Yukon,
Northwest Territories, Quebec, Montana, Washington and Idaho. Crews from WMB also assisted
                                    Emergency Management BC with flood response efforts.

                                  Yukon Territory

                                  Active fire season with slightly above average number of ignitions
                                  and total area burned. The reason that this fire season with mostly
                                  average numbers was so significant was because of the locations of
                                  several large fires nearer communities. Well above average Severity
                                  Rating for weather through June, July and August. One of the
          YT—Lake Laberge Fire
                                  highest years for recorded number of lightning strikes on record.

Large fire burned through much of the summer threatening recreational facilities near Mayo
necessitating significant modified response with Type 2 team. Two large fires near Carmacks closed a
highway, interrupted power supply and had the potential to threaten Carmacks. A Type 1 team was
installed that was successful in a modified response that alleviated most of the threat.

Significant CIFFC imports of overhead and crews on two occasions through July were necessary to
cover IA preparedness and sustained action. Yukon crews were exported in August to Idaho and
Oregon. Two isolated trappers’ line cabins and some remote Telecommunications facilities were lost in
fires.

Alberta

May was busy with interface fires resulting in three communities threatened and evacuated. Type 1
and 2 IMTs were deployed. The remainder of the season was below average activity and more IMTs
and resources were dispatched to aid in flood response and recovery

In July we had several large fires in the northern part of the province. This resulted in Zama City being
evacuated and other communities under alert or self-evacuating due mostly to smoke. The season
extended well into the fall and stretched resources considerably.

                                                                                                         8
Northwest Territories

Drought conditions persisted through summer and fall in
portions of the southwest Northwest Territories
particularly in the Dehcho region. Fire response was
required for sixty-two (62) wildfires with significant
suppression efforts required for seven (7) wildfires.

Saskatchewan

2013 started out as an average season and then
became quiet for July. However, hazards rose above                      NT Firefighter mopping-up
normal in August and September resulting in a longer
than typical season.
As of Nov. 15th, 2013, there were a total of 429 wildfires. This compares to 409 last year and is below
the 10 year average of 456. Humans caused 269 and lightning caused 160. There were 305 wildfires
in the Full Response Zone. The total area burned in the Full Response Zone was 56,573 hectares
which is well above last year’s 16,117 hectares. Two fires accounted for 97 percent of the hectares
burned in this zone. The ten-year average in the Full Response Zone is 72,641 hectares. 71 percent
of the wildfires to date occurred in the Full Response Zone, accounting for 18 percent of the total area
burned compared to 7 percent last year. 255,621 hectares were burned in the Observation and the
Modified Response Zone. This is slightly above last year’s total of 211,395 hectares. The total
provincial area burned to date is 312,599 hectares which is above last year’s 227,528 hectares. This is
well below the ten year average of 548,890 hectares.

Performance measures for the Full Response Zone saw 98 percent contained below 100 hectares with
the 10 year average being 96 percent. 93 percent were contained below 10 hectares compared to the
10 year average of 89 percent. There were partial evacuations of the elderly and smoke sensitive
people at Uranium City (10) and Fond du Lac (80) due to smoke. Assistance in conducting prescribed
burns was provided to the Ministry of Parks, Culture and Sport at the Saskatchewan Landing
Provincial Park and Duck Mountain Provincial Park. This involved 25 staff with ignition & suppression
resources. EMFS (Emergency Management & Fire Safety) was assisted by 50 staff and one
helicopter in flood response at various locations. Parks Canada was assisted in-province at Prince
Albert National Park with 44 personnel and at Grasslands National Park with a 4 person crew.

Staff assistance went to Northwest Territories, Quebec, Yukon,
Oregon and Alaska with 67 Type 1 wildfire suppression staff
and 3 AREPS.

Manitoba

A slow spring and cooler temperatures resulted in a below
average fire season in the south. The north experienced
extreme indices with little precipitation that resulted in an
extremely busy fire season that began in May and continued
through August where efforts were mainly concentrated on
community protection on the border between the Primary
Protection Zone and Observation Zone.

                                                                                MB 2013 Fires

                                                                                                           9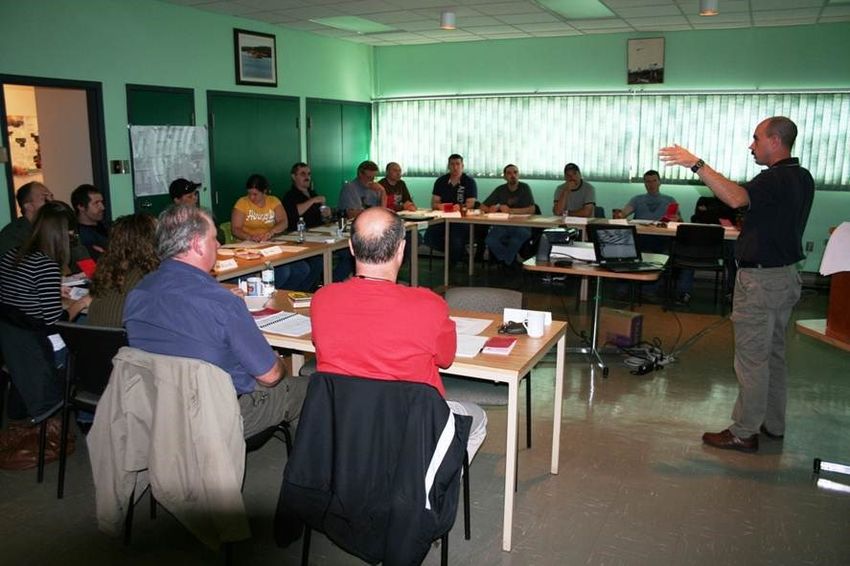
The majority of the hectares burned were in the
Observation Zone where fires were either no action or
modified response. An IMT was deployed once to a fire
near Gillam and several out of province resources were
requested to assist on northern fires. Fire activity
slowed during the last week of August and the fall fire
season was negligible.

Ontario                                                                        Fire in ON

Ontario this season experienced a grand total of 582
fires, which burnt 43,482.0ha. 85 fires, (which burnt 18,120.2ha) were “monitored” and are not
included in the categories above.

Overall, the 2013 fire season was relatively quiet compared to the 10-year average for number of fires
and hectares burned. This year prolonged periods of high humidity with short, intermittent drying
periods have kept forest fuels damp and new human or lightning caused fires to a minimum. This
compares to 1,615 fires and 151,569 hectares burned in the 2012 fire season. The first and last fires
were reported in the Northeast Region on April 10, 2013 and October 14, 2013, respectively, whereas
fires in the Northwest Region were reported on April 20 and October 1, 2013. There were no fire
caused evacuations or Restricted Fire Zone Orders activated.

                                           Quebec

                                             In intensive protection zones, the forest-fire protection
                                             season totalled 439 fires. The flames affected 58,282
                                             hectares of forest, below the average of the 10 previous
                                             years, which is 96,226 ha. The more problematic fires
                                             occurred along the northern boundary, close to the restricted
                                             protection zone. However, two fires in the restricted
            Fire in Northwestern QC
                                             protection zone forced residents to evacuate, first the
                                             Eastmain community in the Baie-James region (fire 235,
501,689 hectares) and then the municipality of Baie-Johan-Beetz, in the Basse-Côte-Nord region (fire
388, 48,400 hectares).
Human activity generated 355 fires, while the yearly average is 390. On average, lightning ignites
221 fires yearly, while this past year it only caused 84 fires. Some 58,282 ha were affected, including
46,369 ha by lightning.

The beginning of May was particularly busy in the south of the
province, with 141 fires between May 1 and May 10. This
represents 33% of the total number of fires for the 2013
protection season. The largest number of active fires in one day
occurred on May 4, with 34 fires.

However, the far north and the east of the province were
affected by large-scale fires. A total of 11 fires covered an area
of over 100 hectares. In June, a drought hit the Baie-James              NS Type 1 crew to QC
region; there were approximately 18 rainless days. A similar
phenomenon was recorded in the Côte-Nord region in July. These situations created ideal conditions
for the propagation of large-scale fires.

                                                                                                         10
Quebec drew upon additional fire-fighting resources
from British Columbia, Saskatchewan, Ontario, New
Brunswick, Nova Scotia, Parks Canada, Maine, New
Hampshire, Connecticut and Massachusetts.
Nova Scotia
The winter of 2013, in Nova Scotia, saw normal snow
and rain levels. The spring was quite wet which reduced NS restoring some of their history
our activity in April and May when we historically have
the majority of our fires. The summer was dry and warm
and we came close to implementing a ban on open fires on two separate occasions. The September
rains came and our season ended mid-September.
We experienced half the numbers of fires we normally have which burnt about a third of what we
normally burn.
We did send a 20 person SA Team to Quebec, a Safety Officer to Newfoundland and a Logistics
Section Chief trainee to Ontario under the IMT Trainee protocol.
Newfoundland Labrador
The 2013 forest fire season was extremely challenging at
times, particularly in Labrador. Although the number of forest
fires in the province were slightly below the ten year
average, there were two fires in Labrador that were very
costly to the program. For the most part it was a relatively
quiet fire season on the island portion of the province. When
fires were reported on the island, they were actioned in
timely manner and most of those fires were declared out
within the first operational period.
There were 32 fire starts in Labrador in 2013 and the most challenging was the Wabush fire
in western Labrador. The Wabush fire was first reported on June 23rd and burned for 30 days before
eventually being officially declared out. The fire burned a total of 27,000 hectares. At one point, the fire
threatened the town of Wabush as it burned very close to the town. To protect the safety and security
of the residents, the incident management team recommended mandatory evacuation of Wabush.
Approximately 2500 residents were impacted, prompting
emergency management procedures among first responders
and community partners. Aerial suppression efforts were
successful in preventing the advance of the fire towards
Wabush and eventually residents were able to return to their
homes. High winds and lack of precipitation for a ten day period
combined to make things very challenging for the Incident
Management Team assigned to the fire. As the fire advanced to
the east, it burned towards several cottage development areas
Safety Officer Course in NS
east of Wabush. Despite the aerial and ground suppression
efforts, several cottages and vehicles were destroyed by the
fire, resulting in millions of dollars in losses.
11The fire also impacted several other values in the area.
The Trans Labrador Highway, the only road in the
region, was closed for several days as the fire burned
on both sides of the highway. Eventually, when it was
deemed safe, vehicles were provided escorts through
the area affected by the fire. Unfortunately, the fire
flared up forcing the closure of the highway on a
number of occasions. The fire also caused a disruption
to internet, cell phone service and land lines for
Labrador as telephone lines and fibre optic cable was
damaged by the fire.
The exceptionally dry weather and hot temperatures in late June combined to elevate the risk of forest
fires in Labrador and prompted officials to implement a fire ban on outdoor fires in the region. The fire
ban was implemented for Labrador as a preventative measure.
On July 3rd, there was an incident involving a CL 415 belonging to the province as it attempted to
scoop water from Moosehead Lake. Fortunately the two pilots were not injured but the plane ended up
in the lake. The aircraft was eventually recovered from the lake. Transportation safety board report on
the incident is expected to be released in 2014.
On July 8th an incident management team was deployed to
the Gull Island fire in eastern Labrador to manage the
incident. The fire was located on the north side of the
Churchill River and less than 40 kilometers from the Muskrat
Falls hydro development project. The fire burned over 2500
hectares and also forced the closure on the Trans Labrador
Highway for several days. Eventually, vehicles were
provided escorts through the area affected by the fire. Fibre
NL CL-415 optic cable and poles were also destroyed by the fire. High
winds and lack of precipitation presented a major challenge
for suppression efforts. Airtankers, and air tankers were successful in preventing the fire from
advancing eastward towards the hydro development project. Water bombers and helicopters dropped
several thousands of liters of water on the fire to contain the fire, and making it possible to safely
deploy forest fire fighters in the area to mop up hot spots. The fire was officially declared out on July
25th.
In July, airtanker assistance was requested for the island
portion of the province and New Brunswick provided one AT
802 for fourteen days and their efforts were very much
appreciated.
For the remainder of the summer, new fire starts were reported
daily, each of those calls requiring the Department’s fire crews
to respond to the fire report. Although the 2013 forest fire
season was one of the busiest and most challenging in recent
years, it had the potential to be much worse than any other
year.
12Parks Canada
The 2013 wildfire season was an average year for
number of wildland fires. The wildfires were spread
across the country from the Gulf Island (BC) to PEI. In
terms of area burnt, it was an average year with
58,376.6 ha burnt and an additional 1,121 ha of
prescribed fire for a total of 59,498ha.
Kejimkujik National Park
Wood-Buffalo National Park was the busiest place with
50 fires and a total of 35,987 ha burnt. A significant number of resources were sent to WBNP in July
and August to work on High Priority fires. PCA staff worked closely with both Alberta and NWT to
manage those fires.
PCA had a significant Grasslands fire this year in Grasslands National Park in southern Saskatchewan
in late April. This was Complex multi-jurisdictional event (300person) and efforts are underway to
address some hazardous occurrences and near misses which were reported.
We were able to support Quebec with some ignition work and we were thankful for support received
from BC AB, SOPFEU, SK and NT.
In June personnel from the Fire IMTs were used to manage operations related to flooding in the Banff
region again giving weight to universal skill sets for All-Risk management.
13The graph shows Total Person Days for Type 1 personnel mobilized from 1995 to 2013.
14The graph shows Total personnel mobilized from 1995 to 2013.
The graph shows Personnel Average Deployment Days for Type 1
mobilized from 1995 to 2013.
15STATISTICS
The following table show that as of December 31, 2013, Canada recorded 6,479 fires and a total
area consumed of 4,289,795.00 hectares. The fires reported in the Modified Response account for
only 16-percent of the total fires but 88-percent of the total area consumed.
WILDLAND FIRE STATISTICS - 2013
FIRES HECTARES PRESCRIBED FIRE
Full Modified Total Full Modified Total Fires Ha
BC 1,679 175 1,854 10,470.00 7,516.00 17,990.00 0 0.00
YT 61 116 177 293.00 179,217.00 179,510.00 0 0.00
AB 1,214 0 1,214 21.890.22 0.00 21,890.22 36 2,771.10
NT 87 161 248 165,540.65 372,371.56 537,912.21 0 0.00
SK 305 124 429 56,573.00 255,621.56 312,194.00 3 405.00
MB 338 156 494 109,185.30 1,006,226.50 1,115,411.80 0 0.00
ON 489 93 582 23,786.50 19,635.50 43,422.00 3 60.00
QC 439 76 515 58,282.00 1,814,560.00 1,872,842.00 0 0.00
NL 81 20 101 30,582.40 12,494.00 43,076.40 0 0.00
NB 356 0 356 885.50 0.00 885.50 0 0.00
NS 171 0 171 301.30 0.00 301.30 0 0.00
PE 9 0 9 55.00 0.00 55.00 0 0.00
PC 36 60 96 19,658.10 38,718.50 58,376.60 14 1,121.20
TOTAL 5,265 981 6,246 497,506.97 3,706,360.06 4,203,867.03 56 4,357.30
WILDLAND FIRE RELATED FATALITIES
0
Year 86 87 88 89 90 91 92 93 94 95 96 97 98 99 00 01 02 03 04 05 06 07 08 10 11 12 13
9
Fatalities 6 3 3 0 3 4 2 0 2 4 0 0 0 0 0 2 0 3 2 0 3 3 2 1 5 4 0 1
16WILDFIRE STARTS
TOTAL NUMBERS OF FIRES (LIGHTNING AND HUMAN CAUSED)
2003 2004 2005 2006 2007 2008 2009 2010 2011 2012 Avg. 2013
BC 2,472 2,398 970 2,751 1,437 1,817 3,084 1,678 646 1,642 1,872 1,854
YT 77 282 83 80 110 67 118 88 56 126 109 177
AB 1,191 1,597 1,359 1,938 1,164 1,695 1,655 1,837 1,097 1,555 1,509 1,214
NT 160 297 261 166 1.353 241 42 224 207 279 323 248
SK 642 328 322 501 370 599 511 571 303 409 456 429
MB 1,148 234 246 682 364 397 184 583 315 497 465 494
ON 1,015 431 1,961 2,281 1,015 338 385 931 1,334 1,615 1,131 582
QC 716 319 1,374 683 935 222 483 737 329 795 659 515
NL 191 153 145 96 87 139 176 61 53 198 130 101
NB 228 240 305 310 282 168 192 179 81 344 233 356
NS 1274 258 304 234 392 247 193 313 116 352 268 171
PE 14 20 13 36 8 3 8 4 4 8 12 9
PC 115 90 95 135 64 103 136 113 67 87 101 96
TOTAL 8,243 6,647 7,438 9,713 7,581 6,036 7,167 7,319 4,608 7,907 7,266 6,246
TOTALS AS OF DECEMBER 31, 2013
Full Response Fires 5,265
Modified Response Fires 981
Total 6,246
The graph provide a comparisons 2013 fires versus 10 year average.
17WILDFIRE HECTARES
2003 2004 2005 2006 2007 2008 2009 2010 2011 2012 Avg. 2013
BC 264,733 220,468 35,091 135,634 28,704 11,939 229,566 331,508 12,357 102,042.00 137,204 17,990.00
YT 49,037 1,817,511 170,691 95,033 41,288 18,845 227,057 146,957 39,091 58,280.00 266,379 179,510.00
AB 55,482 234,764 60,602 118,782 105,321 20,644 66,825.77 83,643 940,596 337,000.00 202,366 21,890.22
NT 127,822 515,622 224,632 53,398 439,886 353,852 2,056.85 333,435 406,693 297,617.92 275,501 537,912.21
SK 126,591 258,441 213,524 1,203,722 212,907 1,130,179 37,559.37 1,734,799 343,720 227,512.00 548,895 312,194.00
MB 430,170 23,117 72,680 166,050 206,924 150,673 2,872 187,494 126,844 216,888.00 158,371 1,115,411.80
ON 314,220 1,616 42,308 149,518 40,591 1,314 20,655.70 14,824 635,373 151,564.00 137,198 43,422.00
QC 87,861 3,044 831,022 124,176 342.682 1,481 93,971.70 314,884 12,726 70,086.00 153,959 1,872,842.00
NL 36,534 2,362 22,834 3437 10,892 5,140 35,267.20 1,020 594 225,524.00 34,360 43,076.40
NB 237 289 355 507 446 143 249 156 45 362 279 885.50
NS 1,257 291 517 1,576 692 2,719 891.75 463 136 817 936 301.30
PE 12 16 50 51 20 8 3.09 5 6 11.88 18 55.00
PC 141,134 197,904 32,142 2,768 222,134 4,439 38,429.57 5,912 85,653 273,037.20 100,355 58,376.60
TOTAL 1,635,090 3,275,445 1,706,448 2,054,652 1,310,148 1,701,376 755,405 3,155,100 2,603,833 1,960,742 2,015,824 4,203,867.03
TOTALS AS OF DECEMBER 31, 2013
Full Response Hectares 497,507
Modified Response Hectares 3,706,360
Total 4,203,867
The graph provide a comparisons 2013 hectares versus 10 year average.
1819
Canada Report photos provided by CIFFC Member Agencies and their staff.20
You can also read