2013 Statistical Fact Sheet : 2020 Impact Goal - American ...
←
→
Page content transcription
If your browser does not render page correctly, please read the page content below
2013 Statistical Fact Sheet :
2020 Impact Goal
American Heart Association 2020 Impact Goal
By 2020, to improve the cardiovascular health of all
Americans by 20 percent, while reducing deaths from
cardiovascular diseases and stroke by 20 percent.
Beginning in 2011, and recognizing the substantial time lag in the nationally representative data sets, the
annual Statistical Update will evaluate and publish metrics and information that gives AHA directional in-
sights into progress and/or areas critical for greater concentration, to meet their 2020 goals. In 2013, year
1 data are presented that were derived from National Health and Nutrition Examination Survey
(NHANES) 2009-2010 data.
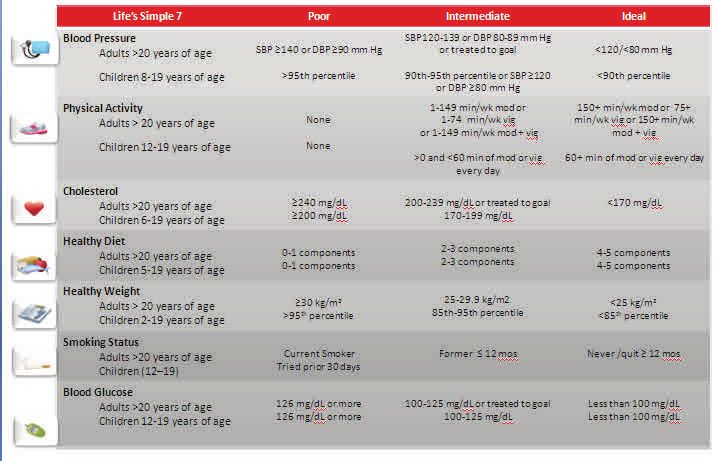
Definition of Cardiovascular Health
In order to accurately measure Americans’ cardiovascular health and monitor progress toward the 2020
goal, the American Heart Association for the first time defined “ideal cardiovascular health.” We define it as
the absence of disease and the presence of seven key health factors and behaviors that we call “Life’s Sim-
ple 7.” Below are the measurements we use to determine whether someone is in ideal, intermediate or poor
cardiovascular health.
DBP indicates diastolic blood pressure; mod, moderate; mos, months; SBP, systolic blood pressure; vig, vigorous.
Source: Circulation. 2010;121:586–613.
Progress Improving the Cardiovascular Health of All Americans
The prevalence of ideal levels of health behaviors and factors is much higher in children than in adults. The
major exceptions are diet and physical activity for which the prevalence of ideal levels in children is similar
(physical activity) or worse (diet).
Among children, the prevalence (unadjusted) of ideal levels of cardiovascular health behaviors and factors
currently varies from 0 percent for the healthy diet pattern (i.e., essentially no children meet at least four of
the five dietary components) to >80 percent for the smoking, blood pressure and fasting glucose metrics.
More than 90 percent of U.S. children meet none or only one of the five healthy dietary components.
Among adults, the age-standardized prevalence of ideal levels of cardiovascular health behaviors and factors
currently varies from 0.3 percent for having at least four of the five components of the healthy diet pattern to
up to 76% for never having smoked or being a former smoker who has quit for >12 months.
©2013 American Heart Association, Inc. All rights reserved. Unauthorized use prohibited.
2013 Statistical Fact Sheet — 2020 Impact Goal

                                 Prevalence for Cardiovascular Health Factors in U.S. Children

            Source: NHANES 2009-2010 (*Healthy Diet Score reflects 2007-2008 NHANES data)

                                    Prevalence for Cardiovascular Health Factors in U.S. Adults

            Source: NHANES 2009-2010 (*Healthy Diet Score reflects 2007-2008 NHANES data)

©2013 American Heart Association, Inc. All rights reserved. Unauthorized use prohibited.
2013 Statistical Fact Sheet — 2020 Impact Goal
Prevalence estimates of meeting at least 5 criteria for Ideal Cardiovascular Health,
U.S. adults by sex and race, U.S. children by sex
Source: NHANES 2009-2010
Approximately 40 percent of U.S. children and youths between 12 and 19 years old have five or more
metrics at ideal levels, with lower levels in boys (36 percent) than in girls (45 percent).
In comparison, only 16 percent of U.S. adults have five or more metrics with ideal levels, with lower
prevalence in men (12 percent) than in women (21 percent).
Progress Toward Reducing Deaths from Cardiovascular Diseases
U.S. age-standardized death rates* from cardiovascular diseases, 2000-2009
*Directly standardized to the age distribution of the 2000 US standard population.
Total CVD , ICD-10 I00-I99; Stroke, ICD-10 I60-I69; CHD, ICD-10 I20-I25; Other CVD, ICD-10 I00-I15, I26-I51, I70-I78, I80-I89, I95-
I99.
©2013 American Heart Association, Inc. All rights reserved. Unauthorized use prohibited.2013 Statistical Fact Sheet — 2020 Impact Goal
Taken together, these data continue to indicate the substantial progress is needed to reach the American
Heart Association’s 2020 Impact Goal.
The metrics with the greatest potential for improvement are health behaviors, including diet quality,
physical activity and body weight. However, each of the cardiovascular health metrics can be im-
proved and deserves major focus, including smoking, which remains the leading cause of preventa-
ble death in the United States.
Continued emphasis is also needed on the treatment of acute cardiovascular events and secondary
prevention through treatment and control of health behaviors and risk factors.
For each cardiovascular health metric, modest shifts in the population distribution toward improved
health would produce relatively large increases in the proportion of Americans in both ideal and inter-
mediate categories.
For additional information, charts and tables, see
Chapter 2 of Heart Disease & Stroke Statistics - 2013 Update.
Additional charts may be downloaded directly from the online publication at:
http://circ.ahajournals.org/lookup/doi/10.1161/CIR.0b013e31828124ad
Or at: www.heart.org/statistics
The American Heart Association requests that this document be cited as follows:
Go AS, Mozaffarian D, Roger VL, Benjamin EJ, Berry JD, Borden WB, Bravata DM, Dai S, Ford ES, Fox
CS, Franco S, Fullerton HJ, Gillespie C, Hailpern SM, Heit JA, Howard VJ, Huffman MD, Kissela BM,
Kittner SJ, Lackland DT, Lichtman JH, Lisabeth LD, Magid D, Marcus GM, Marelli A, Matchar DB,
McGuire DK, Mohler ER, Moy CS, Mussolino ME, Nichol G, Paynter NP, Schreiner PJ, Sorlie PD, Stein
J, Turan TN, Virani SS, Wong ND, Woo D, Turner MB; on behalf of the American Heart Association Sta-
tistics Committee and Stroke Statistics Subcommittee. Heart disease and stroke statistics—2013 update:
a report from the American Heart Association.Circulation.2013;127:e6-e245.
If you have questions about statistics or any points made in the 2013 Statistical Update, please contact
the American Heart Association National Center, Office of Science & Medicine at statistics@heart.org.
Please direct all media inquiries to News Media Relations at inquiries@heart.org or 214-706-1173.
©2013 American Heart Association, Inc. All rights reserved. Unauthorized use prohibited.You can also read