2018 Staff and student travel survey - University of Birmingham ...
←
→
Page content transcription
If your browser does not render page correctly, please read the page content below
2018
Staff and student travel survey

                   1
Executive Summary

This report sets out the key findings of the 2018 University of Birmingham staff and student
travel survey, undertaken between 1st and 31st October. The survey acts as the primary
mechanism for measuring the impact of the University’s Sustainable Travel Plan.

The University of Birmingham has been conducting a travel survey amongst staff and
students since 2008. The aim of the survey and the resultant action plan is to gain an
understanding of staff and student travel habits, identify areas for improvement, reduce
single occupancy car usage and in turn help reduce its carbon footprint.

An online questionnaire was designed and distributed to staff and students at the University
of Birmingham, through a variety of communication platforms including paper copies for
those without access to a computer. The survey attracted a response rate of 14.2% for
students and 36.6% for staff, providing a fair representation of staff and student travel
behaviour. Response rates improved in both categories compared to 2016 with an
additional 1085 responses.

The University has seen a reduction of 3.5% in single use occupancy car usage amongst
staff since 2016. Use of public transport, car sharing and cycling has also increased
amongst staff.

Use of single occupancy cars has also decreased amongst students with a 1% reduction for
undergraduates plus a significant reduction of 5% amongst postgraduate students. Walking
and cycling has also increased amongst the student population.

The decrease in single occupancy car usage amongst staff reverses the results from 2016
which saw a shift away from public transport back to cars. There has however been a
significant reduction in the number of staff walking to the University.

As with previous years the majority of undergraduate students are travelling actively with
73% walking and 5% cycling. There have also been significant increases in the number of
postgraduate students walking and a small increase in cycling.

                                                2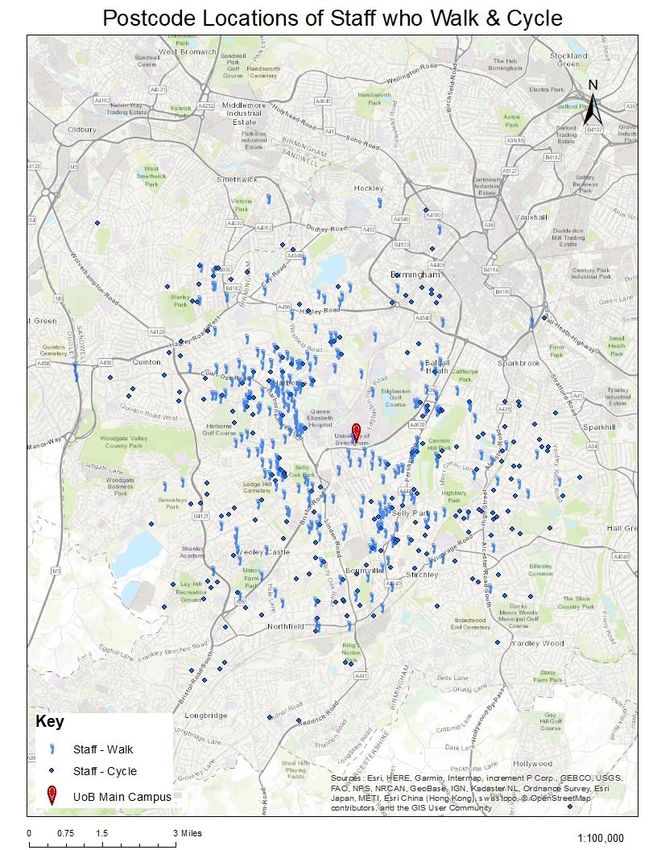
Contents

Executive Summary                                            Page 2
Section 1: Introduction                                      Page 6
Background                                                   Page 6
Campus Location                                              Page 6
University Sustainable Travel Plan                           Page 6
Report Structure                                             Page 7
Section 2: Methodology                                       Page 7
Section 3: Survey Results and Analysis                       Page 7
Response Rate                                                Page 7
Campus Location                                              Page 8
Campus Arrival Time                                          Page 9
Main Travel Method                                           Page 10
Comparison of modal shift since 2008                         Page 12
Occasional Travel Method                                     Page 15
Occasional travel for car users                              Page 16
Car travel in relation to distance travelled                 Page 17
Viable Alternative Travel Method                             Page 18
Car Park location                                            Page 19
Reasons for travelling by car                                Page 21
Encouraging sustainable travel                               Page 22
Awareness of sustainable travel incentives                   Page 25
Respondents’ open comments and suggestions for improvement   Page 26
Section 5: Recommendations                                   Page 29
Student specific                                             Page 29
Staff specific                                               Page 30
Section 6: Conclusion                                        Page 32

                                               3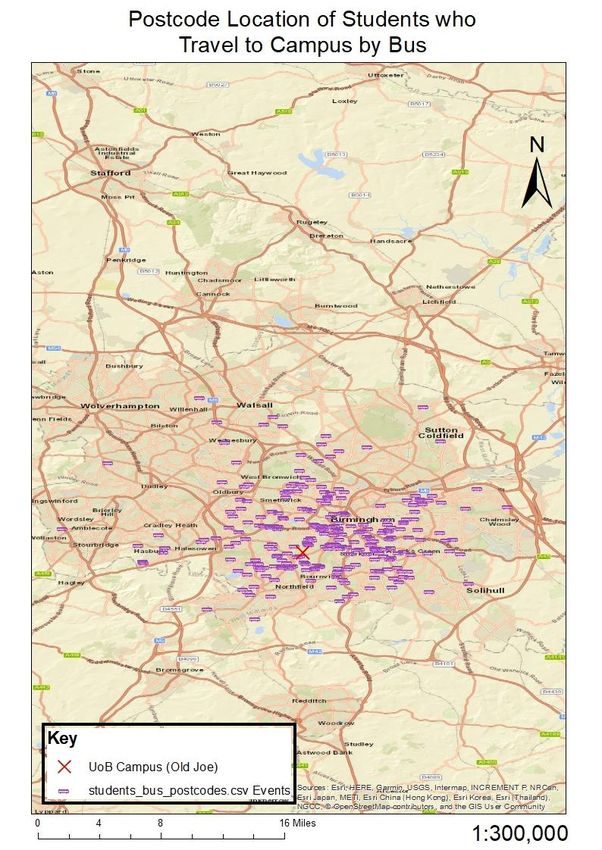
Appendix
Appendix A: UoB Staff post codes based in the UK                  Page 35
Appendix B: UoB Staff post codes based in the West Midlands       Page 36
Appendix C: Staff that either walk or cycle                       Page 37
Appendix D: Students that either walk or cycle                    Page 38
Appendix E: Staff commuting by bus                                Page 39
Appendix F: Students commuting by bus                             Page 40
Appendix G: Staff commuting by train                              Page 41
Appendix H: Students commuting by train                           Page 42
Appendix I: Staff motorists                                       Page 43
Appendix J: Students who commute by vehicle                       Page 44

                                      List of Tables

Table 1: Survey response rate                                     Page 7
Table 2: Campus location                                          Page 8
Table 3: Main travel method                                       Page 10
Table 4: Staff travel habit trends (2008-2013)                    Page 13
Table 5: Student travel habit trends (2008-2013)                  Page 14
Table 6: Occasional travel method                                 Page 15
Table 7: Occasional travel method of single occupancy car users   Page 16
Table 8: Distance travelled by car                                Page 17
Table 9: Most viable alternative travel method for car users      Page 18
Table 10: Car parking location                                    Page 19
Table 12: Cycle comments                                          Page 26
Table 13: Bus comments                                            Page 27
Table 14: Train comments                                          Page 27
Table 15: Walking comments                                        Page 28
Table 16: Car sharing and car parking comments                    Page 28

                                              4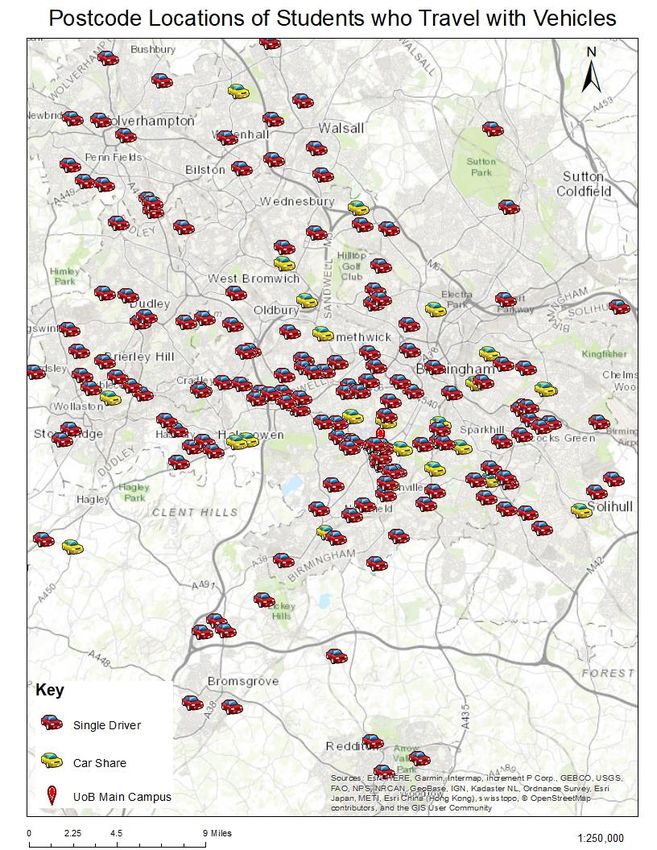
List of figures

Figure 1: Campus arrival time                                       Page 9
Figure 2: Main travel method                                        Page 11
Figure 3: Travel method modal shift for UoB staff (2008-2013)       Page 12
Figure 4: Travel method modal shift for UoB students (2008-2013)    Page 14
Figure 5: Car park location                                         Page 20
Figure 6: Reasons for travelling by car                             Page 21
Figure 7: Reasons for travelling car: staff and student breakdown   Page 21
Figure 8: Measures to encourage walking                             Page 22
Figure 9: Measures to encourage cycling                             Page 23
Figure 10: Measures to encourage public transport                   Page 24
Figure 11: Measures to encourage car sharing                        Page 25

                                          5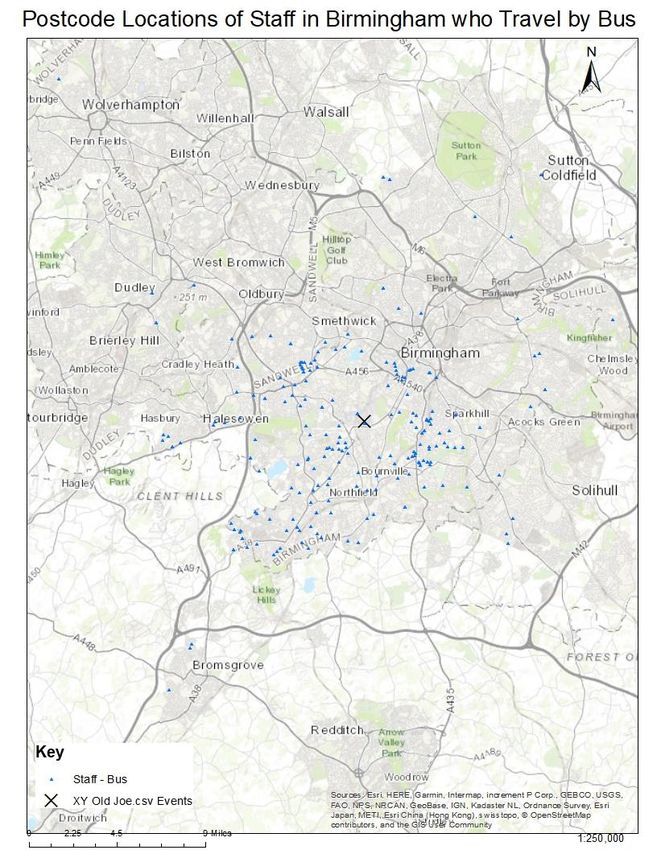
Section 1: Introduction
The survey results provide valuable information about staff and student travel behaviours,
whilst also gauging both groups’ awareness and perceptions of the sustainable travel
options that are available to them. The results help to inform the University’s ongoing
Sustainable Travel Plan.
Campus location
The University’s main campus is located in Edgbaston, approximately 4 miles from
Birmingham City Centre, in an accessible urban location. The main campus is well served by
a range of public transport options and is the only University in the United Kingdom to have a
mainline train station located on campus. The University operates a controlled car park
management system to ensure the correct usage of the main campus parking facilities. Car
parking is predominantly offered to staff on a pay-as-you-go basis to try and increase the
use of alternatives modes of travel where possible. Students are not allowed to park in
central areas of campus unless they meet certain criteria.
Sustainable Travel Action Plan 2016-2021
The University’s Sustainable Travel Action outlines the strategic framework that aims to
encourage more staff and students to travel to the University via more sustainable methods.
Originally developed by the University Travel Plan Steering group, the focus is to implement
a range of initiatives that remove barriers to and encourage sustainable travel.
The main objectives are to:
Reduce single occupancy vehicle usage by staff, students and visitors
Encourage the use of sustainable modes of travel to the above groups
Reduce the number of staff, students and visitors parking on campus
Encourage the use of sustainable modes of travel for work related journeys
Reduce the negative impacts of travel to the University on local roads and the local
community
The Action Plan sets out all of the travel plan measures and objectives in a clear time
specific manner.
Report structure
Following this introductory section, section two of the report outlines the methodology of the
study and then section three details the survey findings with specific reference to the
6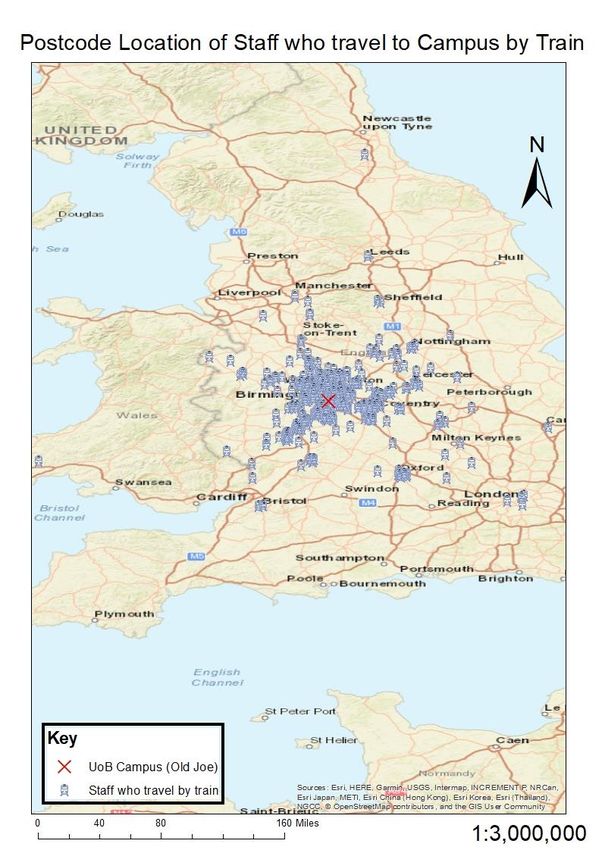
progress made towards the sustainable travel plan targets. Section four outlines a series of
subsequent recommendations to reflect the survey results. Section six provides a
conclusion.

Section 2: Methodology

Following consultation with the University Sustainable Travel Coordinator, it was decided
that the survey questions should be parallel to those in the 2016 travel survey. Using similar
questions enables a direct comparison of survey results from previous years. A question was
added to the survey regarding awareness of travel initiatives and incentives in order to
identify areas of improvement for communication.

The survey content was reviewed by a number of key stakeholders at different stages of its
construction, which allowed amendments to be made in light of feedback. The survey was
created online using Survey Monkey, with the link to the survey being emailed to staff and
students and a reminder email circulated for students. Paper surveys were also made
available for staff without regular access to a computer. Students were employed to collect
survey responses on campus directly from staff and students. This method proved very
successful with over 1000 responses collected.

Section 3: Survey Results and Analysis

Response Rate

Response rates were calculated after obtaining staff employment statistics from Human
Resources and this indicated that there are 8,058 staff currently working at the University.

Student statistics were obtained through accessing enrolment statistics on the University
mailing list and this revealed that a total of approximately 32,000 students were enrolled at
the University, during the survey period. Using these figures, the response rate was
calculated, as seen in Table 1.

                                  Table 1: Response Rate

              Response Rate                    Total       Percentage of total
              Staff                            2926        36.6%
              Student                          4019        14.2%
              Total                            7455        18.4%

Response rates for both staff and students increased in comparison to 2016 from 31.8% for
staff and 13.1% for students.

The continued improvement in response rates for the travel survey demonstrates that
communication methods are working and that staff and students are engaging.

                                               7
Campus Location

Table 2: Campus Location

                   Undergraduates         Postgraduates              Staff              Total

                      %          N          %          N         %           N      %           N

Main Campus
                   91.9%       3,226      89.8%       915      90.3%     2,643     91%      6,784
(Edgbaston)

  Selly Oak                                3.6%
                    2.5%         88                    36      1.7%          47    2.2%     171
  Campus

Dental School       1.7%         63        0.8%        8       0.9%          29    1.3%     100

Shakespeare                                                                        0.2%
                    0.1%          4        0.7%        7       0.1%          5                  16
  Institute

  Ironbridge
                   0.03%          1        0.9%        9       0.03%         1     0.2%         11
    Institute
  Raymond
   Priestly        0.06%          2         0%         0       0.3%          4     0.08%        6
   Centre
   Guild of
                    0.3%         11        0.7%        8       0.9%          27    0.7%         46
   Students

     Other          3.4%        115        3.5%        36      5.9%          170   4.3%     321

Table 2 shows that the majority of survey respondents selected the main campus, in
Edgbaston, as their main place of work or study (91.9% undergraduate, 89.7% postgraduate
and 90.3% staff). This is representative of the majority of teaching and corporate service
activity taking place in this location. A small proportion of staff and students nominated either
the Dental Hospital or the Selly Oak Campus as their place of work or study, with teaching
also taking place at these locations. In addition a similarly low proportion of staff and
students selected “other” study/work locations, which accounts for staff and students on
placement and also distance learners.

The report shall focus on the travel issues that affect staff and students that commute to the
main campus in Edgbaston, to allow for a more concise analysis. However travel issues for
the other University locations shall be referred to in the analysis of open responses and also
form part of the recommendations section.

                                                 8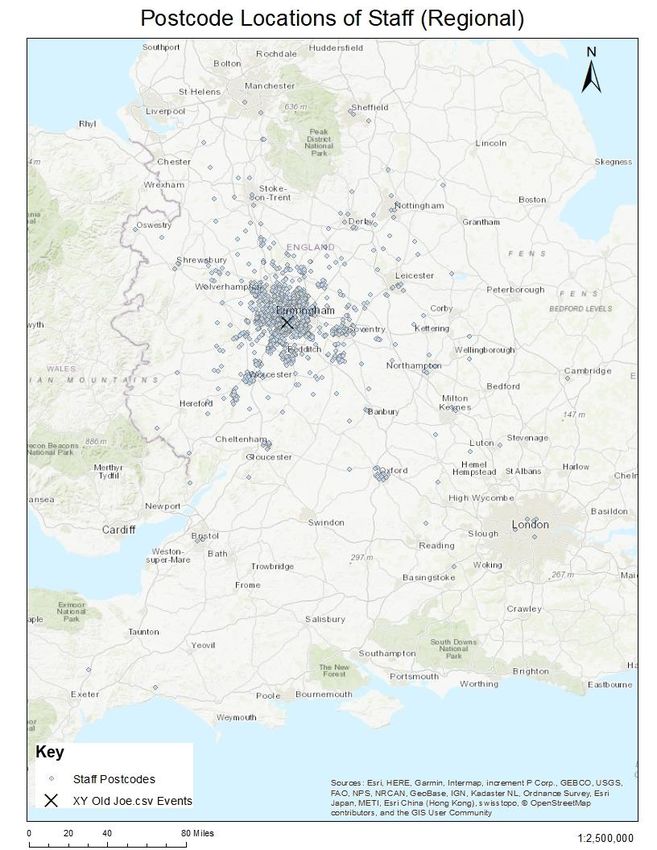
Campus Arrival Time

Figure 1: Campus arrival time

                         1200
                         1100
                         1000
   Number of Responses

                         900
                         800
                         700
                         600
                         500
                         400
                         300
                         200
                         100
                            0
                             Before 6:00   06:31 -    07:31 -   08:31 -    09:31 -    10:31 -   11:31 -
                                            07:00      08:00     09:00      10:00      11:00     12:00
                                                                Time Period

                                                Undergraduate     Postgraduate       Staff

Figure 1 shows that the majority of staff and students arrive on campus between 08:00 and
10:00 however there are significant differences in arrival times patterns between staff,
undergraduates and postgraduates.

Peak arrival time for staff is between 08:00 and 09:00 with a sharp decline thereafter. There
is a similar peak with undergraduates students arriving on campus between 08:30 and
09:00. As with previous years there is a further peak around 10:00 which can be explained
by lecture start times. The majority of postgraduates arrive between 08:30 and 09:00 with
no secondary spike.

                                                                  9
Main travel method

  Perhaps the most important question contained in the survey asks the respondents to
  specify their main method of travel to the University. The results are shown below in Table
  3.

  Table 3: Main travel method

                  Undergraduates        Postgraduates               Staff
   Method                                                                                Total
                     n         %          n          %         n             %
 Car/Van as a
                                                                                             16.6%
    single          118       3.4%       104        10.4%     992       34.5%      1,214
  occupant
 Car/Van as a                                                                      301
                    26        0.7%       16         1.6%      259           9%               4.1%
shared journey
     Bus            276       7.9%       115        11.5%     232           8.1%   623       8.5%

    Train           293       8.5%       230        23.1%     744       25.9%      1,267     17.3%

    Metro           12        0.4%        4         0.5%       9            0.3%    25       0.3%

  Walk/Jog         2,530     73.2%       430        43.1%     334       11.5%      3,294     44.9%

   Bicycle          182       5.3%       91         9.1%      290       10.1%      563       7.7%
 Motorcycle/
                     5        0.2%        3         0.3%       8            0.3%    16       0.3%
  Scooter

     Taxi           11        0.3%        4         0.4%       6            0.2%    21       0.3%

    Other            2        0.1%        0         0.00%      4            0.1%    6        0.1%

   TOTAL           3,455     100%        997        100%     2,878          100%         7,330

                                               10
Figure 2: Main travel method
Main Travel Method to University
100%
90%
80%
70%
% of Responses
60%
50%
40%
30%
20%
10%
0%
Undergraduates Postgraduates Staff
Car/Van as a single occupant Car/Van as a shared journey Bus
Train Metro Walk/Jog
Bicycle Motorcycle/Scooter Taxi
Other
Figure 2 demonstrates car travel as still the most popular method amongst staff, with 34.5%
travelling as a single occupant and a further 9% as a shared journey. Car usage is
considerably lower amongst the student population with just 3.4% of undergraduates
travelling as a single occupant and 10.4% of postgraduates. Car sharing amongst students
is also minimal with less than 1% of undergraduates and 1.6% of postgraduates.
More than 30% of staff travel to the University by public transport with 25.8% using the train
and 8.1% travelling by bus. As in previous years this is mirrored in the postgraduate
population with 23.1% on the train and 11.5% on the bus. Public transport use is lower
amongst undergraduates with 7.9% using the bus and 8.5% on the train.
Nearly 80% of undergraduate students travel to university by active travel methods, with
73.2% walking and 5.2% choosing to commute by bicycle. In comparison 52% of
postgraduate students travel to commute by active methods, of which 43.1% walk or jog and
9.1% cycle. Active travel levels are lower amongst staff but still significant with 10% cycling
and 11.6% walking.
11Modal shift since 2008
Since 2008 the University has used the travel survey data to identify areas for improvement
and inform the Sustainable Travel Plan. A number of targets were devised and are
summarised below:
Achieve a 5% reduction in the proportion of staff and student single occupancy car
journeys
Increase the proportion of staff and students walking and/or cycling to the University
Increase the proportion of staff and students using public transport to access the
University
Increase the proportion of staff car sharing
Figure 4: Travel method modal shift amongst staff 2008-2018
Staff Travel Method Model Shift (2008-2018)
45
40
35
30
% Change
25
20
15
10
5
0
2008 2013 2016 2018
12Staff Travel method trends (Annual % change): 2008-2018
Change Change Change
2008 2013 2016 2018
from 2008 from 2013 from 2016
Car/Van single
39.3 34.9 37.9 34.5 -4.83 -0.4 -3.43
occupant
Car/Van shared 9.3 8.6 7.3 9.00 -0.3 0.4 1.7
Bus 6.6 7.8 7 8.1 1.46 0.3 1.06
Train 24.1 26.5 24.5 25.8 1.75 -0.65 1.35
Metro - - - 0.3 - - -
Walk/Jog 10.3 13.3 14.6 11.6 1.31 -1.69 -2.99
Bicycle 8.8 7.9 8.1 10.1 1.28 2.18 1.98
Taxi 0 0.1 0.2 0.2 0.28 0.18 0.08
Motorcycle/Scooter 1.2 0.8 0.4 0.2 -0.99 -0.59 -0.19
Other 0.4 0.2 0.1 0.1 -0.26 -0.06 0.04
Table 4: Travel method modal shift amongst staff 2008-2018
The table above shows the modal shift of staff travel habits between 2008 and 2018. The
University has almost achieved its aim of a 5% reduction in single occupancy car usage
amongst staff with a 4.8% decrease since 2008. This is despite an increase of 3% between
2013 and 2016. Since 2016 there has been a 3.4% decrease in the number of staff
commuting via single occupancy vehicle. This reversal of the 2016 results can be attributed
to an increase in cycling, car sharing and staff returning to public transport.
The 2016 report showed reductions in patronage of buses and trains which has been
reversed with a 1% increase in bus and train usage.
There has been a significant increase in the number of staff cycling to the university up 2%
since 2016 to 10%. Less encouraging is the 3% reduction in the number of staff walking to
work.
13Figure 5: Travel method modal shift amongst students 2008-2018
Student Travel Method Model Shift
(2008-2018)
45
40
35
% Change
30
25
20
15
10
5
0
2008 2013 2016 2018
The table above shows there has been a reduction in single occupancy car usage amongst
both undergraduate and postgraduate students. There has been a small reduction of 1.3%
down to 3.4% amongst undergraduates but amongst postgraduates the reduction is nearly
5%.
Usage of public transport amongst both groups of students has also increased.
Cycling levels amongst students have remained stable with a slight increase amongst
undergraduates of 1.2% to 5.3%. Postgraduate cycling levels have dropped very slightly by
0.4%. As expected walking is still the most dominant method of travel amongst students
with 73% of undergraduates and 43% of postgraduates choosing to walk to the University.
Table 5: Student travel method modal shift between 2008-2018
Student Travel method trends (Annual % change): 2008-2018
Change Change Change
2008 2013 2016 2018
from 2008 from 2013 from 2016
Car/Van single
9 9.9 8.3 4.9 -4.1 -5 -3.3
occupant
Car/Van shared 3 1.7 1.3 0.9 -2.1 -0.8 -0.3
Bus 12 7.7 8 8.7 -3.3 1 0.7
Train 17 16.4 16.3 11.7 -5.3 -4.7 -4.5
Metro - - - 0.3 - - -
Walk/Jog 55 57.9 59.2 66.4 11.4 8.5 7.2
Bicycle 4 5.7 6.1 6.1 2.1 0.4 0.03
Taxi 0 0.3 0.5 0.1 0.1 -0.1 -0.3
Motorcycle/Scooter 0 0.1 0.2 0.3 0.3 0.2 0.1
Other 0 0.3 0.2 0.04 0.04 -0.1 -0.1
14Occasional Travel Method
Table 6: Occasional travel methods
Undergraduates Postgraduates Staff
Method Total
n % n % n %
Car/Van as a
14.1%
single 187 5.4% 100 10% 747 25.9%
1,034
occupant
Car/Van as a 6.4%
188 5.4% 60 6% 218 7.6%
shared journey 466
14.2%
Bus 410 11.8% 192 19.3% 442 15.4%
1,044
18.4%
Train 555 16.1% 180 18.1% 611 21.2%
1,346
0.5%
Metro 16 0.5% 10 1.0% 11 0.4%
37
30.3%
Walk/Jog 1,555 45% 316 31.7% 351 12.2%
2,222
7.2%
Bicycle 286 8.3% 67 6.7% 176 6.1%
529
Motorcycle/ 0.3%
3 0.1% 1 0.1% 22 0.7%
Scooter 26
5.5%
Taxi 212 6.1% 50 5% 143 4.9%
405
3.1%
None 43 1.3% 21 2.1% 157 5.6%
221
TOTAL 3,455 100% 997 100% 2,878 100% 7,330
Table 6 shows that over a quarter of staff (25.9%) occasionally travel by car as a single
occupant, this is a larger proportion that both undergraduates (5.4%) and postgraduates
(10%). Car sharing numbers are similar across undergraduates (5.4%),staff (7.6%) and
postgraduates (6%).
Public transport shows a similar modal split for occasional train usage in particular (21.2% of
staff, 16.1% undergraduates and 18.1% postgraduates). Occasional bus usage is highest
amongst postgraduates at 19.3% with 15.4% of staff and just 11.8% of undergraduates.
Walking as an occasional method of travel has increased for both undergraduates (45%)
and postgraduates (31.7%) but has seen a decrease amongst staff to 12.2%. Cycling as an
occasional mode of travel is down amongst all groups with less than 10% split.
It is encouraging than more than 50% of staff occasionally travel on public transport or via
active methods of walking or cycling. The low numbers and decrease from 2016 in students
using cars as occasional methods of travel is also encouraging.
15The following section focuses on the occasional travel methods of single occupancy car
users and this shall therefore provide a better indication of where the travel plan needs to
focus in order to encourage a shift away from cars.
Occasional travel for car users
The University is seeking ways in which to reduce the proportion of single occupancy car
journeys made by staff and students. By filtering out the occasional travel method of the
respondents that travel by car as a single occupant, as their main method, the University can
investigate the best ways to encourage these groups to adopt their occasional as their main
method. Table 7 shows the occasional travel method of single occupancy car users.
Table 7: Occasional travel for car users
Undergraduates Postgraduates Staff Total
Method
n % n % n % n %
Car/Van as a
12 10.1% 8 7.7% 68 6.8% 88 7.2%
shared journey
Bus 16 13.5% 12 11.7% 132 13.3% 160 13.1%
Train 48 40.7% 43 41.5% 336 33.8% 427 35.1%
Metro 1 0.8% 0 0.00% 1 0.1% 2 0.1%
Walk/Jog 8 6.8% 5 4.8% 75 7.5% 88 7.2%
Bicycle 4 3.3% 5 4.8% 57 5.7% 66 5.5%
Motorcycle/
1 0.8% 1 0.9% 12 1.3% 14 1.3%
Scooter
Taxi 1 0.9% 1 0.8% 32 3.3% 34 2.8%
None 27 22.9% 29 27.8% 279 28.2% 335 27.7%
1,21
Total: 118 100% 104 100% 992 100% 100%
4
16Car journey distance
The University is striving to reduce the number of single occupancy journeys to its main
campus in Edgbaston with particular focus on staff and students that live within 10 miles.
Table 8 shows the distance that staff and student car users commute.
Table 8: Distance travelled by car
Distance travelled for single car users
Undergraduate Postgraduate Staff Total
n % n % n % n %
Less than 2 miles 12 10.2 12 11.5 46 4.6 70 5.8
2 - 5 Miles 22 18.6 25 24 354 35.7 401 33
6 - 10 Miles 35 29.7 20 19.5 270 27.2 325 26.8
11 - 15 Miles 29 24.6 13 12.7 124 12.5 166 13.7
16 - 20 Miles 7 5.9 7 6.7 59 5.9 73 6
21 - 30 Miles 8 6.8 7 6.9 63 6.4 78 6.4
Over 30 Miles 5 4.2 20 19.2 76 7.7 101 8.3
Total: 118 100% 104 100% 992 100% 1,214 100%
Table 8 shows that 67.5% of staff, who commute in a single occupancy car, live within 10
miles of the University. This figure has increased by just 0.3% since 2016 illustrating that the
distances staff in single occupancy cars are travelling from remain consistent.
This is a greater figure than both student groups (58.5% undergraduates and 54.7%
postgraduates). The figure for undergraduate’s shows minimal change since 2016 as with
staff but the number of postgraduates driving within a 10 mile radius has increased
significantly by 13%.
17Most viable alternative travel methods
Table 9: Most viable alternative travel methods
Most Viable Travel Method for Single Car Users
Undergraduate Postgraduate Staff Total
n % n % n % n %
Car (single occupant) 2 2.1 4 4.4 56 6.5 62 18.5
Car (shared journey) 7 7.4 3 3.3 53 6.2 63 5.9
Bus 19 20.2 13 14.3 160 18.8 192 6.1
Train 46 48.9 39 42.9 336 39.4 421 40.6
Metro 1 1.0 1 1.1 1 0.1 3 0.3
Walk/Jog 3 3.3 5 5.5 44 5.1 52 5
Bicycle 6 6.5 6 6.56 70 8.2 82 7.9
Motorcycle/Scooter 1 1.3 0 0.00 8 0.9 9 0.8
Taxi 1 1.3 3 3.3 19 2.2 23 2.2
No viable alternative 7 7.8 15 16.5 91 10.6 113 10.9
Total: 94 100% 91 100% 851 100% 1,036 100%
Respondents who confirmed they travelled in a car, signally or as part of a shared journey
were also asked to state their most viable alternative travel method.
Amongst staff, as in previous years, public transport was deemed the most viable alternative
with 39.4% stating the train and 18.8% stating the bus. This pattern was also reflected
within both student groups with 48.9% of undergraduates stating the train and 20.2% the
bus. The split is similar with postgraduates with 42.9% stating the train and 14.2% the bus.
It is encouraging that the number of respondents stating the train is their most viable
alternative has increased significantly across all groups since 2016. There are similar if less
noteworthy increases in relation to buses as well.
As in 2016 a higher percentage of staff identified active travel methods as their most viable
alternative to driving than both student groups. This indicates there is scope to further
increase walking and cycling amongst staff as well as public transport.
18Car Park locations
Respondents who indicated that they travel by car were asked where they usually parked.
Table 10 and Figure 6 shows where staff and students park when travelling to the University.
Table 10: Car park locations (staff and student)
Undergraduate Postgraduate Staff Total
n % n % n % n %
Other 196 27.9 67 17.8 207 11.9 470 16.6
Nearby residential
street (under 1 mile 237 33.7 100 26.6 143 8.2 480 17.1
away)
Residential street
49 6.9 27 7.2 29 1.6 105 3.7
(over 1 mile away)
Public off-street car
44 6.2 42 11.2 8 0.4 94 3.3
park
Selly Oak campus
20 2.8 15 4 20 1.1 55 1.9
car park
University car park
33 4.7 21 5.6 227 13 281 9.9
(non-card swipe)
University car park
42 5.9 22 5.8 831 47.7 895 31.7
(card swipe)
University car park
81 11.5 81 21.6 274 15.7 436 15.4
(pay and display)
Total: 702 100% 375 100% 1,739 100% 2,816 100%
The table shows the majority of staff members park within University car parks accessible
via card swipe (47.8%) with a further 15.7% using pay and display car parks.
The majority of undergraduate students park on a nearby residential street (33.7%) with a
significant percentage (27.9%) stating ‘other’ which could indicate they are parking at halls
of residence or more than a mile away on a residential street.
19Postgraduates are also most likely to park on nearby residential streets. The increase in
postgraduates parking in residential streets has slowed after a significant increase between
2013 and 2016. Undergraduate parking habits remain similar to 2016.
Figure 6: Car park locations
Parking Locations
100%
University car park (pay and
90%
display)
80% University car park (card swipe)
70% University car park (non-card
% of Responses
swipe)
60%
Selly Oak campus car park
50%
Public off-street car park
40%
Residential street (over 1 mile
30%
away)
20% Nearby residential street (under
1 mile away)
10% Other
0%
Undergraduate Postgraduate Staff
20Reasons for travelling by car
To help understand why staff and students commute by car, both groups were asked to
select the reasons for why they travel by car, as illustrated in the following graphs.
Figure 7: Reasons for travelling by car (staff and students)
Reasons for travelling by car
Other
Not applicanle as do not drive to university
No nearby convenient public transport
Too far to walk or cycle
Health reasons or disability
Satisfy work/study commitments
Factors
Convenience
Safety
Cheaper than public transport
Quickest travel method
Carer responsibilities
Provide lift for other people
Activities before/after work
0 200 400 600 800 1000
Number of Responses
Figure 8: Reasons for travelling by car broken down by staff and students
Reasons for travelling by car (staff and
students)
Other
Not applicanle as do not drive to university
No nearby convenient public transport
Too far to walk or cycle
Health reasons or disability
Factors
Satisfy work/study commitments
Convenience
Safety
Cheaper than public transport
Quickest travel method
Carer responsibilities
Provide lift for other people
Activities before/after work
0 10 20 30 40 50 60 70 80
Percentage of Responses (%)
Staff Students
21As in previous years the reasons for travelling by car are similar across all three groups.
Convenience is the main motive for commuting by car for both staff and students. Travelling
by car is cited as the quickest method of travel as another key reason.
Measures to encourage sustainable travel
Encouraging staff and students to walk
Respondents were asked which measures would most encourage them to walk to
University; they were asked to choose up to four options.
Figure 9: Encouraging staff and students to walk
Encourage to Walk
Other
Nothing would encourage me
I live too far away to walk
Improved showe and changing facilities
Safer crossing facilities and improved lighting…
Wider pavements
Less traffic
Walking apps/Wearable tech incentives
Other people to walk with
0 500 1,000 1,500 2,000 2,500 3,000
Number of Responses
UoB Staff Students
Figure 9 shows that safer crossing facilities, improved lighting and wider pavements would
encourage more staff and students to walk to university. Less traffic on routes is also
identified as a key issue across both groups. Most of these factors are outside of the control
of the University as we do not have jurisdiction to alter the highway however the installation
of the ‘Path to the vale’ has provided a safe and pleasant route to campus for staff and
students away from traffic.
Open responses to a later question have also highlighted the lack of lighting on campus
which will be addressed by the University Estates team. A large proportion of students have
also stated that due to safety concerns in Selly Oak they would be more encouraged to walk
if group walking was organised.
As in previous years distance has been highlighted as the primary barrier to walking
especially amongst staff.
22Encouraging staff and students to cycle to the University
Respondents were asked what measures would most encourage them to cycle to University;
they were asked to choose up to four options.
Figure 10: Encouraging staff and students to cycle
Encourage to Cycle
Other
Nothing would encourage me
Improved signposting of cycle routes
I live too far away to cycle
Other people to cycle with
Option to trial a bike
Financial assistance purchasing a bike (salary…
Availability of hire bikes (bike share)
Improved cycling infrastructure close to campus…
Opportunities for cycle training to improve…
Improved cycle security
0 500 1,000 1,500 2,000 2,500 3,000 3,500
Number of Responses
UoB Staff Students
Figure 10 illustrates that to encourage cycling, the most important factor is improved cycling
infrastructure close to campus for both staff and students. This has been a common theme
since the travel survey began in 2008 and is reflected nationally as a key barrier to cycling.
The opening of the A38 and A34 cycle tracks in 2019 will provide a safer, segregated route
from the north of the city through the city centre to the main Edgbaston campus which is
welcomed. The University will however continue to lobby for safer, segregated routes via
engagement with Birmingham City Council.
Cycle security has again been highlighted as a barrier particularly amongst students. The
University has experienced a spate of cycle theft during the period the survey was
conducted which has further increased concerns. Almost all thefts are to bikes that are
either not secured correctly or with insufficient cable lock. This highlights a need for more
promotion of D Locks and best practice.
As with walking, distance is a key barrier to cycling.
23Encouraging staff and students to travel by public transport
Respondents were asked which measures would most encourage them to travel by public
transport to University; they were asked to choose up to four options.
Figure 11: Encouraging staff and students to use public transport
Encourage to use Public Transport
Nothing would encourage me
No nearby public transport links
Less crowded services
More reliable services
More frequent services
Improved security on transport
Improved ticket and timetable information
Increased discount on tickets
Interest free loan for a season ticket
0 500 1,000 1,500 2,000 2,500 3,000 3,500 4,000
Number of Responses
UoB Staff Students
As in previous years reliability and frequency of services were highlighted as key factors in
encouraging more use of public transport. This has been particularly highlighted by staff.
Students have also stated than an increased discount in the price of tickets would be a big
encouraging factor. It should be noted that local bus providers do provide significant student
discounts in addition to the £1 special fare introduced in 2017 between Selly Oak and the
city centre. Students can also access railcards to discount train prices however this is not
valid during peak times.
24Encouraging staff and students to car share
Respondents were asked which measures would most encourage them to car share to
University; they were asked to choose up to four options.
Figure 12: Encouraging staff and students to car share
Encourage to Car Share
Other
Nothing would encourage me
Guaranteed lift home in emergency or if let down
by driver
Priority parking bays for car shares
Finding car share partners with similar work hours
Dedicated university car share scheme
0 500 1,000 1,500 2,000 2,500 3,000 3,500
Number of Responses
UoB Staff Students
As in previous years a barrier to car sharing is finding other people that work or study at
similar times. This is the key factor for people considering car sharing.
The University has invested considerably to a car sharing system called Liftshare which is
available to staff and students. The scheme has 57 priority car parking bays which would
indicate more promotion needs to be done with both groups.
Awareness of sustainable travel initiatives
For the 2018 survey a question was added asking respondents if they were aware of the
numerous incentives and benefits available to them as staff and students at the University.
Staff awareness
Amongst staff 60% are aware of the salary sacrifice scheme for bicycles but only 21% aware
of the staff loan bike scheme. As you would expect more visual incentives such as the
Urban Cycles shop (66% of staff respondents aware) and priority car parking bays (54%)
have the highest levels of awareness.
Only 22% of staff are aware of the 25% discount available to staff on National Express
buses which indicates that more needs to be done around this initiative. More encouragingly
39% of staff were aware of the relatively new £1 fare on local bus services.
25Areas with low awareness amongst staff need more promotion include the Liftshare system
(25%), the availability of folding Brompton ‘pool’ bikes (7%) and the opportunity to buy a low
emission vehicle via salary sacrifice (13%).
Student awareness
Students indicated that they have reasonable awareness of the public transport initiatives
and incentives on offer to them. In particular 43% are aware of the additional train ticket
machines on campus while 39% have awareness of the new £1 fare on local buses and 40%
aware of the free shuttle bus service on campus.
Only 22% of students indicated they are aware of the fact discounted D Locks are available
to buy on campus. This will be covered in more detail in the conclusion but further
promotion and engagement is required to help reduce cycle crime on campus.
Open responses
Respondents were given the opportunity to provide comments on their travel and issues they
would like to raise. These are broken down in to categories and summarised in the tables
below.
Table 11: Summary of contents relating to cycling
Cycling facilities on More covered and secure cycle parking is needed
campus Specifically around Medical School, University
centre, Arts and Gisbert Kapp
Increased capacity – some areas are full
More shower, changing and drying facilities for
cyclists
Bike share scheme would be welcome
Route improvements and Improvement of roads around campus specifically
suggestions Edgbaston Park Road,
More segregated, safe cycling routes on local roads
More cycle routes on campus
More notice if cycle routes around campus are to be
blocked by developments
Improvements to canal access make cycling to
University better
Safety issues Local roads viewed as too dangerous to cycle on
Fear of motorists
More lighting on off road routes
Incentives Cycle to work scheme is good
Help with purchase of E-bikes
26Table 12: Summary of comments relating to buses
Service provision Suggestions of using Selly Oak campus for park and ride for
staff
More regular services on 76 and 48
Improved service from Harborne and Bearwood
Frequency Some negative comments around changes to frequency
since recent route changes in particular the 48
Cost New £1 fare promotion well received and useful for journeys
to city centre
Reliability Lack of bus lane provision leading to long journey times
Improve reliability of 76
Shuttle bus service Service starts too late for staff to utilise
Provision during non-term time
Shuttle service for students in accommodation further afield
such as Liberty Gardens and Queens Hospital Close.
Table 13: Summary of comments relating to train
Service provision Cross City is over capacity – rarely able to sit
Need bigger trains
Frequency / reliability Cross City not reliable
Cost Season tickets not affordable
University station Queues and delays getting off at station
Overcrowded platforms
Safety Anti-social behaviour on trains
Overcrowding on platforms at University is a concern –
feels dangerous
27Table 14: Summary of comments relating to walking
External issues Crossing at Somerset Road identified as dangerous
especially at rush hour
Lack of lighting in Cannon Hill park when walking and
cycling
Crossing needed on junction of Pritchatts Road and
Vincent Drive
Inattentive drivers on local roads
Pavements locally covered in leaves and are slip hazard
Improved lighting needed on canal
Campus issues More lighting on campus
Bad driving on campus
Safety Don’t feel safe walking after dark in Selly Oak
Respondents don’t feel safe walking after dark with
laptops etc
More security presence on campus and in Selly Oak
Suggestion a of a ‘walking bus’ to Selly Oak after dark
Install emergency call points for students walking home
Initiatives or incentives Rewards for people who walk
Facilities Need access to a shower
Positive comments Walk from Vale very pleasant
Walking has health benefits and should be encouraged
Journey time is consistent
Table 15: Comments relating to car sharing and car parking
Car sharing priority bays Need for more bays as often full
Time should be extended to 10 from 9:30
Reports of abuse of the car share bays
Introduce sharing bays for students
Car sharing suggestions Opportunity to car share with QE colleagues would be
welcomed
Car parking issues More provision for staff with carer responsibilities
Perceived lack of car parking on campus
Mailing list for permit holders suggested to make them
aware of car park closures
Staff and student car parking on local roads leading to
congestion: Bournbrook area highlighted
Complaints around contractor parking
Park and ride scheme suggested
Car parking too cheap
Car parking permits Negative comments regarding introduction of purple
permits
Electric vehicles More EV chargers on campus
28Section 5: Recommendations
Recommendations to improve student travel
To encourage more walking and cycling to the University, it is recommended that the
following measures are taken in to considerations, when updating the Sustainable travel
plan:
Safety has been highlighted by students as a barrier to active travel. Students do not
feel safe walking in Selly Oak after dark and that they feel lighting on campus needs
to be improved also. In addition students have highlighted a need for better cycle
infrastructure around campus as cycling on surrounding roads is viewed as
dangerous.
Increased promotion of the new ‘Selly Express’ night bus service for students living in
Selly Oak
Improvements need to be done by local stakeholders including Birmingham City
Council to improve pedestrian safety and increase road crossings. Areas such as
the crossing of Somerset Road, Vincent Drive and Pritchatts Road were all identified
as dangerous by students.
Improvements to cycle parking both in terms of quantity and quality. The lack of
secure and covered cycle parking across campus is viewed as a barrier to cycling.
Cycle security is still perceived as a big issue by the student population despite
continued efforts to promote the discounted D Locks available on campus and a new
scheme to offer free D Locks and security marking to students. Increased
communication is needed around personal responsibility to bike theft as students
continue to use insufficient cable locks to secure their bikes. Continued promotion of
D –Locks and best practice to tackle bike security.
Large scale promotion of the new A38 cycle track once completed
Increased awareness for students of the availability of cycle training on campus
Measures undertaken since 2016
Opening of shared ‘path to the Vale’ alongside Edgbaston Park Road providing a
safe and pleasant alternative for students to walk and cycle along when travelling to
campus
Introduction of ‘Selly Express’ evening bus service from campus in to Selly Oak
Removal of all ‘wheel bender’ cycle parking on campus and replaced with Sheffield
stands at JG Smith, Chemical Engineering and Education building
Additional cycle parking provision around University Centre, Alan Walters building,
Sports & Fitness centre and Chemical Engineering
Continued growth of student bike hire scheme – 17 additional bikes added to the pool
since 2016
Improved canal access at University station and widening of Edgbaston Tunnel
making canal more attractive for walking and cycling
‘Bikeability’ training offered to all student bike hirers and at regular events throughout
the year
29In terms of public transport, the following recommendations should be given consideration
for updating the University travel plan:
Increase promotion and awareness of ticketing offers available to students on local
public transport
Promotion of University shuttle bus service between main campus and Selly Oak
Continue to cascade use of additional train ticket machines on campus to avoid
crowding the station unnecessarily
Measures taken since 2016:
Installation of a further ticket machine on campus to reduce pressure on University
station at peak times
Worked closely with London Midland and now West Midlands Trains to increase
staffing at University station
Secured a special £1 fare for staff and students on selected National Express
services between Selly Oak and city centre
University is a key stakeholder in the plans for redevelopment of University station
Lobby our key rail and TFWM stakeholders to ensure smart ticketing is available as
standard on all forms of public transport locally.
Recommendations to improve staff travel
To encourage more staff to walk and cycle to work it is recommended that the following
measures are taken in to consideration when updating the Sustainable Travel Plan:
Work with Birmingham City Council to improve pedestrian safety on roads around
campus
Increase the quantity and quality of cycle parking on campus. More secure and
covered cycle parking has been identified as a key issue amongst staff and students.
Improvements to cycle security on campus
Continued promotion of safe local cycling routes including the canal and soon to be
opened cycle route along the A38
Work collaboratively with Birmingham City Council to develop further improvements
to local cycling infrastructure
Promotion of the staff loan bike scheme at inductions and other engagement events
Further promotion of University owned folding Brompton bikes to increase active
business travel
Measures that have been undertaken since 2016
Further growth of staff loan bike scheme – now 7 bikes available
Introduction of two folding Brompton bikes for offices / teams to use as a pool bike
option
Regular led rides and training available to staff as part of events on campus
focussing on Wellbeing and national awareness days
30In terms of public transport, the following recommendations should be given consideration
for updating the University travel plan:
Increased promotion of special £1 fare to staff at inductions
More targeted promotion of 25% discount
Working closely with rail partners to deliver a new train station in the next 4 years
bringing substantial improvements for commuters
Continue to work collaboratively with National Express and other operators to
improve route provision and reliability for campus
Promotion of ticket machines on campus to avoid queues at University station
31Section 6: Conclusion
The 2018 travel survey results are generally positive and have reversed some of the
negative results seen in 2016 around single occupancy car usage. Since 2016 the
University has employed a Sustainable Travel Co-ordinator (STC) who has been assigned
the responsibility of reducing the number of single occupancy journeys and increasing
sustainable travel to campus. The STC role has targeted inductions and engagement with
staff to improve awareness of the sustainable travel initiatives on offer to staff. Students
have been discouraged to bring vehicles from the onset of their studies and are actively
engaged throughout their academic cycle to use active travel and the public transport
options available. There is also targeted engagement during the ‘Welcome’ period to ensure
students are provided with as much information as possible on arrival and encouraged to
leave their cars at home.
For staff, the University has seen a 3.5% decrease in single occupancy car journeys which
brings it closer to the 5% reduction target set in 2008. There has also been a 2% increase in
cycling amongst staff with similar small increases on public transport. The modal shift for
staff seems to be a move away from walking which will be examined in more detail later.
Amongst students the results are similarly encouraging with reduction in single occupancy
car usage of 3.4%. As expected active travel methods are still the primary option for
students with some small increases in walking and cycling. Bus and train usage has also
increased.
In 2016 the results of the survey suggested that staff had shifted away from public transport
due to issues with University station and the unreliability of services (both bus and train). In
the last 2 years the University has worked closely with West Midlands Trains (previously
London Midland) to improve the customer experience and safety at University station. A
further ticket machine was installed on campus to reduce pressures on the station at peak
times. In addition, the train operator allocated more staff to the station to manage the
queues. Engagement with the student population has also taken place encouraging them to
buy tickets in advance and use mobile ticketing where possible.
Reliability and frequency of services was highlighted by staff as the main reason for a shift
away from bus usage in 2016. The University has been proactive in sharing this intelligence
with bus operators via regular stakeholder meetings to ensure the requirements of our staff
and students are met. One of the notable successes of this approach has resulted in the
introduction of a new 1A service from Moseley. This has long been highlighted as a gap in
the network for staff and students wanting to travel by bus and is evidence of the
effectiveness of the collaborative approach the University has taken with operators.
Another example of improvements to the local bus provision is the introduction of a new £1
fare for staff and students on selected services between Selly Oak and the city centre. This
has been particularly popular with students as offers them a convenient and cheap method
of reaching the city centre. This has reduced pressures on the Cross City Line train services
as more students opt to take the bus. National Express have also introduced new ‘Platinum’
buses on a number of services around the campus which provide comfortable seating, WIFI
and USB charging making them a more attractive proposition especially for students. The
32introduction of contactless payments on local bus services has made bus travel more
convenient.
University station and issues around overcrowding and reliability on the Cross City Line have
contributed to the limited modal shift to rail. The University is working together with partners
to deliver a station able to manage a substantial increase in commuters from economic
growth of the area. Projected increase is 7.5m footfall pa by 2030 against current build size
of 0.75m The anticipated new station together with the introduction of new ‘rolling stock’ on
the Cross City Line will lead to large improvements by 2021. In the meantime the University
will continue to work with West Midlands Trains to improve conditions for staff and students
wherever possible.
It is clear that improvements to access on the canal; increases in the availability of hire bikes
for both staff and students and continued promotion of cycling has worked with growths in
numbers amongst all groups. A 2% increase in the number of staff cycling is significant and
reflects the emphasis the University has put on promoting cycling. The staff loan bike
scheme has gone from strength to strength with over 50 staff loaning a bike since 2016.
Feedback on the scheme is very positive with staff mentioning how the opportunity to ‘try
before you buy’ has really encouraged them to adopt cycling. Staff are also offered support
in route planning. A large proportion of the staff who loan bikes go on to purchase their own
via the salary sacrifice scheme. The student loan bike scheme is also increasingly popular
and has grown by more than 50% since 2016 enabling more students to get access to a
good quality bicycle and support from Urban Cycles.
Historically access to the canal has been an issue for cycle commuters due to the previously
steep steps at University station. In 2017 a bespoke cycle/pedestrian stair access was
installed with wheeling ramps for bicycles which enabled commuters to transfer their bikes
with considerable ease. The previously narrow Edgbaston Tunnel has been widened
resulting in improved accessibility.
Whilst the above improvement is welcomed and has had a positive impact on cycling
numbers the lack of safe local cycling infrastructure is still a key barrier to cycling amongst
all groups. There has been little improvement locally since 2016 however this will change
with the completion of the new A38 cycle track which ends at the main University campus.
This will provide a segregated and safe route for people to cycle from the city centre and
further afield with the A34 route in North Birmingham also set for completion.
Another barrier to cycling is the risk of theft and this has again been highlighted by all
groups. The University currently offers discounted D Locks for staff and students; in addition
to recently introducing a scheme to offer free security marking and D Locks for students.
However there is a lack of ample secure cycle parking on campus which will be addressed
and improved in 2019. These improvements coupled with ongoing promotion of D Locks
should mitigate these concerns going forward.
The University has been selected to host a number of bike share stations as part of the
wider West Midlands scheme being operated by NextBike. The scheme will deliver
5,000bikes across the region and the University will see stations located at key locations
across campus and halls of residence giving staff and students another sustainable travel
option.
33The sole discouraging trend of modal shift since 2016 has been the reduction in staff walking
to campus. It was noted in 2016 that scope for increasing the number of staff walking was
limited by commuter distance however the decrease of 3% is concerning. Comments
received in relation to walking highlight unsafe crossings on roads around campus in
particular Somerset Road, Edgbaston Park Road and Vincent Drive. These concerns have
been raised with Birmingham City Council previously and the University will continue to
lobby. In 2016 the University built a new pathway from The Vale to main campus which
improved active travel safety from campus sites however the crossing at Somerset Road has
again been highlighted as dangerous.
One theory for the reduction of staff walking could be increased awareness of air quality
issues nationally. Staff have highlighted that they would be more open to walking if the
environment was less car dominated and pleasant.
A seasonal difference of when the survey was conducted could also have influenced the
number of staff walking. The 2016 survey took place in May and June whilst the 2018
survey was conducted in the October.
The recent introduction of 20mph speed limits on local roads surrounding the campus aims
to reduce speeds locally and create a more attractive environment for walking and cycling
which will go some way to reversing this negative trend.
Car sharing amongst staff has increased since 2016 by 1.7%. The University used postcode
mapping data in 2016 to highlight the numbers of staff commuting from similar areas in
single occupancy cars and promote car sharing further. The introduction of priority car
parking bays on campus has led to a rise in the number of staff using the Liftshare system
and car sharing to the University. There are now 57 car sharing bays on campus with plans
for more in 2019 as well as a proposed extension of the time the bays are reserved for in
order to accommodate staff who arrive later on campus. The University will also implement
a new ‘authentication’ feature to Liftshare in 2019 that will enable real time reporting on car
sharing which will help to identify trends and areas for improvement.
34Appendix A: Staff based in the UK
35Appendix B: Staff based in the West Midlands
36Appendix C: Staff who walk or cycle
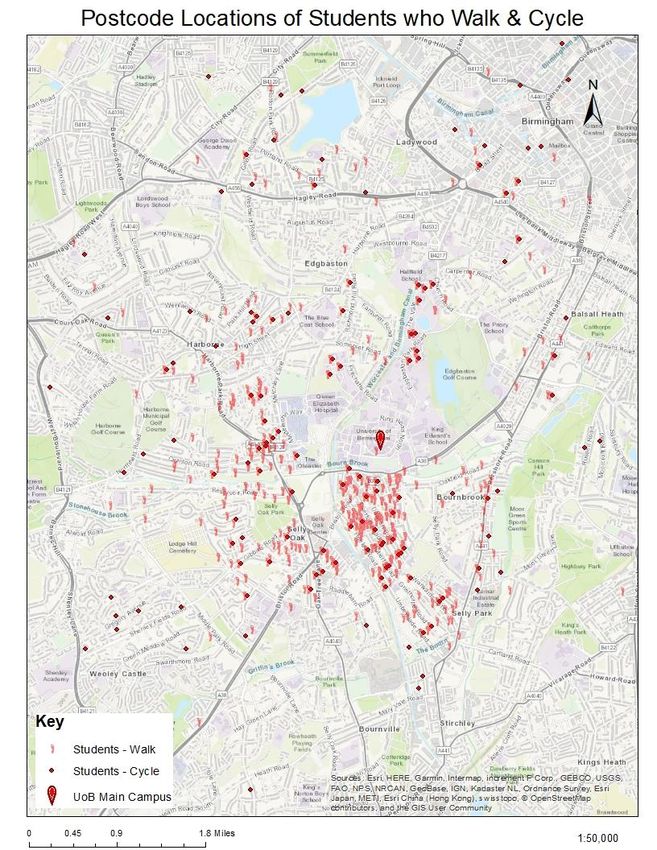
37Appendix D: Students who walk or cycle
38Appendix E: Staff who commute by bus
39Appendix F: Students who commute by bus
40Appendix F: Staff who commute by train
41Appendix G: Students who commute by train
42Appendix H: Staff who travel by vehicle
43Appendix I: Students who travel by vehicle
44You can also read