2020 AUSTRALIA NATIONAL REPORT - Who Makes the News
←
→
Page content transcription
If your browser does not render page correctly, please read the page content below
AUSTRALIA

       NATIONAL REPORT

2020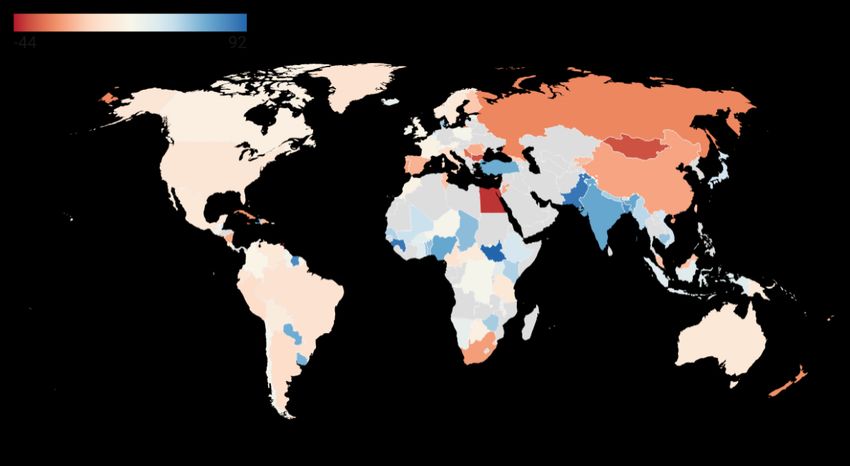
Global Media
  Monitoring
  Project

  2020

GMMP 2020 is licensed under creative              In Partnership with
commons using an Attribution-
NonCommercial-NoDerivs.

GMMP 2020 is co-ordinated by the World
Association for Christian Communication
(WACC), an international NGO which
promotes communication for social
change,.

Data for GMMP 2020 were collected
through the collective voluntary effort of
hundreds of organizations including gender
and media activists, grassroots
communication groups, university
researchers, students, media professionals,
journalists associations,
alternative media networks and faith
groups.
Noncommercial. You may not use this
work for commercial purposes.
No derivative Works. You may not
alter, transform, or build upon this
work.
For any use or distribution, you must
make clear to others the license              .
terms of this work. Your fair use and
other rights are in no way affected by
the above

Acknowledgements

I am enormously grateful to the many people who helped to gather samples of newspapers,
broadcast bulletins and online stories. This proved challenging in 2020 due to the impacts of
technological changes, economic instability, and the COVID-19 pandemic on the news
media industry. Large newsagents were no longer selling newspapers from every state,
accepts for postal deliveries were not being accepted, and online services of newspapers
and other news media were using a wide range of systems and formats that affected how
stories were collected and stored.

Alice Steiner provided essential assistance in her typically quiet, efficient, and intelligent way
with advice about how to record and store radio bulletins and some newspapers. Paul
(Campo) Campion brightened my day with his enthusiasm and generous offer to collect
multiple radio bulletins. Kathryn Bowd, Karen Marchant, and Alex Wake all provided much
appreciated assistance by sending newspapers from South Australia, the Northern Territory
and Victoria respectively. Charlotte Flew was calm and supportive when assisting with on-
the-day collection of online samples.

I owe thanks to the Queensland University of Technology journalism students and future
media leaders who became involved: Elizabeth Aboud, Shanelle Adams, Hannah Davies,
Nicole Keramos, Holly Payne, Isabella Pol Bodetto and Matthew Tsimpikas. All showed a
passion for exploring issues affecting equity in news journalism. They helped with some of
the newspaper and/or data analysis. Charlotte Flew and Erin Godwin were other helping
hands who assisted in analysing the stories.

Each person’s contribution is outlined in more detail in Annex 2. Thank you to all of you for
helping to make this report possible.

                                                                             Angela Romano
                                                         Queensland University of Technology
                                 Australian Coordinator, 2020 Global Media Monitoring Project
Table of Contents
PREFACE ___________________________________________________________________________ 6
Global Context ____________________________________________________________________ 6
National Context __________________________________________________________________ 7
EXECUTIVE SUMMARY ________________________________________________________________ 9
A DAY IN THE NEWS IN AUSTRALIA _____________________________________________________ 10
THE CONTEXT ______________________________________________________________________ 11
TOPICS IN THE NEWS ________________________________________________________________ 13
NEWS SUBJECTS AND SOURCES ________________________________________________________ 14
JOURNALISTS AND REPORTERS ________________________________________________________ 18
FOCUS ON COVID-19 NEWS ___________________________________________________________ 19
SUMMARY, CONCLUSIONS AND RECOMMENDATIONS _____________________________________ 21
REFERENCES _______________________________________________________________________ 23
Annex 1. Methodology _________________________________________________________________ 24
Annex 2. List of Monitors and Data Coders _________________________________________________ 26THE WORLD AT A GLANCE
GENDER GAP IN SUBJECTS, SOURCES AND REPORTERS IN THE NEWS.
.
Figure 1. Gender Gap: News Subjects & Sources. Newspaper, radio, and television news.
Data source: Global Media Monitoring Project, 2020
Figure 2. Gender gap: Reporters in the stories. Newspaper, radio, and television news.
Data source: Global Media Monitoring Project, 2020
5PREFACE
Global Context
The Global Media Monitoring Project (GMMP) is the world’s longest-running and most
extensive research on gender in the news media. The research was designed to capture a
snapshot of gender on one ‘ordinary’ news day in the world news media. An ordinary news
day is defined as one in which the news agenda contains the run-of-the-mill mix of stories,
everyday articles on politics, economy, social issues, crime, and other issues.
It began in 1995 when volunteers in 71 countries around the world monitored women’s
presence in their national radio, television, and print news. The media monitoring has been
repeated every five years since then, taking stock of change in the gender dimensions of
news media content and collecting statistical data on new indicators.
The 1995 research revealed that only 17% of news subjects – the people who are
interviewed or whom the news are about – were women. It found that gender parity was ‘a
distant prospect in any region of the world. News [were] more often being presented by
women but [they were] still rarely about women (MediaWatch, 1995).
The first noteworthy change in women’s overall presence in the news was registered in 2005
in the third iteration of the research (Gallagher, 2005). Women comprised 21% of news
subjects, a three-percentage point increase over the period 2000 to 2005. Their near
invisibility continued however, with only 10% of stories focusing centrally on women,
underrepresentation in the major news topics and as voices in the news.
By the fifth GMMP in 2015, it was clear that “ordinary” news days could not be predicted or
planned in advance: unexpected events take place that dominate the news, from the Kobe
earthquake in 1995, to the Germanwings plane crash in the Alps in 2015.
The 2015 research in 114 countries revealed continued severe gender disparities in news
media content. Findings on key indicators suggested that progress towards gender equality
had lost traction; women remained only 24% of the persons heard, read about, or seen in
newspaper, television, and radio news, exactly the same level found in the fourth wave of
the research in 2010. Three editions of the research – in 2005, 2010 and 2015 – found no
change on the indicator measuring women’s participation in the news as reporters; only 37%
of stories in legacy media were reported by women.
Women’s relative invisibility in traditional news media had also crossed over into the digital
news delivery platforms included in the GMMP monitoring for the first time. Only 26% of the
people in stories on mainstream news websites and media news Tweets combined were
women. The challenges of news media sexism, gender stereotyping and gender bias were
apparently intractable across time, space, and content delivery platforms.
6UN Under-Secretary-General and UN Women Executive Director Phumzile Mlambo-Ngcuka
underlined that the ways in which women are depicted in the media “have a profound effect
on societal attitudes and reinforce traditional gender roles. Women and girls are half of
humanity. Giving equal time and weight to their stories, featuring them as positive models not
victims, plays an under-appreciated part in creating a better, freer world for all of us”
(Macharia, 2015).
Events during the 2020 GMMP year were even more extraordinary; beginning in late 2019
and intensifying during the year, the world was ravaged by the novel coronavirus Covid-19.
This sixth wave of the research offered an opportunity to scrutinize gender in media
coverage during a global catastrophe, a time marked by a worldwide health crisis, and the
intensified inequalities accompanying the crisis.
GMMP teams in 116 countries monitored 30172 stories published in newspapers, broadcast
on radio and television, and disseminated on news websites and via news media tweets in
2251 outlets. The stories contained 58,499 news subjects and sources and were reported
and presented by 28,595 journalists. The number of participating nations increased by 63%
since 1995 as baseline data were collected for eight countries joining the study for the first
time. The number of news items monitored has doubled over the past 25 years and risen by
over 8,000 since the 2015 edition.
Findings from the sixth GMMP reveal a mixed picture of progress, stagnation, and
regression. While some glass ceilings are clearly being edged upwards, others are setting in
on certain important news media gender equality indicators, The past five years have seen
small incremental changes towards parity, at the same time, the overall pace of change
remains glacial.
National Context
Research about Australian journalism has shown for several decades that women have
been underrepresented or typecast in news media stories. Men appear in a far wider range
of roles and positions, tending only to be absent from news stories for a limited range of
functions, such as homemakers (e.g., Price & Payne, 2019; Romano & De Ponte, 2002;
Romano, 2010). Other research has identified a masculine culture in newsrooms (e.g.,
North, 2014), and despite increasing numbers of women in newsrooms in recent decades, a
predominance of men in top leadership positions (e.g., Bacon & Dalley, 2013). Much of this
research has involved content analysis or interviews that have been conducted over limited
periods of time. Even though many of these research activities have been small in scale, the
findings have repeatedly told the same story – that women are substantially
underrepresented in the Australian news media as sources of news and, until recently, as
the reporters of news. The sample of stories studied in the 2020 GMMP Australia report
found that parity had been reached in this sample of stories in terms of the number of
appearances of women as news presenters and reporters compared to their male
counterparts. It indicated that deficits remain in the number and variety of representations of
women who are quoted or discussed in Australian news media stories.
Across Australian society overall at the time the 2020 GMMP research was conducted,
gender equity was relatively high by global standards, but there were many areas where
improvements were needed. In national politics, there was an equal representation between
male and female parliamentarians in the federal upper house, the Senate, although women
comprised only 29 per cent of members in the lower house, the House of Representatives.
Of Australia’s six states and two territories, two had female heads of government. The
Australian Bureau of Statistics’ Gender Indicators, Australia: 2020 report indicates clear
7gender differences in terms of employment, education, suicide rates and crime rates. The
workforce participation rate was two-thirds for women (67.6 per cent) compared to more
than three-quarters for men (78.1 per cent). Men comprised two-thirds (61.4 per cent) of
managers and more than four in five (82.9 per cent) of Chief Executive Officers (CEOs). In
May 2020, women’s full-time average earnings were 86 per cent of that of men, despite
women having higher educational attainments than men on average. For Australians aged
20-24 years, 92.5 per cent of women compared to 87.5 per cent of men have completed
high school or higher qualifications. Among Australians aged 18-64, 37.1 per cent of women
had attained a bachelor’s degree compared to 29.4 per cent of men. In terms of safety and
well-being, females (4.4 per cent) aged 15 or older were slightly less likely than males (5.2
per cent) of the same age bracket to have experienced actual or threatened physical assault
in the past 12 months. By contrast, there was five times the number of recorded incidents of
sexual assault of females than for males. Men’s rate of suicide was three times higher (19.8
per cent) than that of women (6.3 per cent) after standardizing for age. In terms of criminal
activity, men comprised 92.6 per cent of sentenced prisoners. Among the prison population,
males were far more likely to have been sentenced than females for ‘acts intended to cause
injury’ (18.5 per cent compared to 13.5 per cent) and ‘sexual assault and related offences’
(15.9 per cent compared to 1.9 per cent).
Domestic violence, sexual harassment, sexual assault, and gender-based violence are
regular topics in political, crime, courts, and other news stories. The Australian Human
Rights Commission in 2017 found that Australia has a ‘disturbingly high rate of violence
against women’. The Commission found concerns about family and domestic violence,
sexual assault, sexual harassment, violence in residential settings and online violence and
harassment. A subsequent report by the world’s first national inquiry into sexual harassment
in the workplace found that harassment was pervasive for all genders, but women were
more likely (39 per cent) to experience such harassment than men (26 per cent) (Australian
Human Rights Commission, 2020).
Issues relating to LGBTIQ+ (lesbian, gay, bisexual, trans and gender diverse, intersex, and
queer and questioning) people are regularly on news and social discussion agendas. A
voluntary postal survey, which was circulated by the Federal Government in 2017 on the
issue of same-sex marriage, generated enormous public debate. After 61.6 per cent of
survey respondents voted in favour, same-sex marriage was ratified through national
legislation. Other topical issues have been puberty blockers and gender reassignment for
young people who identify as transgender, and suicide rates and the mental health of
LGBTIQ+ individuals.
8EXECUTIVE SUMMARY
The Australian study for the Global Media Monitoring Project (GMMP) involved an analysis
of 570 stories that were sampled from 37 Australian newspapers, radio and television
stations, and internet news services on September 29, 2020. This snapshot of reporting on
that day indicates that women are underrepresented as sources who are quoted or
discussed in Australian news stories.
Females made up only 32 per cent of the 1706 news sources who were heard, written
about, or seen in the stories that were studied, even though women and girls form a little
more than half the population (50.4 per cent). Neglect of females was particularly noticeable
in the three types of sources that dominated the news. Out of people who were quoted or
discussed in the sampled stories, females were 24 per cent of politicians, 15 per cent of
sportspeople and 16 per cent of businesspeople. Females did, however, dominate when
journalists quoted or discussed a parent/homemaker, comprising 76 per cent of sources in
that category.
In the stories sampled for the 2020 Australian GMMP study, there was parity in the number
of female and male reporters. In terms of anchors who presented bulletins, female anchors
outnumbered males in television and male announcers outnumbered females in radio. For
the first time since the five-yearly GMMP studies commenced in 1995, females have
outnumbered males in the percentages of reporters and presenters combined, mainly due to
the large number of television stories in the sample.
Fast Facts
Most Frequently Quoted Positions/Occupations Female Sources Male Sources
Politician, member of parliament 24% 76%
Sportsperson, coach, or referee 15% 85%
Businessperson, executive, manager, stockbroker, etc 16% 84%
Lawyer, judge, magistrate, etc 44% 56%
Govt employee, public servant, spokesperson, etc 43% 57%
Police, military, para-military, militia, fire officer 15% 85%
Parent, homemaker 76% 24%
Media professional, journalist, filmmaker, etc 30% 70%
Celebrity, artist, actor, TV personality, writer, singer 50% 50%
Reporters and Presenters of News Female Male
Reporters (All Media) 49% 51%
Radio Presenters 42% 58%
Television Presenters 77% 23%
Journalists/Presenters Overall (All Media) 56% 44%
For further information, please contact the report’s author:
Dr Angela Romano
Associate Professor of Journalism, Queensland University of Technology
Australian Coordinator, Global Media Monitoring Project
Email: a.romano@qut.edu.au
9A DAY IN THE NEWS IN AUSTRALIA
On September 29, 2020, Australia’s news media were covering the grim milestone that the
world had reached 1 million COVID-19 related deaths. Media organizations followed a wide
range of different COVID-related issues, although there was no COVID-related topic that
dominated the news agenda. Stories outlined how the pandemic was affecting travel to and
within Australia, breaches of border restrictions, impacts on the economy and employment,
challenges to maintaining mental and physical health, social and cultural activity, COVID
outbreaks in aged-care facilities, purported mismanagement of quarantine hotels that led to
increased transmission of the disease, and other COVID-related matters.
In domestic news, a big story was the finalization of a damages claim against the owners of
the Dreamworld theme park in which a poorly maintained ride had malfunctioned, claiming
the lives of four people. It was annual, national Police Remembrance Day, resulting in
coverage of men and women in the force who died in accidents or due to crime in the course
of their duties. Other prominent domestic stories were an industrial dispute involving
waterfront workers and the latest developments from an ongoing investigation into
allegations of corruption connected to the casino businesses of Crown Resorts Limited. In
international news, topics under discussion were US President Donald Trump’s tax affairs
and an announcement that a royal couple, British Prince Harry, and American actress
Meghan Markle, were planning to become involved in a reality TV show.
Australia is a nation of sports lovers, so there were numerous sports stories among the main
news mix. These prominently featured personalities and events in men’s sport, such the
Brisbane Broncos rugby league team signing a new coach, drug charges being laid against
two Australian Football League (AFL) players, forecasts about weekend events, and other
reports about sportsmen. There was some coverage of women’s sport, including controversy
about one netball team’s decision not to give its sole Indigenous player time on court during
the Indigenous Round, the signing of a new male coach for the Australian women’s soccer
team, and selections of new players for the AFL Women’s competition. French Open
updates focused on male tennis players, with a smaller number of mentions of female
players.
10THE CONTEXT
Australia’s main news media services are provided by two-state funded broadcasters, three
commercial free-to-air television networks, one pay television network, and many
newspapers, radio stations and online new services. Australian news media organisations
are experiencing financial challenges due to the long-term impacts of changes in audiences
in the digital era and the short-term impacts economic impacts of the COVID-19 pandemic.
This led to the closure of many news organizations in 2020 and reductions in the length of
newspapers or news bulletins, with the impact particularly notable among smaller news
organizations in regional Australia.
Nine daily newspapers were studied, representing a spread of major newspapers from
across Australia. These were one national newspaper, The Australian, and a mix of
newspapers from all but one of Australia’s six states and two self-governing territories.
Newspaper Area Serviced
The Advertiser State of South Australia, particularly the capital, Adelaide
The Australian National
The Age State of Victoria, particularly the capital, Melbourne
The Canberra Times Australian Capital Territory, particularly the capital, Canberra
The Courier-Mail State of Queensland, particularly the capital, Brisbane
Daily Telegraph State of New South Wales, particularly the capital, Sydney
NT News Northern Territory, particularly the capital, Darwin
Herald Sun State of Victoria, particularly the capital, Melbourne
The Mercury State of Tasmania, particularly the capital, Hobart
Sydney Morning Herald State of New South Wales, particularly the capital, Sydney
Australia’s main television services are provided by six large networks. Two are national
public broadcasters, the Australian Broadcasting Corporation (ABC) and Special
Broadcasting Service (SBS). Major news services are also offered by four commercial
networks -- the Seven Network, Nine Network and Network Ten free-to-air services and the
Sky pay television network. The major evening bulletins from ABC, Seven, Nine, Ten and
SBS networks were chosen for the study because the early evening bulletins are the main
news programs for each of the networks. On the Sky network, the Sky News Australia
channel focuses on a mix of information and analysis in the evening, so its latest daytime
bulletin, News Day, was recorded. SBS and Sky News produce national bulletins only. The
ABC, Seven, Nine and Ten networks all produce different bulletins for different cities or
regions. There is a significant amount of sharing of content within networks, so only one
bulletin per network was chosen. Australia’s third-largest city, Brisbane, was chosen as the
city from which to record bulletins. Brisbane is the capital city of Australia’s third-largest state
and is often considered a representative market that has characteristics of both the larger
and smaller capitals in Australia. Content in Brisbane news bulletins includes a mix of local
news, national news, news from other major capitals and occasional news from smaller
cities and regional Australia.
Channel Bulletin Time Broadcast State owned /
Area Commercial
ABC TV ABC News 7:00-7:30pm Brisbane State owned
Seven Seven News 6:00-7:00pm Brisbane Commercial
Nine Nine News 6:00-7:00pm Brisbane Commercial
Ten Ten News First 5:00-6:00pm Brisbane Commercial
SBS TV SBS World News 6:30-7:30pm National State owned
Sky News News Day 1:00pm-2:00pm National Commercial
11In radio, the 8:00 am news bulletins of all commercial stations and the local Australian
Broadcasting Corporation station that serve the city of Brisbane were recorded and
analysed. Brisbane was selected for the reasons outlined in the discussion above about
television bulletins. Additionally, each of the selected radio stations is affiliated with a major
radio network that serves other parts of Australia, thus the sample provides an indicative
representative sample of the style and types of content that is broadcast across the country.
Within networks, there is widescale sharing of content across the stations in the different
cities, thus a very similar range of stories will have been aired in every state and territory.
Name Call Sign Network Owners
ABC 612 AM Australian Broadcasting Corporation
4KQ 693 AM Australian Radio Network Pty Ltd, affiliated with Pure Gold Network
4BH 882 AM Nine Entertainment Co
4BC 1116 AM Nine Entertainment Co
River 94.9 FM Grant Broadcasters (Star Broadcasting Network Pty Ltd)
KIIS 97.3 FM Australian Radio Network (ARN) and Nova Entertainment Co
Triple M 104.5 FM Southern Cross Austereo
Hit 105 105.3 FM Southern Cross Austereo
Nova 106.9 FM Australian Radio Network (ARN) and Nova Entertainment Co
For Internet news, the seven most used news websites were selected based on rankings of
the Alexa Internet and Similarweb web analytic services.
News Service Web Address
ABC News Online abc.net.au/news/
The Age Online theage.com.au
Daily Mail Australia www.dailymail.co.uk/auhome/index.html
The Guardian Australia www.theguardian.com/au
News.com news.com.au
Nine News 9news.com.au
Sydney Morning Herald Online smh.com.au
For Twitter, new services with the largest numbers of followers were selected. Two services
with large followings – MSN Australia and the Daily Mail Australia – were not included in this
sample due to the small number of tweets they produced on September 29, 2020.
News Service Handle
News.com.au @newscomauHQ
ABC News @ABCNews
Nine.com.au @9NewsAUS
The Guardian Australia @GuardianAus
SMH @smh
12TOPICS IN THE NEWS
The GMMP study classifies news stories into seven major topic areas: ‘Politics and
Government’, ‘Economy’, ‘Science and Health’, ‘Crime and Violence’, ‘Celebrity, Arts, Media
and Sports’, ‘Gender and ReElated’ and ‘Other’ (see Figure 1).
Figure 1: Topics of Sampled Australian News Media Stories by Category
Newspapers Radio Television Internet Twitter All Media
Story Category
(N = 140) (N = 73) (N = 166) (N = 99) (N = 92) (N = 570)
Politics and Government 16% 14% 13% 25% 30% 19%
Economy 26% 14% 22% 16% 15% 20%
Science and Health 6% 10% 18% 17% 18% 14%
Social and Legal 21% 10% 13% 2% 10% 12%
Crime and Violence 13% 7% 9% 21% 9% 12%
Gender & Related 1% 0% 0% 3% 1% 1%
Celebrity, Arts, Media & Sports 17% 34% 19% 15% 16% 19%
Other 0% 12% 7% 0% 0% 4%
Overall 100% 100% 100% 100% 100% 100%*
(*Figures in the ‘All Media’ column add to 101% due to rounding, but 100% has been entered in the ‘Overall’ row
as the corrected percentage.)
The ‘Economy’ was the leading news category, making up 20 per cent of the sampled news
stories. Stories ranged from local stories about economic promises made during
Queensland’s state election to coverage of United States President Donald Trump’s tax
payments. Stories about ‘Politics and Government’ comprised 19 per cent of the sample.
‘Celebrity, Arts, Media and Sports’ also comprised 19 per cent of all stories, with the figures
being highest in radio (34 per cent) due to numerous sports stories that featured in radio
bulletins. ‘Science and Health’ stories were 14% of the sample. Almost half discussed
COVID-19, but many other topics were also reported on, including quirky subjects such as
research on how people become left- or right-handed. ‘Social and legal’ and ‘Crime and
violence’ stories were each 12 per cent of the sample. The former included a decision about
damages paid after a fatal accident at a leisure park, accidents, and disasters, such as
wildfires in the US. The latter addressed smaller crimes such as face slapping and spitting to
larger crimes such as drug dealing, corruption, and murder. A few stories (1 per cent) were
gender-related, mainly relating to rape cases. Almost one-third of stories (32 per cent) from
the overall sample included content with a connection to COVID-19 (see Figure 2).
Figure 2. Percentage of News Media Stories that Related to COVID-19 by Category
Story Category Newspapers Radio Television Internet Twitter All Media
(N = 140) (N = 73) (N = 166) (N = 99) (N = 92) (N = 570)
Story Relates to COVID-
Yes No Yes No Yes No Yes No Yes No Yes No
19?
Politics and Government 59% 41% 60% 40% 43% 57% 64% 36% 75% 25% 61% 39%
Economy 56% 44% 20% 80% 33% 67% 56% 44% 50% 50% 45% 55%
Science and Health 50% 50% 14% 86% 47% 53% 18% 82% 59% 41% 41% 59%
Social and Legal 27% 73% 0% 100% 10% 90% 0% 100% 11% 89% 16% 84%
Crime and Violence 17% 83% 0% 100% 7% 93% 10% 90% 13% 88% 10% 90%
Gender & Related 0% 100% 0% 0% 0% 0% 33% 67% 0% 100% 17% 83%
Celebrity, Arts, Media & Sports 33% 67% 0% 100% 3% 97% 27% 73% 7% 93% 13% 87%
Other 0% 0% 0% 100% 9% 91% 0% 0% 0% 0% 5% 95%
Overall 40% 60% 12% 88% 24% 76% 35% 65% 45% 55% 32% 68%
13NEWS SUBJECTS AND SOURCES People who were discussed or quoted in the Australian news media stories that were studied were predominantly male (see Figure 3 below). Overall, 68 per cent were male, 32 per cent were female and less than 1 per cent (0.12 per cent) had other gender identification. In the sample, only two stories discussed people who had other gender identification. Both were Internet news stories that focused on a transgender woman. Newspapers had the highest percentage of female sources, with 36 per cent of sources being female and 64 per cent male. The second-highest percentage of female sources was in Internet news publications with 33 per cent female, 66 per cent male and less than 1 per cent transgender (0.43 per cent). This was followed by television news bulletins with 27 per cent female and 73 per cent male sources, Twitter with 23 per cent and 77 per cent male sources, and radio news bulletins with 19 per cent female and 81 per cent male sources. Radio had a notably lower percentage of female sources than all other media due to the bulletins dedicating a large proportion of time to sports stories and the large numbers of predominantly male players, coaches and other sporting figures being discussed. The low representation of female sources in Australian sports journalism is discussed further below. Figure 3. Male, Female and Other Gender Sources in Different Types of News Media Gender of Print Radio Television Internet Twitter All Media News Source (N = 658) (N = 88) (N = 430) (N = 469) (N = 61) (1706) Female 36% 19% 27% 33% 23% 32% Male 64% 81% 73% 66% 77% 68% Other 0% 0% 0%
Figure 4. Female, Male and Other Gender Sources in Different Categories of Stories
 Story Category                      Traditional Media               New Media                   All Media
                                    Newspapers, Radio, TV         Internet & Twitter
                                         (N = 1176)                   (N = 530)                  (N = 1706)
                                     Female Male       Other Female      Male     Other    Female   Male      Other
 Politics and Government               32%     68%       0%      27%      73%       0%       30%     70%        0%
 Economy                               24%     76%       0%      27%      73%       0%       25%     75%        0%
 Science and Health                    32%     68%       0%      42%      58%       0%       35%     65%        0%
 Social and Legal                      46%     54%       0%      32%      68%       0%       45%     55%        0%
 Crime and Violence                    35%     65%       0%      33%      65%       2%       34%     65%        1%
 Gender & Related                      58%     42%       0%      53%      47%       0%       55%     45%        0%
 Celebrity, Arts, Media & Sports       21%     79%       0%      34%      66%       0%       26%     74%        0%
 Other                                 22%     78%       0%        0%      0%       0%       22%     78%        0%
 Overall                               32%     68%       0%      32%      67%
Figure 5. Occupation of Female, Male and Other Gender News Sources
Occupation of Traditional Media Internet Twitter All Media
News Source Newspapers,
Radio, TV
F M (N) F M X (N) F M (N) F M X (N)
Royalty, monarch,
deposed monarch, etc 60% 40% (15) 17% 83% 0% (6) 0% 0% (0) 48% 52% 0% (21)
Politician, member of
parliament 25% 75% (277) 24% 76% 0% (108) 5% 95% (19) 24% 76% 0% (404)
Govt employee, public
servant, spokesperson, etc 47% 53% (72) 25% 75% 0% (16) 0% 100% (1) 43% 57% 0% (89)
Police, military, para-
military, militia, fire officer 15% 85% (59) 15% 85% 0% (27) 0% 100% (1) 15% 85% 0% (87)
Academic expert, lecturer,
teacher 32% 68% (37) 61% 39% 0% (18) 50% 50% (2) 42% 58% 0% (57)
Doctor, dentist, health
specialist 17% 83% (12) 50% 50% 0% (4) 0% 100% (1) 24% 76% 0% (17)
Health worker, social
worker, childcare worker 0% 100% (1) 60% 40% 0% (5) 0% 0% (0) 50% 50% 0% (6)
Science / technology
professional, engineer, etc 8% 92% (12) 33% 67% 0% (3) 0% 0% (0) 13% 87% 0% (15)
Media professional,
journalist, filmmaker, etc 19% 81% (37) 45% 55% 0% (29) 0% 0% (0) 30% 70% 0% (66)
Lawyer, judge, legal
advocate, magistrate, etc 49% 51% (67) 31% 69% 0% (29) 0% 0% (0) 44% 56% 0% (96)
Businessperson, executive,
manager, stockbroker, etc 15% 85% (80) 20% 80% 0% (41) 0% 100% (1) 16% 84% 0% (122)
Office or service worker,
non-management worker 67% 33% (3) 50% 50% 0% (2) 0% 0% (0) 60% 40% 0% (5)
Tradesperson, artisan,
labourer, truck driver, etc 0% 100% (10) 0% 100% 0% (4) 0% 100% (1) 0% 100% 0% (15)
Agriculture, mining,
fishing, forestry 33% 67% (3) 0% 100% 0% (5) 0% 0% (0) 13% 87% 0% (8)
Religious figure, priest,
monk, rabbi, mullah, nun 0% 100% (8) 0% 0% 0% (0) 0% 100% (2) 0% 100% 0% (10)
Activist or worker in a civil
society org, NGO, or
union 37% 63% (38) 44% 56% 0% (9) 0% 0% (0) 38% 62% 0% (47)
Sex worker 0% 0% (0) 0% 0% 0% (0) 0% 0% (0) 0% 0% 0% (0)
Celebrity, artist, actor, TV
personality, writer, singer 41% 59% (37) 69% 31% 0% (16) 60% 40% (5) 50% 50% 0% (58)
Sportsperson, athlete,
player, coach, referee 12% 88% (172) 23% 77% 0% (69) 13% 87% (15) 15% 85% 0% (256)
Student, pupil, schoolchild 79% 21% (14) 20% 80% 0% (5) 0% 0% (0) 63% 37% 0% (19)
Homemaker, parent 80% 20% (51) 65% 35% 0% (20) 67% 33% (3) 76% 24% 0% (74)
Child, young person 64% 36% (25) 46% 54% 0% (13) 0% 100% (1) 56% 44% 0% (39)
Villager or resident 32% 68% (25) 100% 0% 0% (1) 0% 0% (0) 35% 65% 0% (26)
Retired person, pensioner 75% 25% (4) 0% 0% 0% (0) 0% 0% (0) 75% 25% 0% (4)
Criminal, suspect 52% 48% (23) 0% 100% 0% (2) 0% 100% (2) 44% 56% 0% (27)
Unemployed 0% 100% (2) 0% 100% 0% (1) 0% 0% (0) 0% 100% 0% (3)
Other 67% 33% (3) 0% 0% 0% (0) 0% 0% (0) 67% 33% 0% (3)
Not stated 43% 57% (89) 61% 33% 6% (36) 71% 29% (7) 49% 49% 2% (132)
Overall 32% 68% (1176) 33% 66%as if they add to less than 100% due to all figures except for
JOURNALISTS AND REPORTERS

Female journalists outnumbered males in the 2020 GMMP sample of Australian news
stories, with females comprising 56 per cent of all reporters and presenters compared to
males comprising 44 per cent. Females achieved the majority due to the large number of
female news anchors who presented television stories (see Figure 7). However, when the
figures were broken down by reporters compared to presenters, male reporters formed a
slight majority, 51 per cent being male compared 49 per being female (see Figure 8).

Figure 7. Gender of Reporters and Presenters in Different Types of News Media
 Gender    Newspaper         Radio        Television       Internet       Twitter       All Media
            (N = 149)       (N = 76)       (N = 263)      (N = 112)      (N = 88)       (N= 688)
             (22% of        (11% of         (38% of        (16% of       (13% of        (100% of
             sample)        sample)         sample)        sample)       sample)         sample)
 Female            44%            45%            65%            54%             56%            56%
 Male              56%            55%            35%            46%             44%            44%

The largest number of reporters/presenters in the overall sample were television journalists,
who made up 38 per cent of all reporters and presenters (see Figure 7). In television,
females formed a substantive majority, making up 65 per cent of reporters and presenters
combined. Female news anchors read introductions or voiceovers for 77 per cent of
television news stories, although females were not the majority of reporters for the medium,
as they represented only 43 per cent of television reporters.

Newspapers formed the second-largest group, with newspaper reporters forming 22 per cent
of the overall sample. Male reporters (56 per cent) outnumbered female reporters (44 per
cent) in newspapers.

In radio, there were more males than females overall (55 per cent male to 45 per cent
female). Almost all radio stories in the sample involved a newsreader reading a script and
only three stories had a packaged voice report by one of the station’s news reporters. All
three radio reporters were female (100%). When it came to stories read by the newsreaders,
there were far more stories presented by males than females (58 per cent male to 42 per
cent female). Radio stories made up the smallest percentage of stories in the sample due to
the short nature of radio bulletins. As a result, unlike the television figures, the radio figures
were not large enough to have a substantive influence on the gender balance of the overall
sample.

Figures for new media were similar to the ‘all media’ average. Females made up 56 per cent
of reporters and presenters of the sampled news Tweets and 54 per cent of the sampled
Internet news stories.

Figure 8. Gender of Reporters Compared to Broadcast Presenters
Reporters–All Media Radio Presenters      Radio Reporters       TV Presenters         TV Reporters
     (N=688)             (N=73)                (N=3)               (N=174)               (N=89)

  Female
  Male

                                               18
FOCUS ON COVID-19 NEWS
Almost one-third of news stories (32 per cent) had a COVID-19 connection in their content.
When considering the gender of who was quoted or discussed in the stories that had a
COVID-19 connection, 32 per cent of sources were female and 68 per cent male. This was
the same gender division as seen in figures for both COVID-related and non-COVID-related
stories combined (see Table below). There were no sources that identified as having a
gender other than male or female in COVID-related stories.
Figure 9. Sources in Stories Related to COVID-19
Sources in COVID- Sources in COVID-Related
Related Stories All Stories Stories in Whole
(N = 544) (N = 1706) Sample (N = 570)
COVID- Not COVID-
Female Male Other Female Male Other
Story Category Related Related
(N=165) (N=379) (N=0) (N=718) (N=986) (N=2)
% (N) % (N)
Politics and Government 31% 69% 0% 30% 70% 0% 61% (65) 39% (41)
Economy 21% 79% 0% 25% 75% 0% 45% (50) 55% (62)
Science and Health 21% 79% 0% 35% 65% 0% 41% (32) 59% (47)
Social and Legal 50% 50% 0% 45% 55% 0% 16% (11) 16% (58)
Crime and Violence 87% 13% 0% 34% 65% 1% 10% (7) 90% (60)
Gender & Related 75% 25% 0% 55% 45% 0% 17% (1) 83% (5)
Celebrity, Arts, Media & Sports 32% 68% 0% 26% 74% 0% 13% (14) 87% (97)
Other 25% 75% 0% 22% 78% 0% 5% (1) 95% (19)
Overall 32% 67% 0% 32% 68%Females were the main sources in stories about ‘Crime and Violence’ (87 per cent) and
‘Gender and Related’ (75 per cent) issues. The percentage of female sources in the ‘Crime
and Violence’ category were inflated by stories about three women accused of lying on their
border pass about travelling through an interstate COVID-hotspot, thus allowing them to
avoid quarantine. The trio gained national prominence when two of the group tested for
COVID-19, because their widespread movements in the eight days prior to detection might
have sparked a coronavirus cluster. The only story in the ‘Gender and Related’ category
discussed a United Nations report that found most nations were failing women and girls with
their COVID responses. Due to the small number of stories in the Crime and Violence’ (87
per cent) and ‘Gender and Related’ (75 per cent), the percentages should not be considered
statistically noteworthy.
20SUMMARY, CONCLUSIONS AND RECOMMENDATIONS
The findings of the 2020 GMMP study indicate that women and girls remain
underrepresented as sources of news in Australian journalism. Women and girls formed a
little more than half the population in 2020 at 50.4 per cent (ABS, 2021). Despite this, the
2020 GMMP research found that females made up less than one-third of people (32 per
cent) who were quoted or discussed in the sampled Australian news media stories. The
most glaring absence of females was in sport-related news, reflecting the historically heavy
diet of reporting about men’s sport in Australia’s news media. Economic and political
reporting are other priority areas where gender imbalance of sources need particular
attention.
The underrepresentation of women was particularly notable among the three types of
sources who were most frequently quoted or discussed in Australian news stories, which
were politicians, sportspeople, and businesspeople. Female sources achieved parity with
male sources as celebrities, artists, and actors. It is notable that celebrities, artists and
actors category, and this type of source is associated with stereotypical characteristics of
females, such as attractive appearance, communications skills, and similar attributes.
Women and girls predominated as sources in occupational categories traditionally seen as
‘female’, such as ‘homemaker or parent’ and ‘office or service worker/non-management
worker’, and pre- and post-career roles, such as ‘retired person or pensioner’ and ‘student,
pupil or schoolchild’ (63 per cent female, 37 per cent male). These categories of sources,
however, were not quoted frequently overall in the sampled news stories.
In terms of their role in stories, female sources appear in slightly higher percentages when
reporters seek someone to discuss their personal experience (discussing illness,
bereavement, or other things they have lived through), to express public opinion (such as
through vox pops), or to describe events as eyewitnesses. Notably, they appear in lower
percentages than male sources – they are simply less overlooked as sources in these
categories than in other categories. Percentages of female appearances compared to males
are lowest in roles that discuss or draw insight from an individual’s expertise or actions, such
as being an expert/commentator, an institutional spokesperson, or the subject of the news
report.
Continued work is needed across media, political, education and other social institutions to
explore ways to ensure that the balance of sources appearing in news media reflects the
contributions of all genders. Some attempts have been established to help journalists find
high-quality female and other diverse sources to profile or interview. The Women for Media
database (https://womenformedia.com.au/) and the Media Diversity Australia Find an Expert
Database (https://www.mediadiversityaustralia.org/find-an-expert/) represent positive
starting points that could be scaled up if provided with appropriate support. Government,
business, and community organisations, particularly those that have corporate
communications units, can assist by committing themselves to train their female employees
and emerging organizational leaders in how to communicate with the news media. When
such organisations are contacted by journalists, they can recommend females with
appropriate expertise. For news media organisations, staff training and auditing of their
reportage to check for diversity and initiatives to build awareness of opportunities for
expanding source networks would encourage journalists to make greater use of female
expertise in business, economics, politics, sports, and other areas of society.
Women appear on the surface to have achieved parity in newsrooms in terms of numbers of
females who are bylined as reporters or who present the news as broadcast anchors. The
study indicated that female to male bylines and appearances as reporters were
approximately equal (49 per cent female to 51 per cent male), with male presenters more
21dominant in radio and female presenters more prevalent in television in the sample that was
taken. It seems encouraging that for the first time since the GMMP commenced in 1995,
women have achieved parity as reporters and presenters of the sampled Australian news
stories. The percentages of female journalists are still low, however, if account is taken of
the fact that women have formed the vast majority of students in Australian journalism
degrees and other post-school study programs since the 1980s.
Given that most newsrooms predominantly hire university graduates from journalism
degrees and a mix of other degrees as entry-level journalism jobs, research is needed into
why women’s workforce participation does not reflect the gender balance among the pool of
graduates. Research on entry-level employment in news media organisations could also
help to determine whether hiring practices may be affecting the gender balance among
successful applicants and if so, how this might be addressed. Once a journalist has
commenced work in the news industry, the length of journalists’ careers, the types of stories
they choose or are assigned to work on, and their promotions to senior and management
positions can be affected by a range of gender-related factors. Parental responsibilities, for
example, have a noteworthy factor that influences career trajectories. The Women in Media
group, founded by the journalism union-cum-professional association, the Media,
Entertainment and Arts Alliance, offers mentoring, awards, networking events, training and
other support for the confidence and capacity of female journalists. Amid changes wrought
by technological change, economic disruption and, more recently, the COVID-19 pandemic,
it remains important for media organisations and other stakeholders to review and reimagine
ways for women to sustain careers and opportunities for advancement in journalism. Given
the current financial instability of the news media industry, a focus is needed on industry-
wide support to ensure equitable opportunities.
22REFERENCES
Australian Bureau of Statistics (ABS) (2021). National, State and Territory Population, Dec
2020. Available at https://www.abs.gov.au/statistics/people/population/national-state-
and-territory-population/dec-2020/310104.xls. Accessed 12 July 2021.
Australian Bureau of Statistics (ABS) (2020). Gender Indicators, Australia: 2020. Canberra,
ACT: ABS. Available at https://www.abs.gov.au/statistics/people/people-and-
communities/gender-indicators-australia/2020. Accessed 12 July 2021.
Australian Human Rights Commission (AHRC) (2017). Violence against Women in Australia.
Sydney, NSW: AHRC. Available at https://humanrights.gov.au/our-
work/legal/submission/violence-against-women-australia-2017. Accessed 12 July 2021.
Australian Human Rights Commission (AHRC) (2020). Respect@Work: National Inquiry into
Sexual Harassment in Australian Workplaces. Sydney, NSW: AHRC. Available at
https://humanrights.gov.au/sites/default/files/document/publication/ahrc_wsh_report_202
0.pdf Accessed 12 July 2021.
Bacon, W., & Dalley, E. (2013). Where are the women in the media? New Matilda, March 8.
Available at https://newmatilda.com/2013/03/08/where-are-women-media/ Accessed 12
July 2021.
Gallagher, M. (2005). Who Makes the News? Global Media Monitoring Project 2005.
London, UK: World Association for Christian Communication. Available at
https://mediamonitoringafrica.org/images/uploads/gmmp-report-en-2005_small.pdf
Accessed 12 July 2021.
Macharia, L. (2015). Who Makes the News? Global Media Monitoring Project 2015. London,
UK, and Toronto, ON: World Association for Christian Communication.
https://whomakesthenews.org/wp-content/uploads/who-makes-the-
news/Imported/reports_2015/global/gmmp_global_report_en.pdf Accessed 12 July
2021.
MediaWatch. (1995). Global Media Monitoring Project: Women's Participation in the News.
Toronto, ON: National Watch on Images of Women in the Media (MediaWatch).
North, L. (2016). Still a ‘blokes club’: The motherhood dilemma in journalism. Journalism,
17(3), 315-330.
Price, J., & Payne, A.M. (2019). Women for Media Report: ‘You Can’t Be What You Can’t
See’. NP: Women’s Leadership Institute Australia. Available at
https://apo.org.au/sites/default/files/resource-files/2019-04/apo-nid228846.pdf Accessed
12 July 2021.
Romano, A. & De Ponte, M. (2002). ‘Changing representations of women: The Courier-Mail
over four decades’, Australian Journalism Review, 24(2), 2002, pp. 151-170.
23Annex 1. Methodology1
A key characteristic of longitudinal research is the assessment of change over time on the
observed indicators. In the case of the 2020 Global Media Monitoring Project (GMMP), the
methodology, indicators, approach to data collection and analysis are consistent with past
editions of the research in order to allow for the usual historical comparisons.
Process
The global monitoring day scheduled initially for the first quarter of 2020 was postponed to
later in the year due to the upheavals caused by the first coronavirus (Covid-19) wave
worldwide. As the April monitoring day approached, it became quickly clear that proceeding
as planned would result in a news sample that would be almost entirely focused on
coronavirus stories. A new need emerged to address the practicalities of monitoring during
the lockdowns and curfews imposed to contain the spread of the virus, as the regular sit-
down communal coding sessions were now out of the question for most teams. The risks to
health and livelihoods, the need to find ways of coping with everyday life, would shift the
GMMP down on the ladder of priorities for the volunteers, potentially increasing the drop-out
rate. These new challenges called for a pause on the plans to search for solutions and put in
place the tools and resources necessary before monitoring could proceed.
The GMMP technical advisory group and the database development team Code for Africa
worked to systematically address the issues. A new monitoring date was set for September,
the coding tools were tweaked to capture Covid-19 stories without compromising on the
ability to compare results across time based on story topics, exhaustive audio-visual training
resources on how to code in a pandemic were put in place, electronic coding instruments
were developed, and the teams were re-trained in numerous webinars.
As with previous waves of the GMMP, the initial data capture was conducted offline by
volunteer teams across the 116 participating countries. For the 2020 GMMP, a spreadsheet
version of the coding sheets was provided, to allow for electronic recording of the
observations.
In the period leading up to the monitoring day, a series of regional and national training
sessions were organised to build a uniform understanding of the teams on the methodology
and approach to coding. The teams received training on media selection, newscast and
article selection, and the number of media to code.
For the 2020 GMMP, teams could choose from two possible options for the monitoring:
• Full monitoring, whose results provide a comprehensive picture of the status of
gender equality dimensions in news media.
• Short monitoring, a shorter version which focuses on the key GMMP indicators, for
teams who wished to participate but for various reasons could not implement the full
monitoring.
To ensure accuracy in the coding process, radio and television bulletin were recorded, and
copies of digital and print media items were collected. Across the different media types- both
for the full and short monitoring-monitors captured information about the story, its main
themes, and the people in the story, as journalists, as story subjects and sources.
1
See the global report for the extended discussion on the GMMP 2020 methodology
24Additionally, three optional special questions, unique to each country, allowed individual
countries to analyse issues of national interest. For standardisation purposes, as well as the
multilingual nature of this study, all responses were numerically coded from fixed lists.
To enable comparability of data gathered from a pandemic-heavy news agenda with the
historical results, an additional question was included which asked whether the story was
related to Covid-19. For such stories, monitors were requested to select the most relevant
secondary topic. While global news stories had diversified to pre-pandemic levels by the
global monitoring day in September 2020, the regional analysis demonstrated the
significance of this question, particularly for North America and the Middle East, which
recorded 37% and 36% of Covid-19-related stories respectively.
Media bands
The media bands system was introduced in 2005 to ensure a more even spread of data and
also serve as each country’s reference point on the minimum number of media to monitor.
This system was retained for the 2020 GMMP and was updated with the input of the country
coordinators.
Weighting
While the GMMP seeks to understand how gender is represented in media across the world,
differences in media access and impact across the participating countries mean that a
simple aggregation of the data would lead to biased results. For example, if a country like
France submitted data from 100 media, the entries from a smaller country like Fiji would
have little, if any, impact on the results. Additionally, while two countries may have similar
numbers of newspapers, their impact, in terms of the number of people who read them, may
be significantly different. To address these challenges, GMMP 2020 updated, re-tested and
applied the weighting system first developed for the 2005 edition.
Accuracy
The GMMP involved several thousand people across 116 countries from diverse gender and
media stakeholder groups, with different research abilities and working in a wide range of
languages. For a study of this scale, it was crucial that accuracy was considered at each
stage, to maintain the high levels achieved in previous years. Data entry and processing
errors can have severe biasing effects on the data analysis, resulting in misrepresentation of
the observed variables. To minimise this risk, we leveraged on a variety of automated
processes, as well as the extensive media monitoring experience of the country
coordinators.
Limitations
As with any study, great effort was made to ensure accuracy of the data. As observed in
previous GMMPs, an exact error of measurement cannot be determined due to the study’s
magnitude. Conventional error measurement would involve different researchers coding the
same story and then calculating a level of error from the differences between the results.
Although this was not possible for GMMP, we followed best practice to make sure that there
were minimal errors in the data capture and analysis generation process.
About Code for Africa
Code for Africa (CfA) is the continent’s largest network of indigenous African civic
technology and investigative data journalism laboratories, with over 70 staff in 19 countries,
who build digital democracy solutions that are intended to give citizens unfettered access to
actionable information that empowers them to make informed decisions and that strengthen
civic engagement for improved public governance and accountability.
25Annex 2. List of Monitors and Data Coders
Country report author
Angela Romano
Collectors of Sample Newspapers
Kathryn Bowd
Karen Marchant
Angela Romano
Alice Steiner
Alex Wake
Collectors of Radio Bulletins
Elizabeth Aboud
Shanelle Adams
Paul (Campo) Campion
Hannah Davies
Nicole Keramos
Holly Payne
Isabella Pol Bodetto
Collectors of Television Bulletins
Angela Romano
Alice Steiner
Collectors of Internet and Twitter Stories
Charlotte Flew
Angela Romano
Newspaper Data Coders
Elizabeth Aboud
Shanelle Adams
Hannah Davies
Charlotte Flew
Nicole Keramos
Holly Payne
Isabella Pol Bodetto
Angela Romano
Matthew Tsimpikas
Television Data Coders
Erin Godwin
Angela Romano
Radio Data Coders
Hannah Davies
Charlotte Flew
Angela Romano
Matt Tsimpikas
Internet and Twitter Coders
Charlotte Flew
Angela Romano
26WACC Assoc Prof Angela Romano
308 Main Street School of Communication
Toronto Queensland University of Technology
ON M4C 4X7 Victoria Park Rd
Canada Kelvin Grove, QLD 4059
Australia
Tel: +61 7 3138 4000
Tel: +1 416 691 1999
a.romano@qut.edu.au
gmmp@waccglobal.org
www.qut.edu.au
www.whomakesthenews.org
@qut
@whomakesthenews
27You can also read