2020 Climate and Weather: The Year in Review - Rain Areas
←
→
Page content transcription
If your browser does not render page correctly, please read the page content below
2020 Climate and Weather: The Year in Review
The year 2020 saw the end of the record number of consecutive months of warmer-than-average
mean temperatures in Singapore. This record began in February 2018 and continued into the first
five months of 2020, resulting in a record 28 warmer-than-average months in a row. In June 2020
the trend ended with unseasonably wet conditions contributing to cooler-than-average
temperatures over the island. Despite these cooler temperatures, the annual mean temperature
in 2020 was 28.0°C, 0.5°C above the long-term average of 27.5°C.

Four of the past six years are amongst the top 10 warmest years on record with respect to the
annual mean temperature, since Singapore temperature records began in 1929. This includes
2020 which ranks as eighth warmest. The other three warm years include 2019 and 2016 (joint
warmest years on record at 28.4°C) and 2015 (joint fourth warmest with 1997 at 28.2°C1).

The mean temperature for the last 10 years from 2011 to 2020 was 27.94°C, and ranks as the
second warmest decade, marginally less than the previous warmest decade from 2010 to 2019
(27.95°C1).

Figure 1: Singapore monthly mean temperature for 30-year average from Changi climate station (bars,
1981 – 2010) compared to 2020 (solid line). Also shown are the highest recorded monthly values for the
historical period prior to 2020 as ‘dots’. No long-term monthly temperature records were broken in 2020.

1
    Small deviation from TYR 2019 due to improved method for calculating annual average temperature.

                         The Year in Review - 2020 (Published on 19 January 2021)                      1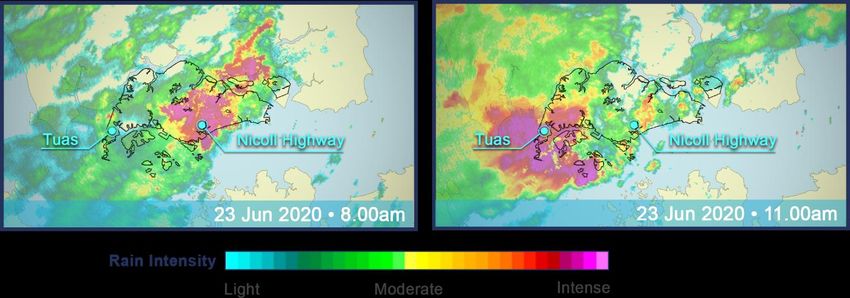
Considering the individual months (Figure 1), the monthly mean temperatures remained above
their respective monthly average for the first five months, peaking in May 2020 at 28.9°C. In June
2020, the monthly mean average temperature was 28.1°C, 0.2°C below the long-term average
and the second coolest June in the past 20 years. Similar slightly cooler-than-average mean
temperature conditions occurred again in September 2020, with a monthly average temperature
of 27.5°C, joint with September 2013 as the coolest Septembers in the last 10 years (0.1° below
the long-term average). October marked a return to warmer-than-average temperature, recording
28.3°C, 0.7°C above the long-term average. No long-term monthly temperature records were
broken in 2020.

For rainfall, the 2020 annual total rainfall was near average over most of the islandwide rainfall
stations. However, at the Changi climate station (Figure 2), the annual total rainfall recorded was
1886.6 mm, which was 12.9% below the long-term annual average of 2165.9 mm. This year’s
annual rainfall ranks eighth lowest over the past 30 years.

Figure 2: Singapore monthly total rainfall for 30-year average from Changi climate station (bars, 1981 –
2010) compared to 2020 (solid line). The annual total rainfall of 1886.6 mm for 2020 was 12.3% below the
long-term annual average of 2150.1 mm.

The driest period in 2020 was between January to March (Figure 3). Islandwide, the January to
March monthly rainfall was more than 30% below average in each of these three months.

In contrast, the 2020 Southwest Monsoon season was wetter-than-average. The Southwest
Monsoon season (June – September) is typically the drier period of the year, however the two
highest islandwide average monthly rainfall totals of 310.1mm and 302.4mm occurred in June

                     The Year in Review - 2020 (Published on 19 January 2021)                      2
and September 2020. These values were 99% and 63% above their respective long-term monthly
averages. For the whole Southwest Monsoon season, islandwide total rainfall was 30% above
the long-term average for June – September 2020. This was the third wettest June – September
since 1981, islandwide.

Figure 3: Singapore monthly rainfall anomaly for 2020 averaged over 28 stations islandwide. Rainfall was
significantly below-average in first few months of the year during the Northeast Monsoon and above-
average for the Southwest Monsoon season (June – September 2020).

There were more frequent intense heavy rainfall events over the island in 2020. Based on the
rainfall stations with long-term records, there were six days of very heavy rainfall in 2020 where
the hourly rainfall total exceeded 70mm. This hourly rainfall value represents the top one per cent
of all heavy rainfall events recorded in Singapore (in the climatological reference period 1981-
2010). These rainfall events led to flash floods at various locations across Singapore. The hourly
rainfall total of 106.0mm recorded in August 2020 at Bedok South was the highest in 2020. As a
reference, the highest ever hourly rainfall total of 130.7mm was recorded at Ulu Pandan in July
2007.

The number of days with very heavy rainfall in 2020 is the highest recorded since 2013, as shown
in the table below.

                 Year       2013    2014    2015    2016    2017     2018    2019    2020

             No. of days     9        3       2       5       2       3         1      6

Table 1: Annual number of days with very high rainfall events (hourly rainfall total >= 70mm) since 2013
recorded at rainfall stations with long-term records.

                     The Year in Review - 2020 (Published on 19 January 2021)                      3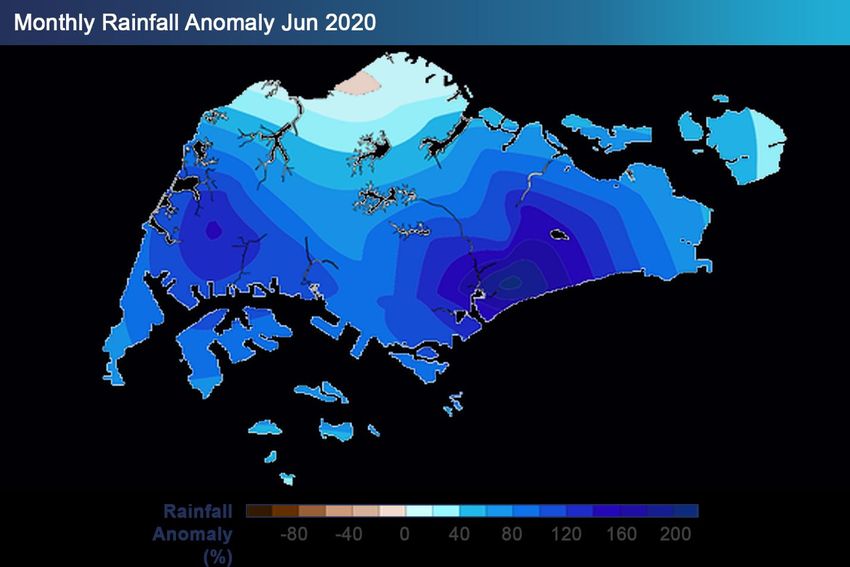
La Nina conditions developed in the third quarter of 2020 and continued to strengthen during the
rest of the year. Based on historical observations, La Niña events tend to have a stronger effect
on Singapore’s rainfall during the Southwest Monsoon season, where they bring wetter-than-
average conditions.

The strong positive Indian Ocean Dipole (IOD) present in the second half of 2019, quickly returned
to neutral at the start of 2020. No further significant IOD events developed in 2020.

Weather Extremes in 2020

                                                                        Since 1869 (rainfall),
                                          2020
                                                                   1929 (temperature), 1984 (wind)
                            All Available          Changi
                                                                  Climate Station (Changi) Records
                              Stations*        Climate Station
                                  36.3
 Hottest Day                                        34.6                         36.0
                              13 March
 (°C)                                               2 Apr                    26 Mar 1998
                             Paya Lebar
                                  20.9
 Coldest Night                                      21.9                         19.4
                            16 September
 (°C)                                              16 Sep                  30 - 31 Jan 1934
                               Newton
                                  29.6
 Warmest Month                                       28.9                         29.5
                                 April
 (°C)                                                May                        Mar 1998
                             Paya Lebar
                                  26.2
 Coolest Month                                       27.2                         24.2
                                  July
 (°C)                                                Nov                        Jan 1934
                                Khatib
                                 185.2
 Wettest Day                                         64.2                       512.4
                             29 January
 (mm)                                               4 Nov                    2 Dec 1978
                            Jurong Island
                                 497.8
 Wettest Month                                      255.6                         818.6
                                 June
 (mm)                                                May                        Jan 1893
                                 Tuas
                                   8.2
 Driest Month                    March                65                          0.2
 (mm)                        East Coast              Feb                        Feb 2014
                              Parkway
                                 101.5
 Strongest Wind Gust           3 March               57.4                        90.7
 (km/h)                    Chua Chu Kang             Sep                     29 Nov 2010
                                (south)

Table 2: Temperature, rainfall and wind extremes recorded at Changi climate station in 2020 compared to
the historical record; additional information from all available stations provides further context.

                     The Year in Review - 2020 (Published on 19 January 2021)                     4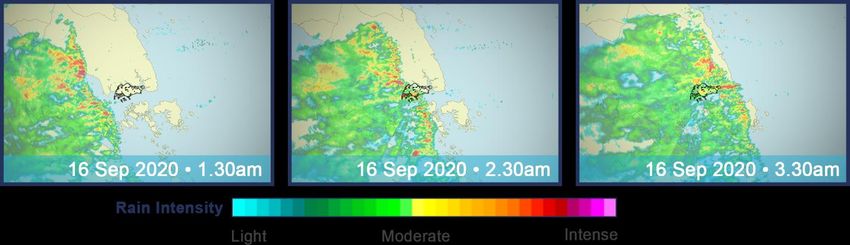
Notable Weather Events in 2020
Remarkable June
June 2020 was a remarkable month, weather-wise. At the Changi climate station, the total rainfall
in June 2020 was 233.8mm which ranks June 2020 as the wettest June in the last 10 years,
surpassing June 2011 by 20.8mm.
Figure 4: Rainfall anomaly map for June 2020
There were 21 rain days at the Changi climate station in June 2020, the highest in the last 30
years and surpassing the previous high of 19 rain days in June 2010.
The wet weather in June 2020 was mostly due to strong solar heating of land areas, at times
coupled with large-scale convergence of winds in the surrounding region, and to the passage of
Sumatra squalls on some days. The heavy thundery showers on several days particularly on 23
June 2020 brought intense rainfall and contributed to flash floods at various locations in the island.
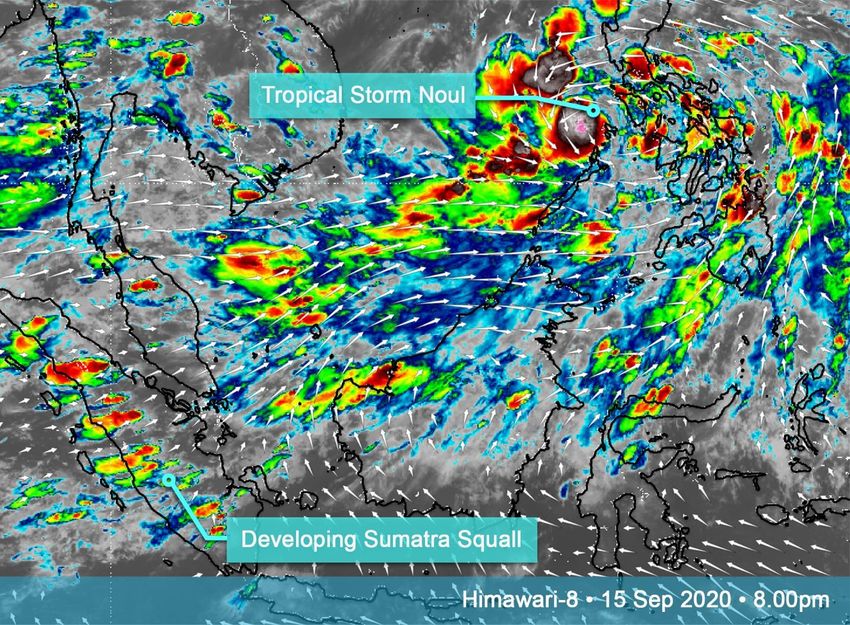
In the morning of 23 June 2020, a Sumatra squall from the Strait of Malacca moved over
Singapore bringing two spells of widespread, heavy thundery showers in the morning (Figure 5).
The highest hourly total rainfall in the first spell was 67.2mm recorded at Nicoll Highway. The
The Year in Review - 2020 (Published on 19 January 2021) 5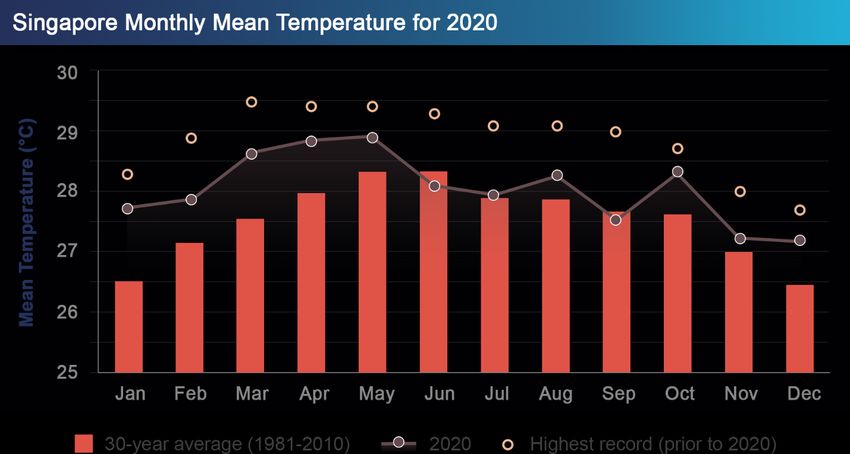
second spell of intense thundery showers fell mainly over the western part of the island, and the
highest hourly total rainfall of 65.8mm (10am-11am) was recorded at Tuas. Flash floods were
reported that morning in Jurong, Bedok and Changi.

Figure 5: Weather radar images of the squall that moved over the island in the early morning (left) and
again in the late morning (right) on 23 June 2020.

Although there were some warm days in June 2020, the high number of rain days during the
month brought cooler conditions across the island. At the Changi climate station, for instance, the
temperature remained below 30°C for five consecutive days between 20 and 24 June 2020.

Coolest Day

A generally wet Southwest Monsoon season in 2020 brought cooler temperatures over Singapore
on some days, particularly in September 2020. The lowest daily minimum temperature in 2020
was 20.9°C, recorded on 16 September 2020 at Newton, the coolest day in the year. Overall,
September was one of only two months in 2020 with below average temperature.

The cool weather on 16 September 2020 was due to a Sumatra squall that developed under the
indirect influence of Tropical Storm ‘Noul’ over the South China Sea (Figure 6). The squall brought
widespread and intense thundery showers over Singapore for a few hours from midnight followed
by light to moderate rain (Figure 7). This further cooled the air with the temperature falling to
slightly below 21°C between 3.30am and 4am that morning.

                      The Year in Review - 2020 (Published on 19 January 2021)                       6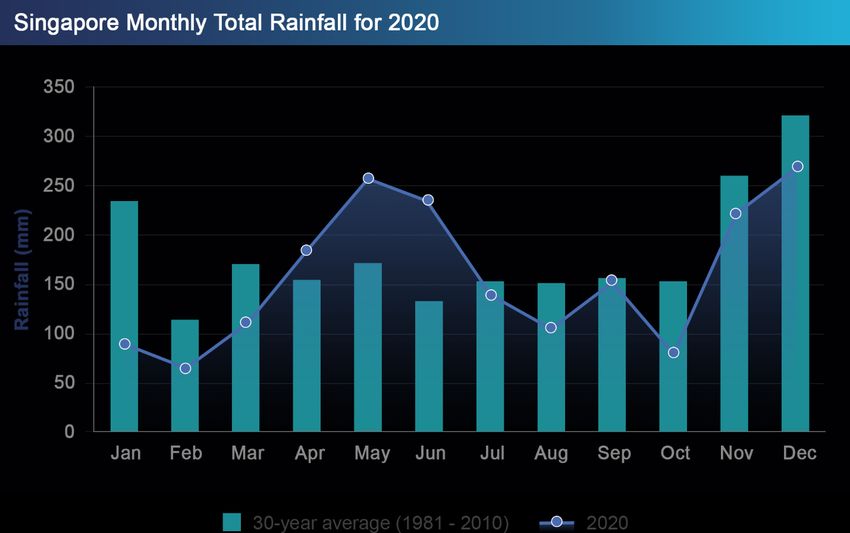
Figure 6: Himawari-8 satellite image at 8pm on 15 September 2020, shows a developing Sumatra squall
over central Sumatra under the influence of Tropical Storm ‘Noul’ brewing over the South China Sea.

Figure 7: Series of weather radar images of a well-organized Sumatra squall on 16 September 2020.
Widespread and intense thundery showers fell over Singapore between midnight and 3am followed by light
rain that cleared within the next hour.

                     The Year in Review - 2020 (Published on 19 January 2021)                    7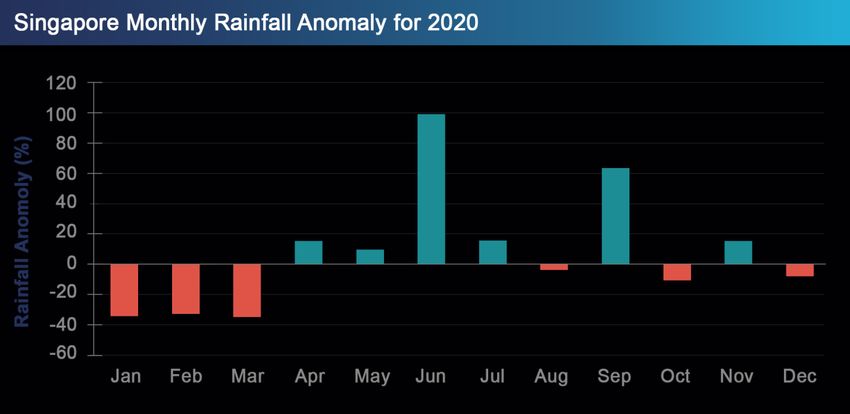
High occurrence of Sumatra squalls in October
14 Sumatra squalls passed over Singapore in October 2020, the highest number for October
since 2010. Sumatra squalls are organised line of thunderstorms that bring strong gusty winds
and heavy rain. On average, Singapore experiences 45 squalls per year, with most occurring
between April and November. In 2020, about 50 Sumatra squalls crossed over Singapore.

The high frequency of Sumatra squalls in October 2020 can be partly attributed to the presence
of several tropical cyclones over the South China Sea and western Pacific Ocean. These cyclones
altered the wind flow over equatorial Southeast Asia, bringing favourable conditions for the
development and eastward passage of the Sumatra squalls (Figure 8).

Figure 8: Average low-level wind field (October 2020) blowing from the southwest or west over Singapore
and the surrounding region, and low- pressure system over the northern part of the South China Sea.
(Source: JMA TCC ITACS platform).

                                             === END ===

                     The Year in Review - 2020 (Published on 19 January 2021)                     8
You can also read