RESULTS PRESENTATION FOR
  THE 6 MONTHS ENDED
   30 SEPTEMBER 2014
←
→
Page content transcription
If your browser does not render page correctly, please read the page content below
RESULTS PRESENTATION FOR THE 6 MONTHS ENDED 30 SEPTEMBER 2014
Disclaimer
  This presentation may contain certain statements and projections provided by or on behalf of SmartPay Group (SmartPay) with respect to
  anticipated future undertakings. Any forward looking statements reflect various assumptions by or on behalf of SmartPay. Accordingly,
  these statements are subject to significant business, economic and competitive uncertainties and contingencies associated with the
  business of SmartPay which may be beyond the control of SmartPay which could cause actual results or trends to differ materially,
  including but not limited to competition, industry downturns, inability to enforce contractual and other arrangements, legislative and
  regulatory changes, sovereign and political risks, ability to meet funding requirements, dependence on key personnel and other market
  and economic factors. Accordingly, there can be no assurance that any such statements and projections will be realised. SmartPay makes
  no representations as to the accuracy or completeness of any such statement of projections or that any projections will be achieved and
  there can be no assurance that any projections are attainable or will be realised.

  Additionally, SmartPay makes no representation or warranty, express or implied, in relation to, and no responsibility or liability (whether
  for negligence, under statute or otherwise) is or will be accepted by SmartPay or by any of their respective officers, directors, shareholders,
  partners, employees, or advisers (Relevant Parties) as to or in relation to the accuracy or completeness of the information, statements,
  opinions or matters (express or implied) arising out of, contained in or derived from this presentation or any omission from this
  presentation or of any other written or oral information or opinions provided now or in the future to any interested party or its advisers. In
  furnishing this presentation, SmartPay undertakes no obligation to provide any additional or updated information whether as a result of
  new information, future events or results or otherwise.

  Except to the extent prohibited by law, the Relevant Parties disclaim all liability that may otherwise arise due to any of this
  information being inaccurate or incomplete. By obtaining this document, the recipient releases the Relevant Parties from liability to the
  recipient for any loss or damage which any of them may suffer or incur arising directly or indirectly out of or in connection with any use of
  or reliance on any of this information, whether such liability arises in contract, tort (including negligence) or otherwise.

  This document does not constitute, and should not be construed as, either an offer to sell or a solicitation of an offer to buy or sell
  securities. It does not include all available information and should not be used in isolation as a basis to invest in SmartPay.

Page 1
Agenda

    1    Half Year Financial Highlights

    2    Results Table for the Half Year

    3    Results Commentary

    4    Review of Operations

    5    Summary and Outlook

Page 2
Half Year Financial Highlights

     1   Half Year Financial Highlights

    2    Results Table for the Half Year

    3    Results Commentary

    4    Review of Operations

    5    Summary and Outlook

Page 3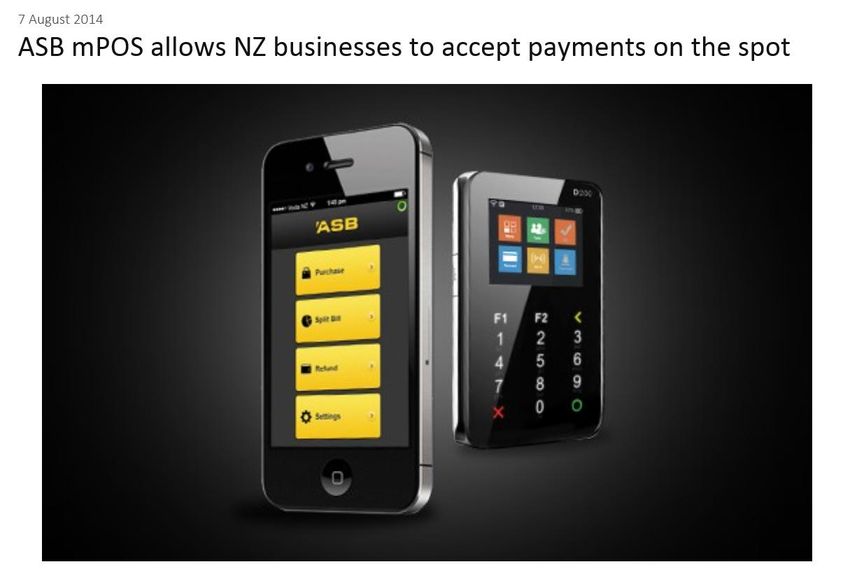
Full Year Financial Highlights

   • Revenue of $11.8m, up 4% on the previous period of $11.3m

   • EBITDA* of $4.8m, up 2% on the previous period of $4.7m (previous

         period normalised for reported non-recurring items)

   • Net Profit After Tax of $1.5m, up 70% on previous period of $0.9m

   • Diluted EPS of 0.87 cents, up 71% on prior year of 0.51 cents

   *EBITDA = Earnings Before Interest, Tax, Depreciation, Amortisation (including share option amortisation),
              impairments and foreign exchange adjustments.

Page 4
Results Table for the Half Year

    1    Half Year Financial Highlights

     2   Results Table for the Half Year

    3    Results Commentary

    4    Review of Operations

    5    Summary and Outlook

Page 5
Results Table for the Half Year
                                                                                             Group
                                                                           30 Sept 2014              30 Sept 2013

                                                                            Unaudited                 Unaudited
         Continuing operations                                                             $’000                     $’000
         Revenue                                                                          11,770                    11,308
         Other income                                                                          2                         -

         Operating expenditure                                                            (6,968)                   (6,362)
         Earnings before interest, tax, depreciation, share option
         expense, amortisation, impairments, and unrealised foreign                        4,804                     4,946
         exchange

         Depreciation and amortisation
                                                                                          (2,223)                   (1,926)
         Unrealised foreign currency exchange differences
                                                                                             261                     (720)
         Share option amortisation
                                                                                             (58)                    (196)
         Net finance (costs) / income
                                                                                          (1,043)                    (951)
         Impairments
                                                                                           (301)                     (263)

                                                                                          (3,364)                   (4,056)

         Profit before tax                                                                 1,440                       890

         Tax expense                                                                          59                        (6)
         Profit for the period from continuing operations of owners                        1,499                       884

         Other comprehensive income
         Foreign currency translation differences for foreign operations                   (147)                       331

         Total comprehensive income of owners                                              1,352                     1,215

         Earnings per share from continuing operations
         Basic earnings/(loss) per share - cents                                    0.87 cents                0.51 cents
         Diluted earnings/(loss) per share -cents                                   0.87 cents                0.51 cents

Page 6
Results Commentary

    1    Half Year Financial Highlights

    2    Results Table for the Half Year

     3   Results Commentary

    4    Review of Operations

    5    Summary and Outlook

Page 7
Results Commentary
   • Revenue increase on the prior period mainly attributed to:
      – Revenues from the EPAY deal announced earlier in the year
      – SME growth in Australia
      – Completion of a long term payments software development project for
        an Australian state government transport authority

   • EBITDA* of $4.8m is up on the previous period normalised result of $4.7m
     (adjusted for previously reported non-recurring items).

   • The lower growth rate of EBITDA* relative to turnover reflects the
     investment in additional capacity, mainly staff costs, in both Australia and
     New Zealand to support current and future growth.

   • Net Profit increase mainly attributed to the positive impact of unrealised
     foreign currency exchange differences (AUD strengthening) and lower share
     option amortisation.
   *EBITDA = Earnings Before Interest, Tax, Depreciation, Amortisation (including share option amortisation),
       impairments and foreign exchange adjustments.
Page 8
Review of Operations

    1    Half Year Financial Highlights

    2    Results Table for the Half Year

    3    Results Commentary

     4   Review of Operations

    5    Summary and Outlook

Page 9
Review of Operations
• The company made good progress in all aspects of the business in the
first half. Notable achievements in our New Zealand business during
the period include:
A number of new distribution deals for our new mobile integrated
payments terminals (including our mPos solution for ASB Bank)
The conclusion of the Epay deal announced in July this year
The recent launch of an integrated mobile taxi booking and
payment app for our New Zealand taxi partners
• In Australia we delivered a significant Australian state government
transport authority software payments project and continue to build
our SME terminal base.
Page 10Review of Operations
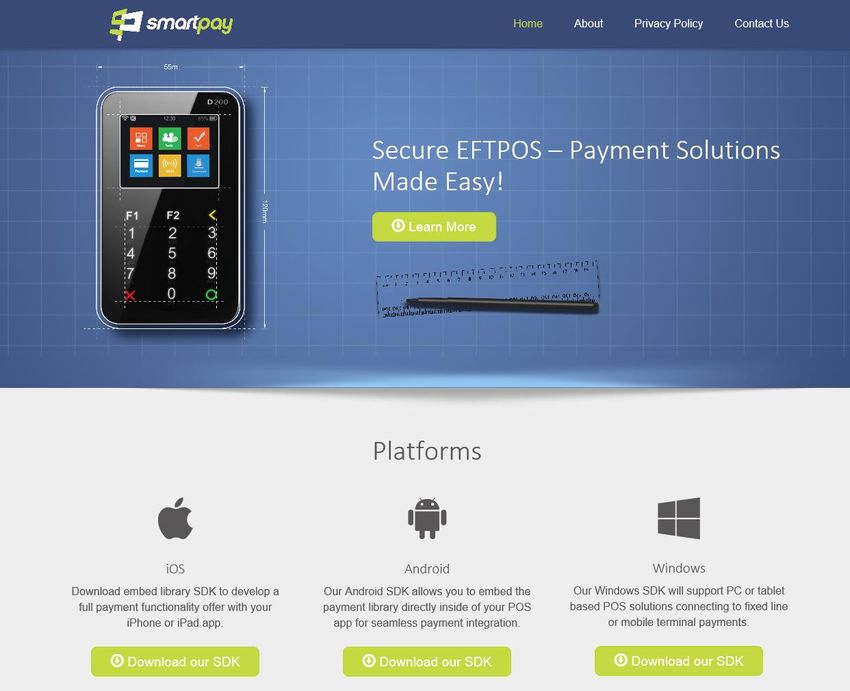
New Products - Mobility Solutions
Developer Programme
Interoperability integration available through
Smartlink – Smartpay’s Secure API
11Review of Operations
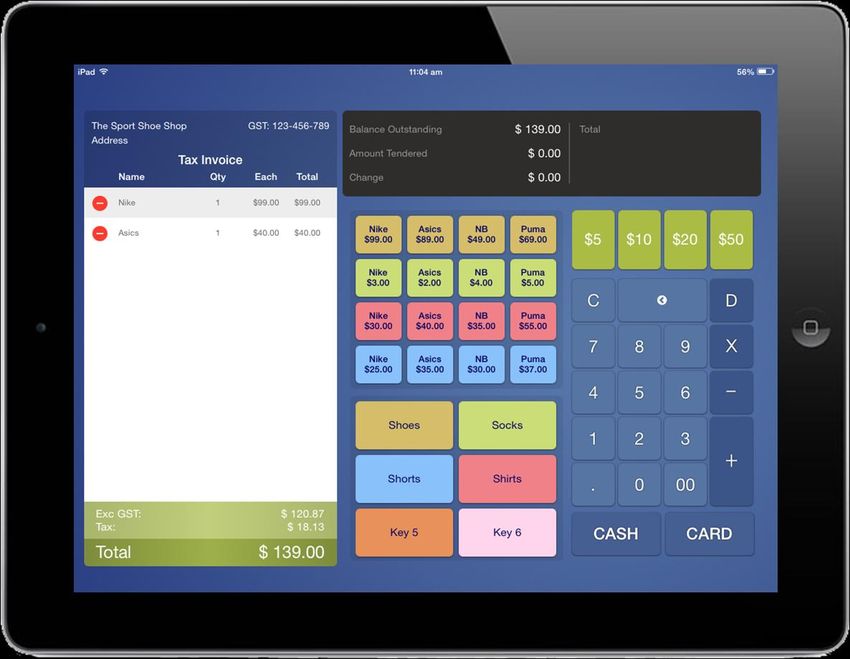
New Products - Mobility Solutions
Till2Go
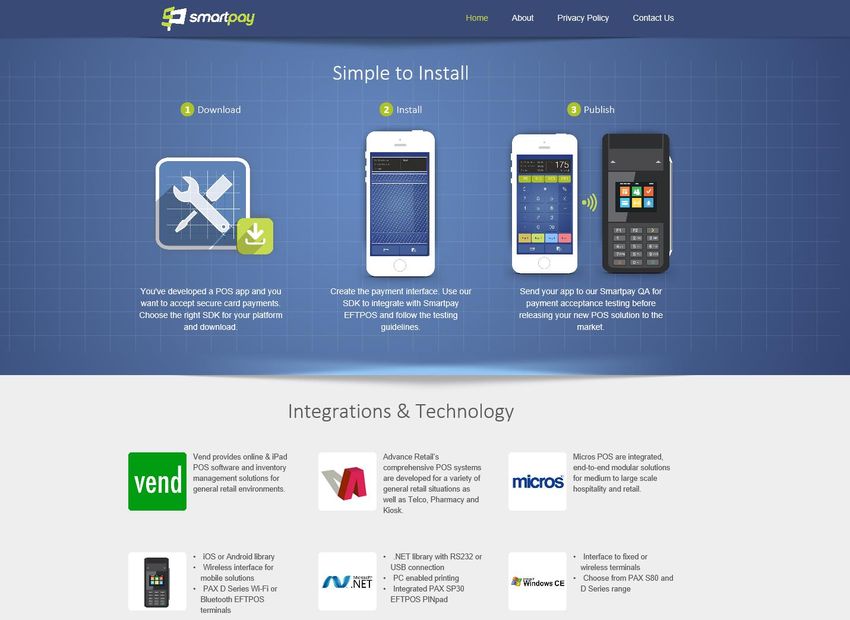
Page 12Review of Operations Developer Programme – Live: www.smartpaydev.com Page 13
Review of Operations
Developer Programme – Live:   www.smartpaydev.com

Page 14
Review of Operations
Smartpay Provides mPOS Payments Solution to ASB

Page 15
Review of Operations
Smartpay Selected As Epay Preferred Terminal Partner

Page 16
Review of Operations
Smartpay Launches Mobile Taxi Booking App

Page 17
Summary and Outlook

    1     Half Year Financial Highlights

    2     Results Table for the Half Year

    3     Results Commentary

    4     Review of Operations

     5    Summary and Outlook

Page 18
Summary and Outlook
Targets for Next 6 Months
1. Continue the growth in our Australian SME business
2. Launch Australian Taxi Business
3. Certify mobile / wireless integrated terminals in Australia and
launch Australian corporate business
4. Secure at least one additional bank / acquiring relationship
5. Further growth of mobile integrated products into NZ
Page 19Questions
Questions.
Page 20You can also read