2020 November - Driving Health Study - Transport Workers' Union NSW
←
→
Page content transcription
If your browser does not render page correctly, please read the page content below
Driving Health Study

Survey of the physical and mental
health of Australian professional drivers

November
2020
This research report was prepared by Dr Caryn van Vreden, Dr Ting Xia, Dr
Ross Iles, Dr Elizabeth Pritchard, Dr Sharon Newnam, Professor Shanthakumar
Rajaratnam, Professor Dan Lubman, Dr de Almeida Neto and Professor Alex
Collie from Monash University.

For further information relating to this report or the Driving Health Study please
contact the research team via the email address: info@drivinghealth.net

This report should be cited as: van Vreden C, Xia T, Pritchard E, Collie A,
Newnam S, Rajaratnam S, Lubman D, de Almeida Neto A and Iles R. Driving
Health Study Report No 6: Survey of the physical and mental health of
Australian professional drivers. Insurance Work and Health Group, Faculty of
Medicine Nursing and Health Sciences, Monash University (2020)

The views and opinions expressed in this report are those of the authors and do
not necessarily reflect the views of the study funders or data providers.
Information provided in this document can only assist an individual or
organisation in a general way. Monash University is not engaged in rendering
specific professional advice and Monash University accepts no liability arising
from the use of, or reliance on, the material contained in this document. Before
relying on the material, users should carefully make their own assessment as to
its accuracy, currency, completeness and relevance for their purposes, and
should obtain any appropriate professional advice relevant to their particular
circumstances.

Acknowledgements

Driving Health is led by Monash University, supported by NHMRC Partnership
Project grant number GNT1169395 and is co-funded by study partners the
Transport Workers Union (TWU), Linfox and the Centre for Work Health and
Safety.

This report uses data collected as part of an online survey. Receipt, use and
disclosure of the data for this study was approved by Monash University Human
Research Ethics Committee (MUHREC) on 12 June 2019 (Project ID:19191).

                                                                                     2
Contents
Executive summary											                  5

Overview of the project										             8

  Rationale												                       8
  Methods												                         9
  Data analysis											                    13

Results												                           14

  Survey completion								                   14

Determinants												                      15

  Personal determinants										             15
  Work determinants											                15
  Health risk factors											              18

Outcomes												                          21

  Health												                          21
  Psychological distress										            22
  Pain													                           23
  Health-related quality of life										    23

Driving performance											                25

  Crashes and near misses										           25
  Work ability												                    25

Impact of determinants on outcomes									   26

  Psychological distress 										           26
  Self-reported general health									       28
  Pain severity and duration										        29
  Health-related quality of life										    29
  Crashes												                         30
  Near misses												                     30
  Work ability												                    31

Discussion												                        32

Summary & Conclusions										               34

References												                        35

Appendix I												                        38

Appendix II												                       46

                                                   3
Figures
Figure 1 Conceptual model for Driving Health							                                              10

Figure 2 Flow chart of survey responses								                                                  14

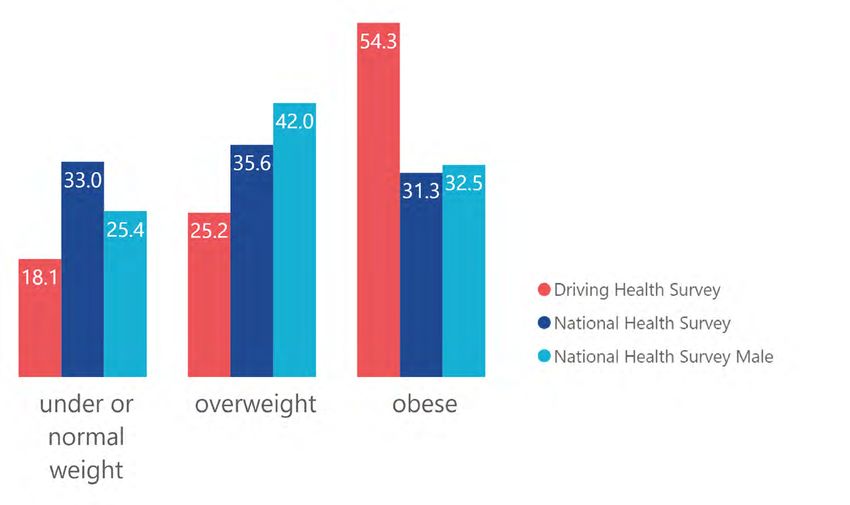
Figure 3 BMI in truck drivers vs general population							                                       20

Figure 4 Number of diagnosed health conditions in truck drivers vs general population		          20

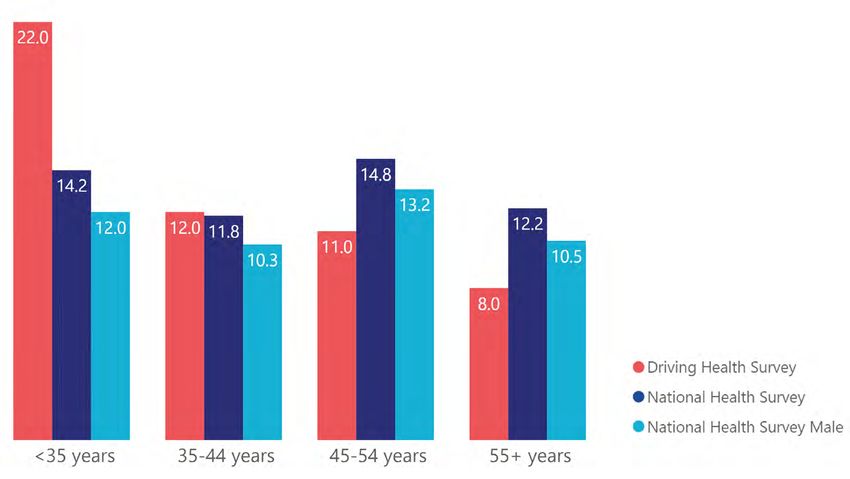
Figure 5 Severe psychological distress in truck drivers vs general population by age 		          22

Figure 6 General health of truck drivers vs general population					                              23

Tables
Table 1 Determinants and outcomes captured in the survey						                                   11

Table 2 Definition of driver categories								                                                  13

Table 3 Personal characteristics of survey respondents						                                     15

Table 4 Work characteristics of survey respondents							                                        16

Table 5 Health risk factors of survey respondents							                                         18

Table 6 Health outcomes of survey respondents							                                             21

Table 7 Comparison of driver HrQOL scores with population scores				                             24

Table 8 Driving performance outcomes for drivers							                                          25

Table 9 Determinants of significant predictors of severe psychological distress			               26

Table 10 Determinants of significant predictors of poor general health				                       28

Table 11 Determinants of significant predictors of high health-related quality of life score		   29

Table 12 Determinants of significant predictors of experiencing > 10 near misses / week		        30

Table 13 Determinants identified as significant predictors of poor work ability			               31

Table A1 Determinants of severe psychological distress						                                     46

Table A2 Determinants of poor to fair general health							                                      48

Table A3 Determinants of severe pain								                                                     50

Table A4 Determinants of pain lasting more than year						                                       52

Table A5 Determinants of higher quality of life utility score						                              54

Table A6 Determinants of driving performance (near misses)					                                  56

Table A7 Determinants of driving performance (crashes)						                                     58

Table A8 Determinants of work ability								                                                    60

                                                                                                      4
Executive summary
    Previous reports from the Driving Health study provided a broad overview of
    work-related injuries in Australian truck drivers and identified this cohort as
    being at significantly higher risk of injury and illness at work.[1—5] However,
    these approaches do not provide a full picture of the health profile of the
    Australian truck driving workforce. An overarching aim of the Driving Health
    study is to generate new data specific to the health of Australian drivers.

    This report, the sixth in the Driving Health study, presents findings from an
    online national survey of Australian truck drivers in order to:

    1. Characterise the physical and mental health of Australian truck drivers.
    2. Identify the work, personal, social, environmental, regulatory and health
       determinants that influence health outcomes and driving performance.
    3. Determine whether there are differences in the determinants of health and
       performance between long-haul and short-haul drivers, and between
       employee drivers and owner drivers.

    Methods

    Australian truck drivers were recruited through a multipronged sampling
    approach to complete a ten-minute online survey providing an overview of the
    physical and mental health of drivers and the factors affecting their health and
    driving performance. Questions captured a range of personal factors (such as
    age and gender), work factors (such as working hours and payment type) and
    health risk factors (such as diagnosed medical conditions and body mass
    index). Based on responses to work related questions, drivers were identified
    as either short-haul (< 500km) or long-haul (≥500km), and as an employee
    driver or owner driver. Health outcomes measured included general health,
    pain, psychological distress and health related quality of life. Driving
    performance outcomes included number of crashes, near misses and self-
    rated work ability. The specific impact of health, personal and work factors on
    health and driving performance outcomes was assessed with multivariate
    regression analysis.

    Health profile of drivers

    The survey was attempted by nearly 2,500 drivers, of which 1,390 complete
    surveys were eligible for analysis. The majority of drivers were employee
    drivers (85.5%) and more than half were short haul drivers (60.2%). As
    expected, most drivers were male (97.1%). Over a third (37.5%) reported
    working more than 60 hours a week.

    Over half (54.3%) of the drivers were categorised as obese, compared to the
    national average of 32.5%. Over a third of drivers reported receiving a
    diagnosis of back problems (34.5%) and high blood pressure (25.8%). Mental
    health problems, such as depression and anxiety, were also common with
    19.4% reporting a diagnosis in the last year. Almost a third of the drivers
    completing the survey (29.5%) reported being diagnosed with more than two
    of the health conditions listed, compared to 7.8% of the general population.

                                                                                       5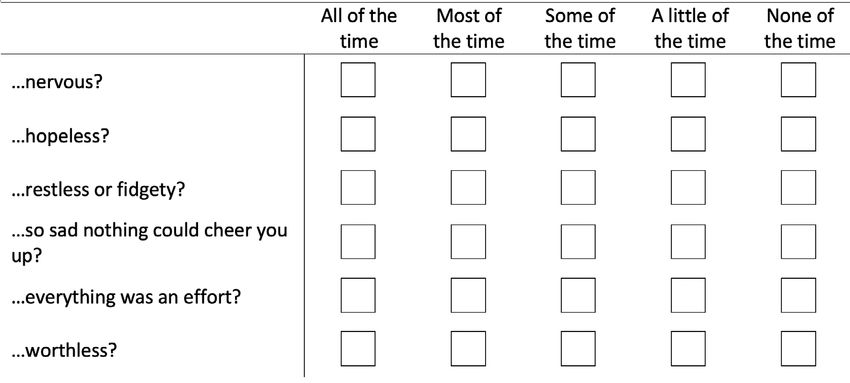
Health and performance outcomes

Half of the respondents reported having some level of psychological distress
(50.0%). However, one in five drivers under 35 years reported having severe
psychological distress compared to the national average of one in nine in the
same age group. The proportion of truck drivers rating themselves as being in
fair to poor general health (29.9%) was almost double that of the national
average for Australian males (15.8%). Chronic pain was a common affliction
among respondents as the majority (71.4%) of those reporting pain stated it
had lasted more than 3 months. Drivers reported significantly lower health
related quality of life scores compared to a normative Australian population
(mean 0.83 (SD 0.16) vs 0.91 (SD 0.14), t=15.9, p< 0.001).

Just 13.0% of the drivers reported having a crash in the past year. Near
misses occurred more frequently with 71.7% reporting near misses on
average once per week. The majority of drivers rated themselves as having
good (40.6%) or excellent (28.0%) work ability.

Determinants of outcomes

Data analysis revealed that younger age, long working hours, vehicle type
and number of diagnosed health conditions were associated with reporting
severe psychological distress. Relative to drivers with no conditions, the odds
of having severe psychological distress nearly doubled with each diagnosed
health condition.

Working hours, body mass index (BMI) and number of diagnosed conditions
were associated with poorer general health. The odds of a driver suffering
from severe or chronic pain increased significantly with the number of
diagnosed health conditions. Working hours and the number of diagnosed
conditions were related to the health utility score (quality of life) of drivers.

The only factor significantly associated with increased odds of experiencing a
crash in the last year was being diagnosed with 3 or more health conditions
(OR 1.77, 95% CI, 1.13-2.78). Age, increased working hours/week and
number of diagnosed conditions were significantly associated with higher
odds of experiencing more than 10 near-misses per week. The type of vehicle
driven, BMI and number of diagnosed conditions all had a significant impact
on work ability.

Differences between types of drivers

Short-haul drivers reported significantly higher levels of psychological distress
than long-haul drivers. Long-haul drivers were more likely to be obese and
report pain lasting more than 12 months compared to short-haul drivers, but
less likely to report severe psychological distress or report a having had a
crash in the previous 12 months. Owner drivers were more likely to report
very good health when compared to employee drivers.

                                                                                    6
Implications

The physical health of truck drivers can be characterised as poorer than the
Australian average. The rate of drivers having three or more conditions was
almost four times the rate of the Australian population [25]. Back problems were
the most common condition reported in our sample of truck drivers, similar to
previous report findings that musculoskeletal injury was the most common
type of work-related injury [2] . These factors, alongside the high prevalence of
severe and long-standing pain, paint a picture of poor physical health in truck
drivers.

Characterising mental health is somewhat more nuanced, with more drivers
under 35 years of age and fewer drivers over 45 years reporting severe
psychological distress compared to the national average. Previous reporting
demonstrated suicide was a leading cause of death of drivers under 40 [5] .
Future mental health initiatives should not only address the capacity of drivers
to cope with the stresses of the job, but also aim to reduce psychological
strain, especially for young drivers.

The number of chronic conditions reported by drivers was a consistent
predictor of not only health outcomes, but also driving performance outcomes
and self-rated work ability. Having three or more chronic conditions nearly
doubled the odds of experiencing a crash, underlining the importance of
prevention and management of chronic health conditions in drivers. Helping
drivers to be healthy and stay healthy at work will benefit drivers, employers
and the industry in general.

Other determinants observed as consistent predictors of the outcomes
measured were the number of hours worked and age. The findings suggest
that working long hours places Australian truck drivers at greater risk of
poorer mental and physical health, while exposing drivers to a greater
likelihood of near misses at work. Being experienced led to fewer near misses
and was a protective factor against psychological distress.

Conclusion

The profile of physical health of truck drivers in Australia is poor. Truck drivers
are more likely to be overweight, report poor general health and be diagnosed
with multiple chronic health conditions compared to the rest of the population.
The profile of mental health is poorer for drivers under 35 years of age, but
better for drivers over 45 when compared to the general population. This
study provides useful baseline data that establish a health profile of Australian
truck drivers. It highlights the need for mental health interventions, particularly
for younger drivers, and interventions targeted towards the prevention and
management of chronic health conditions, to help drivers be healthy and stay
healthy at work.

Future work in this area will examine the contribution of a wider range of work,
personal, environmental and regulatory factors to driver health.

                                                                                      7
Overview of the project Rationale Driving Health is a three-year study aiming to develop evidence on the health status of transport workers and factors affecting health, and provide recommendations for interventions to improve driver health. Through a series of five reports analysing workers’ compensation and life insurance claims data, the study has so far demonstrated that workers in the transport sector are at increased risk of work-related injury and disease [1] and that crashes only account for 17% of the burden of injury and illness amongst truck drivers [2]. Services for mental health are infrequently accessed in the early phase of an injury [3] and drivers do not always receive evidence-based care [4]. Finally, cardiovascular disease is the most common cause of death of drivers, but younger drivers are at greater risk of suicide [5]. These reports in the Driving Health series have captured important information on work- related illness or injury and mortality in Australian truck drivers. However, these approaches are limited and do not provide a full picture of the health profile of the Australian truck driving workforce. Notably, the true burden of mental illness and chronic disease in Australian truck drivers remains unknown. Other limitations include a lack of information on predictors of illness and injury beyond demographic and basic occupational information. Identifying risk and protective factors can inform prevention and rehabilitation strategies with the objective of improving the health and wellbeing of Australian truck drivers. There are other notable factors specific to the industry that may influence the health of drivers. It has been proposed that occupational and health risks differ between drivers driving long distances (long-haul, >500kms per day) and drivers covering shorter distances, typically in metropolitan areas (short-haul,
OBJECTIVES

This sixth report describes the results from an online survey of a large sample of Australian
truck drivers. Specifically, this phase of the study aimed to:

1. Characterise the physical and mental health of Australian truck drivers.
2. Identify the work, personal, social, environmental, regulatory and health determinants
   that influence health outcomes and driving performance.
3. Determine whether there are differences in the determinants of health and performance
   between long-haul and short-haul drivers, and between employee drivers and owner
   drivers.

Methods
DATA SOURCES

The online survey was designed to give an overview of the physical and mental health of
drivers and the factors affecting their health and driving performance. In order to be
completed by as many drivers as possible, the survey was delivered online and was
designed to be completed in less than ten minutes.

RECRUITMENT

Participants were recruited via social media and the study partner communication channels
to complete a self-administered online survey using the Qualtrics Insight Platform. Linfox,
Asia Pacific’s largest privately-owned logistics company employing over 24,000 people,
emailed employee drivers and subcontractors introducing the study and providing a link to
the survey. The Transport Workers Union (TWU), promoted the survey using text
messages, social media and emails to union members. The survey was also promoted at a
TWU industry event for its members. The survey link was promoted to specific industry
groups via Facebook and other social media channels, as well as industry-specific media
inviting drivers to participate. Lastly, the Insurance Work and Health Group, alongside study
partner the Centre for Work Health and Safety, promoted the survey through targeted paid
advertisements on Facebook, focusing on reaching a broad distribution of age groups and
driver types.

Drivers were eligible to participate if they were: a) Employed in a job involving the transport
of goods in the 12 months prior to taking the survey, and b) Drove a vehicle for the main
part of their job. Being able to complete the survey in English was a requirement to take
part. Participants were excluded if they drove a car for their job but were included if they
used any type of truck or van for the transport of goods.

Study methods were approved by the Monash University Human Research Ethics
Committee, Project ID: 19191.

                                                                                                  9
MEASUREMENT
Using a Biopsychosocial approach, the Driving Health project adapted conceptual model
described in the review by Crizzle et al [11] to examine the contribution of personal and
social, work, environmental and health determinants contributing to injury and disease
outcomes among Australian truck drivers. This conceptual model guided the
identification of items to be included in the survey [Figure 1].
DETERMINANTS
WORK FACTORS
REGULATORY
FACTORS
HEALTH OUTCOMES
HEALTH RISK FACTORS
DRIVING OUTCOMES
PERSONAL/SOCIAL ENVIRONMENTAL
FACTORS FACTORS
Figure 1 Conceptual model for Driving Health, adapted from the review by Crizzle et al (2017)
The survey was developed by the research team using standardised scales and study-
specific items addressing areas identified as important by collaborators in the transport
industry. Questions were designed to examine multiple areas of the study conceptual
model, which was developed with representatives of the transport industry and based on a
systematic review of determinants of health. The survey was piloted with a group of drivers
to ensure the content was appropriate, was easily understood and could be completed
within the ten-minute target time frame. Items were prioritised to address health and
performance outcomes and a selection of determinants. A more complete list of items was
developed for a subsequent telephone survey (not included in this report) to enable further
exploration of determinants not captured in the online survey.
A summary of the determinants and outcomes captured in the online survey appear in
Table 1 and a copy of the survey is provided in Appendix I.
10TABLE 1 DETERMINANTS AND OUTCOMES CAPTURED IN THE SURVEY
Determinants Outcomes
Personal Age Health Psychological distress
factors
Gender General health
Pain intensity
Pain duration
Health related quality of
life (HrQOL)—utility score
HrQOL—VAS score
Work factors Experience Driving Crashes
performance
Payment type Near misses
Working hours Work ability
Employment type
Work type
Shift type
Vehicle type
Number of companies
Health Risk Body Mass Index (BMI)
factors
Diagnosed health conditions
Number of diagnosed conditions
DETERMINANTS
Personal factors
Personal factors refer to the characteristics and personal circumstances of the driver.
The survey asked drivers their age and gender.
Work factors
Work factors refer to the driver’s working conditions and factors specific to professional
driving. The survey included questions about driving experience, driving distance,
employment type, payment type, shift type, working hours and the type of vehicle driven.
11HEALTH RISK FACTORS
Health risk factors refer to health conditions or other factors known to influence overall
health. Drivers were asked to estimate their height and weight which enabled an estimation
of their Body Mass Index (BMI), which was grouped into categories of under or normal
weight, overweight and obese [13]. A list of specific diagnosed conditions was derived from
the Australian National Health survey (NHS) [25] alongside previous Driving Health reports,
and drivers were asked to identify conditions they had previously been diagnosed with.
The number of reported conditions for each driver was summed to identify drivers with
multiple health conditions.
OUTCOMES
Health
Health outcomes included psychological distress, general health, pain and health related
quality of life (HrQOL). Psychological distress was measured using Kessler 6 (K6)
psychological distress scale [14]. Self-reported general health was measured using the first
question from the Short Form-12 (SF12) health survey [15]. Questions on pain duration and
severity were reproduced from the Örebro Musculoskeletal Pain Questionnaire [16]. Health-
related quality of life (HrQOL) was measured with the EuroQol-5D-5L questionnaire
(euroqol.org) containing 5 questions on mobility, personal care, usual activities, pain and
anxiety/depression, and a visual-analogue-scale (VAS) to rate general health. The VAS
score was also analysed separately as an indicator of general health.
Psychological distress was categorised as none or low (K6 score of 1-4), moderate
(K6 score of 5-12) or severe (K6 score of ≥13) [17]. Self-rated general health categories
were collapsed into Excellent/Very good, Good and Poor/Fair for comparison with the NHS
[18]
. The pain scale was converted into 4 categories, namely No pain (0), Mild (1-3),
Moderate (4-6) and Severe (7-10) to describe pain intensity. Pain duration was defined as
either 12 months, both of the latter categories
indicating chronic pain [19]. HrQOL, represented by utility scores, were calculated using an
algorithm developed by Devlin et. al.[20].This algorithm was chosen since it has been used
in the development of HrQOL normative values for an Australian population [21].
Driving performance
Driving performance outcomes included the self-reported number of near misses
experienced in the last month and the number of crashes in the last year. Work ability was
determined by the first item from the Work Ability Index asking drivers to rate their work
ability from 0 (“completely unable to work”) to 10 (“work ability at its best”) [22].
Near misses per week were collapsed into 3 categories namely: 0-5, representing an
average of once a week, 6-10 and >10 per week. The number of crashes per year was
dichotomised into yes (experienced a crash) or no (have not experienced a crash).
The Work ability score was categorised and presented as poor (0-5), moderate (6-7),
good (8-9) and excellent (10) [23].
12DRIVER CATEGORIES
In order to explore the differences in determinants and outcomes between driver types,
four categories were identified. Based on survey responses, drivers were identified as
either a long-haul or a short-haul driver, as well as an owner driver or an employee
driver. A summary of driver categories is provided in Table 2.
TABLE 2 DEFINITION OF DRIVER CATEGORIES
Work type Long-haul Short-haul
Drivers travelling 500km or more in Drivers travelling less than 500km in
one shift one shift
Employment type Owner driver Employee driver
Drivers that own the vehicle they Drivers that do not own the vehicle
drive for work they drive for work
Data analysis
Data cleaning and analyses were conducted using IBM SPSS Statistics for Windows,
Version 26 [24]. Variables that had groups with nResults
Survey completion
The final sample for analysis consisted of 1,390 completed surveys.
The number of attempted surveys and reasons for surveys not being included in the
analysis is provided in Figure 2.
2,249 Online survey attempts
44 Preview attempts/spam
Ineligible for survey/duplicate
399 responses/later withdrawals
from study
Incomplete surveys/missing
416 values
1,390 Surveys included in analysis
Figure 2 Flow chart of survey responses
14Determinants
Personal determinants
The majority of respondents were male (97.1%). Each age category was represented in relatively
equal proportions with around 25% in each 10-year age group [Table 3]. The age distribution of drivers
in the survey was consistent with labour force data from the Australian Bureau of Statistics (ABS), as
was the proportion of males compared to females in our sample [28]. This indicates that our sample is a
good representation of the driving workforce.
TABLE 3 PERSONAL CHARACTERISTICS OF SURVEY RESPONDENTS
Work Type Employment type
Whole cohort Long-haul Short-haul Owner driver Employee driver
N=1390 N=549 (39.5%) N=837 (60.2%) N=190 (13.7%) N=1188 (85.5%)
n % n % n % n % n %
Age
< 35 years 367 26.4% 141 25.7% 225 26.9% 42 22.2% 319 26.9%
35—44 years 273 19.6% 95 17.3% 177 21.2% 42 22.2% 231 19.5%
45—55 years 364 26.2% 153 27.9% 210 25.1% 52 27.5% 310 26.1%
> 55 years 383 27.6% 159 29.0% 223 26.7% 53 28.0% 326 27.5%
Gender
Male 1349 97.1% 531 97.4% 814 97.7% 185 98.4% 1152 97.5%
Female 33 2.4% 14 2.6% 19 2.3% 3 1.6% 30 2.5%
Work determinants
The majority of drivers (85.5%) were employee drivers and more than half of the drivers were short-haul
drivers (60.2%) [Table 4]. The ABS reported that nearly 14% of transport workers worked as
independent contractors which is comparable to our sample of 13.7% owner drivers [28]. The employee/
short-haul driver group (53%) represented the largest proportion of drivers in this survey, whereas the
smallest category of drivers were owner/long-haul drivers (6%). In addition, only 183 drivers (13.2%)
worked for more than one company, with no significant difference between driver types. The survey was
mostly completed by experienced drivers, with 41.2% having driven for a living for more than 20 years.
Flat rate (33.0%) and single time pay (30.0%) represented the most common form of payment for
drivers, followed by kilometre rate (20.5%) and per trip/delivery (9.3%). A larger proportion of short-haul
drivers received flat rate (40.4%) and single time pay (44.3%) (p< 0.001), whereas long-haul drivers
were more likely to be paid at a kilometre rate (48.4%) or per trip/delivery (14.2%) (p< 0.001).
Owner drivers were far more likely to be paid per trip/delivery (32.4%) than employee drivers (5.8%)
(p< 0.001). However, 34.2% of employee drivers received single time pay compared to only 4.9%
(p< 0.001) of owner drivers.
15TABLE 4 WORK CHARACTERISTICS OF SURVEY RESPONDENTS
Work Type Employment type
Whole cohort Long-haul Short-haul Owner driver Employee driver
N=1390 N=549 (39.5%) N=837 (60.2%) N=190 (13.7%) N=1188 (85.5%)
n % n % n % n % n %
Experience
< 5 years 283 20.4% 91 16.6% 191 22.8% 29 15.3% 250 21.0%
5—20 years 533 38.3% 204 37.2% 328 39.2% 76 40.2% 455 38.3%
> 20 years 573 41.2% 253 46.2% 318 38.0% 84 44.4% 483 40.7%
Payment type
Flat rate 459 33.0% 123 22.7% 335 40.4% 52 28.6% 404 34.2%
Single time pay 417 30.0% 48 8.8% 368 44.3% 9 4.9% 404 34.2%
Kilometre rate 285 20.5% 263 48.4% 22 2.7% 34 18.7% 248 21.0%
Per trip/delivery 129 9.3% 77 14.2% 52 6.3% 59 32.4% 69 5.8%
Other 86 6.2% 32 5.9% 53 6.4% 28 15.4% 57 4.8%
Working hours
per week
< 40 156 11.2% 38 7.0% 117 14.1% 27 14.4% 126 10.7%
41—60 700 50.4% 185 34.1% 513 61.8% 91 48.4% 605 51.4%
> 60 521 37.5% 320 58.9% 200 24.1% 70 37.2% 447 37.9%
Shift type
Multiple trips 789 56.8% 140 25.7% 647 78.0% 93 49.7% 689 58.4%
between same
location
Single trip between 334 24.0% 274 50.3% 60 7.2% 54 28.9% 277 23.5%
2 locations
Multiple trips 255 18.3% 131 24.0% 122 14.7% 40 21.4% 214 18.1%
between 2 locations
16TABLE 4 WORK CHARACTERISTICS OF SURVEY RESPONDENTS
Work Type Employment type
Whole cohort Long-haul Short-haul Owner driver Employee driver
N=1390 N=549 (39.5%) N=837 (60.2%) N=190 (13.7%) N=1188 (85.5%)
n % n % n % n % n %
Vehicle type
B double 451 32.4% 279 51.0% 171 20.5% 54 28.7% 395 33.3%
Articulated truck 432 31.1% 126 23.0% 305 36.5% 70 37.2% 359 30.3%
Rigid truck 291 20.9% 33 6.0% 257 30.8% 37 19.7% 250 21.1%
Road train 153 11.0% 105 19.2% 48 5.7% 10 5.3% 141 11.9%
Other 58 4.2% 4 0.7% 54 6.5% 17 9.0% 40 3.4%
Working for more 183 13.2% 89 48.6% 93 50.8% 83 45.4% 98 53.6%
than one company
Half of the cohort (50.4%) reported working between 41-60 hours per week and 37.5%
working over 60 hours per week. Only 11.2% of drivers reported working fewer than 40
hours per week. Long-haul drivers were more likely to work longer hours, with 58.9%
indicating that they work over 60 hours a week, as opposed to 24.1% in short-haul drivers
(p< 0.001), with a larger proportion of short-haul drivers working less than 40 hours a week
(p< 0.001). The majority (61.8%) of short-haul drivers reported working between 41-59
hours per week (p< 0.001). Owner and employee drivers had comparable work hours per
week.
The most common format of working shift in this cohort was multiple trips between the
same location or “home base” (56.8%), followed by a long single trip between two locations
(24.0%). Those working single trips were more likely to be long-haul drivers with 50.3%
identifying this as their regular shift type (p< 0.001). As expected, short-haul drivers were
more likely to do multiple shifts between the same location (78.0%) (p< 0.001). The
percentage of employee drivers working multiple trips between the same location (58.4%)
was greater than that of owner drivers (49.7%), however this was not statistically
significant.
The most common type of vehicles driven by respondents were B double (32.4%) and
articulated trucks (31.1%), followed by rigid trucks (20.9%) and road trains (11.0%). Most
short-haul drivers drove articulated (36.5%) and rigid trucks (30.8%), whereas long-haul
drivers were more likely to drive B double trucks (51.0%) and road trains (19.2%)
(p< 0.001). A larger percentage of owner drivers (9.0%) used “Other” vehicles
(including vans and flatbed trucks), whereas more employee drivers drove road trains
(11.9% vs 5.3%) (p< 0.001).
17Health risk factors
The BMI of drivers was calculated based on the answers to questions regarding height and weight.
The majority of drivers were classified as overweight or obese, with over half (54.3%) categorised as
obese and 25.2% as overweight [Table 5]. Using the 2017/2018 National Health Survey data,[29] a much
larger proportion of truck drivers were obese (54.3%) compared to Australian males (32.5%) [Figure 3].
Only 18.1% of the drivers fell within the normal weight range compared to 33.0% and 24.7% in Australian
general population and males respectively. A larger proportion of long-haul drivers were obese (63.0%)
compared to short-haul drivers (50.9%) (p< 0.001). A similar trend was observed in owner and employee
drivers with 47.8% and 56.9% classified as obese respectively, however this difference was not
statistically significant.
TABLE 5 HEALTH RISK FACTORS OF SURVEY RESPONDENTS
Work Type Employment type
Whole cohort Long-haul Short-haul Owner driver Employee driver
N=1390 N=549 (39.5%) N=837 (60.2%) N=190(13.7%) N=1188 (85.5%)
n % n % n % n % n %
Body Mass Index
Under or normal 252 18.1% 79 14.8% 173 21.1% 37 20.1% 212 18.3%
weight
Overweight 350 25.2% 119 22.2% 229 28.0% 59 32.1% 288 24.8%
Obese 755 54.3% 337 63.0% 416 50.9% 88 47.8% 661 56.9%
Diagnosed health conditions
Back problems 480 34.5% 193 35.2% 286 34.2% 65 34.2% 409 34.4%
High blood 358 25.8% 137 25.0% 219 26.2% 44 23.2% 312 26.3%
pressure
Mental health 269 19.4% 112 20.4% 157 18.8% 29 15.3% 238 20.0%
problems
High cholesterol 217 15.6% 80 14.6% 137 16.4% 26 13.7% 189 15.9%
Arthritis 209 15.0% 91 16.6% 118 14.1% 30 15.8% 176 14.8%
Sleep apnoea 186 13.4% 79 14.4% 107 12.8% 21 11.1% 164 13.8%
Hay fever or 174 12.5% 60 10.9% 114 13.6% 21 11.1% 152 12.8%
allergic rhinitis
Migraine/severe 162 11.7% 56 10.2% 106 12.7% 20 10.5% 142 12.0%
headaches
Asthma 141 10.1% 55 10.0% 86 10.3% 24 12.6% 116 9.8%
18TABLE 5 HEALTH RISK FACTORS OF SURVEY RESPONDENTS
Work Type Employment type
Whole cohort Long-haul Short-haul Owner driver Employee driver
N=1390 N=549 (39.5%) N=837 (60.2%) N=190(13.7%) N=1188 (85.5%)
n % n % n % n % n %
Diabetes 114 8.2% 48 8.7% 66 7.9% 13 6.8% 100 8.4%
Traumatic injury 81 5.8% 29 5.3% 52 6.2% 11 5.8% 70 5.9%
or accident
Cardiovascular 74 5.3% 32 5.8% 42 5.0% 8 4.2% 65 5.5%
disease
Cancer 41 2.9% 21 3.8% 20 2.4% 6 3.2% 33 2.8%
Osteoporosis or 33 2.4% 9 1.6% 24 2.9% 5 2.6% 27 2.3%
osteopenia
COPD 24 1.7% 14 2.6% 10 1.2% 2 1.1% 22 1.9%
Cerebrovascular 11 0.8% 7 1.3% 4 0.5% 1 0.5% 10 0.8%
disease/troke
Number of diagnosed health conditions
No conditions 346 24.9% 133 24.7% 212 25.7% 60 32.4% 282 24.1%
One condition 364 26.2% 139 25.8% 222 26.9% 49 26.5% 313 26.7%
2 conditions 248 17.8% 102 18.9% 146 17.7% 26 14.1% 219 18.7%
3 or more 410 29.5% 165 30.6% 245 29.7% 50 27.0% 357 30.5%
conditions
19Figure 3 BMI in truck drivers vs general (NHS) population (%)
Over a third of drivers reported receiving a diagnosis of back problems
(34.5%) and high blood pressure (25.8%). Mental health problems, such as
depression and anxiety, were also common with 19.4% receiving a diagnosis
in the last year. There were no appreciable differences in the health conditions
diagnosed between long- and short-haul drivers. Similarly, owner and
employee drivers had comparable distribution of diagnosed health conditions.
Almost a third of the drivers completing the survey (29.5%) reported being
diagnosed with more than two of the health conditions listed, compared to
7.8% of the general population (NHS)[25] [Figure 4].
There was no significant difference in the number of diagnosed conditions
between long- and short-haul drivers or owner and employee drivers.
Figure 4 Number of diagnosed health conditions in truck drivers vs general (NHS) population (%)
20Outcomes
Health
TABLE 6 HEALTH OUTCOMES OF SURVEY RESPONDENTS
Work Type Employment type
Whole cohort Long-haul Short-haul Owner driver Employee driver
N=1390 N= 49 (39.5%) N=837 (60.2%) N=190 (13.7%) N=1188 (85.5%)
n % n % n % n % n %
Psychological distress
None or low 695 50.0% 296 53.9% 397 47.4% 107 56.3% 582 49.0%
Moderate 510 36.7% 196 35.7% 313 37.4% 60 31.6% 444 37.4%
Severe 185 13.3% 57 10.4% 127 15.2% 23 12.1% 162 13.6%
General Health
Very good/ 437 31.4% 169 30.8% 268 32.0% 73 38.4% 360 30.3%
Excellent
Good 538 38.7% 212 38.6% 323 38.6% 72 37.9% 461 38.8%
Poor/Fair 415 29.9% 168 30.6% 246 29.4% 45 23.7% 367 30.9%
Pain—intensity
None 523 37.6% 198 36.1% 324 38.7% 77 40.5% 440 37.0%
Mild 321 23.1% 116 21.1% 203 24.3% 46 24.2% 273 23.0%
Moderate 398 28.6% 172 31.3% 225 26.9% 48 25.3% 346 29.1%
Severe 148 10.6% 63 11.5% 85 10.2% 19 10.0% 129 10.9%
Pain—duration
< 3 months 245 17.6% 80 14.7% 164 19.7% 27 14.2% 216 18.3%
3—12 months 131 9.4% 50 9.2% 81 9.7% 12 6.3% 119 10.1%
> 12 months 482 34.7% 218 40.0% 262 31.5% 74 38.9% 404 34.3%
Health related mean SD mean SD mean SD mean SD mean SD
quality of life
Utility score 0.83 0.16 0.83 0.17 0.84 0.16 0.85 0.17 0.83 0.16
EQ-VAS scale 72.2 19.8 72.0 20.5 72.4 19.4 73.9 19.6 71.9 19.9
score
21Psychological distress
Half of the drivers reported having no or low psychological distress (50.0%), whereas
13.3% and 36.7% were experiencing severe and moderate psychological distress
respectively [Table 6]. A greater percentage of short-haul (15.2%) drivers had severe
psychological distress relative to their long-haul (10.4%) driver counterparts (p< 0.05).
DRIVER PSYCHOLOGICAL DISTRESS COMPARED TO THE POPULATION
When compared to Australian population data captured in the National Health Survey
from 2017/2018[26], a larger proportion of younger drivers (< 35 years) reported high levels
of psychological distress (21.8%) than males (12.0%) and the general population (14.2%)
of the same age [Figure 5].
Figure 5 Severe psychological distress in truck drivers vs general (NHS) population by age (%)
Approximately two thirds of drivers reported being in either excellent to very good
(31.4%) or good (38.7%) health [Table 6]. There were no differences in self-rated health
between long- and short-haul drivers, however a greater proportion of owner drivers
reported very good health (38.4%) compared to employee drivers (30.3%) (p< 0.05).
DRIVER GENERAL HEALTH COMPARED TO THE POPULATION
The proportion of drivers rating themselves as being in poor/fair general (29.9%) health
was double that of the general Australian population (15.2%) and for males (15.8%)
reported in the 2017/18 NHS[18] [Figure 6]. Truck drivers appear to have poorer general
health compared to the general population.
22Figure 6 General health of truck drivers vs NHS population
Pain
Over two thirds (62.3%) experienced mild (23.1%), moderate (28.6%) and severe (10.6%)
levels of pain in the week prior to the survey [Table 6], and the remaining 37.6% did not
experience any pain. The majority of drivers experiencing pain at any level had chronic pain
lasting longer than three months (71.4% of those with pain). There were no differences in
pain severity between driver types, however a larger proportion of long-haul drivers
reported pain lasting for more than 12 months (40.0%) compared to short-haul drivers
(31.5%) (p< 0.01).
DRIVER PAIN COMPARED TO THE GENERAL POPULATION
The proportion of drivers reporting severe to very severe levels of pain (10.6%) was higher
than the 7.2% reported for the general Australian population.[25] Drivers appear to have
greater levels of pain than the general population.
Health-related quality of life
Health-related quality of life (HrQOL) scores start at 1 representing perfect health with
lower scores representing progressively poorer health. The mean (SD) HrQOL score for all
truck drivers was 0.83 (0.16) [Table 6]. The EQ-VAS scale provides a rating of self-
perceived health scored from 0 (worst possible health) to 100 (best possible health). Truck
drivers had a mean (SD) EQ-VAS score of 72.2 (19.9). There were no differences between
scores for either of the quality of life measures across the driver types.
DRIVER HEALTH RELATED QUALITY OF LIFE COMPARED TO THE GENERAL
POPULATION
The mean (SD) HrQOL score for drivers of 0.83 (0.16) was significantly lower than
the mean (SD) score of a normative South Australian (SA) population of 0.91 (0.14)
(t=15.9, p< 0.001) as well as the mean score (SD) of males from this population of 0.92
(0.13)[21] [Table 7]. Truck drivers had a mean (SD) HrQOL VAS score of 72.2 (19.8) which
was significantly lower than the SA whole (mean 78.6, SD 16.6) and male population
(mean 79.9, SD 15.7) (both p< 0.001) [Table 7]. Truck drivers appear to have a lower
health related quality of life than the general population.
23TABLE 7 COMPARISON OF DRIVER HRQOL SCORES WITH POPULATION SCORES
HrQOL utility score Comparison HrQOL VAS score Comparison
Mean SD t p Mean SD t p
Surveyed drivers 0.83 0.16 72.2 19.9
SA* whole population 0.91 0.14 15.9 < 0.001 78.6 16.6 10.3 < 0.001
SA* male population 0.92 0.13 16.3 < 0.001 78.9 15.7 9.8 < 0.001
*SA whole and male population represents normative population values derived from McCaffrey et. al.[21].
Higher HrQOL and VAS score reflects better heath state
HrQOL: Health related quality of life; VAS: Visual analogue scale; SD standard deviation; t: t statistic
24Driving performance
TABLE 8 DRIVING PERFORMANCE OUTCOMES FOR DRIVERS
Work Type Employment type
Whole cohort Long-haul Short-haul Owner driver Employee driver
N=1390 N=549 (39.5%) N=837 (60.2%) N=190 (13.7%) N=1188 (85.5%)
n % n % n % n % n %
Experienced crash in the last year
181 13.0% 59 10.7% 121 14.5% 19 10.0% 162 13.7%
Near misses
Once per week 997 71.7% 391 72.1% 603 74.1% 141 76.6% 844 72.5%
(0—5/week)
Daily 168 12.1% 65 12.0% 103 12.7% 19 10.3% 149 12.8%
(6—10/week)
> 10/week 195 14.0% 86 15.9% 108 13.3% 24 13.0% 171 14.7%
Work Ability
Poor 200 14.4% 85 15.5% 115 13.7% 27 14.2% 172 14.5%
Moderate 232 16.7% 82 14.9% 148 17.7% 33 17.4% 199 16.8%
Good 565 40.6% 217 39.5% 346 41.3% 77 40.5% 480 40.4%
Excellent 393 28.3% 165 30.1% 228 27.2% 53 27.9% 337 28.4%
Crashes and near misses
Crashes were relatively rare with only 181 (13.0%) of drivers saying they had experienced
a crash in the previous 12 months [Table 8]. Short-haul drivers were more likely to report
a crash (14.5%) than long-haul drivers (10.7%) (p< 0.05).
Near misses were more common than crashes, with 71.7% of drivers experiencing a near
miss on average once per week. Twelve percent and 14.0% of drivers reported
experiencing 6-10 and more than 10 near misses a week respectively. There was no
difference in the frequency of near misses between driver types.
Work ability
The majority of drivers completing the survey rated themselves as having good (41%) or
excellent (28%) work ability [Table 8]. There were no differences in work ability across
driver types.
25Impact of determinants on outcomes
Multivariate modelling was used to determine which determinants, when all considered together, impair
or improve the health and performance outcomes measured. The tables presented below describe
determinants found significant in the final models. Full details of each multivariate model is provided in
Appendix II.
Psychological distress
Younger age, long working hours, vehicle type and number of diagnosed health conditions were found
to be associated with reporting severe psychological distress [Table 9].Drivers under 35 years had 4.28
(95% CI 3.13-5.87) times higher odds of reporting severe psychological distress than those over the age
of 55. Drivers of “Other” vehicle types, such as a flatbed truck or van, had twice the odds (OR 2.06, 95%
CI 1.19-3.58) of reporting severe psychological distress than rigid truck drivers. Drivers working either
less than 40 hours/week (OR 0.46, 95%CI 0.30-0.69) or between 41-60 hours/week (OR 0.76, 95% CI
0.59-0.98) had significantly lower odds of suffering severe psychological distress compared to those
working over 60 hours/week. Relative to drivers with no conditions, the odds of having severe
psychological distress nearly doubled with each diagnosed health condition. As such, the odds of having
severe psychological distress was 8.28 (95% CI 5.99-11.44) times higher in drivers with 3 or more
diagnosed conditions.
TABLE 9 DETERMINANTS IDENTIFIED AS SIGNIFICANT PREDICTORS OF SEVERE
PSYCHOLOGICAL DISTRESS
Final multivariate model
OR 95% CI p
Gender Male
Female
Age < 35 years 4.28 3.13 5.87 < 0.001
35—44 1.91 1.37 2.67 < 0.001
years
45—54 1.72 1.27 2.34 < 0.001
years
> 55 years 1
Work type Short-haul 1.54 1.18 1.99 < 0.01
Long-haul 1
26TABLE 9 DETERMINANTS IDENTIFIED AS SIGNIFICANT PREDICTORS OF SEVERE
PSYCHOLOGICAL DISTRESS
Final multivariate model
OR 95% CI p
Vehicle type Other 2.06 1.19 3.58 0.01
Road train 0.81 0.53 1.26 0.35
B Double 0.84 0.6 1.17 0.3
Articulated 0.93 0.68 1.27 0.64
truck
Rigid truck 1
Working hours ≤ 40hrs 0.46 0.3 0.69 < 0.001
41—60 hrs 0.76 0.59 0.98 0.03
> 60 hrs 1
Diagnosed conditions One 2.28 1.65 3.14 < 0.001
condition
2 3.65 2.57 5.18 < 0.001
conditions
3+ 8.28 5.99 11.44 < 0.001
conditions
No 1
conditions
27Self-reported general health
Working hours, BMI and number of diagnosed conditions were found to be associated with
poorer general health. Drivers had 0.65 (95% CI 0.45-0.92) lower odds of poor general
health if they worked ≤40 hours a week [Table 10]. Similarly, having a lower BMI and being
classified as under or normal weight (OR.37, 95% CI 0.28-0.49) or overweight (OR 0.61,
95% CI 0.47-0.78), resulted in significantly reduced odds of being in poor health compared
to obese drivers. Having one diagnosed condition increased the odds of being in poor
health by 2.59 times (95% CI1.95-3.44), 4.02 times 95% CI 2.94-5.50) for 2 conditions and
7.98 times (95% CI 5.99-10.62) for 3 or more conditions.
TABLE 10 DETERMINANTS IDENTIFIED AS SIGNIFICANT PREDICTORS OF POOR GENERAL HEALTH
Final multivariate
OR 95% CI p
Working hours ≤ 40hrs 0.65 0.45 0.92 0.02
41—60 hrs 1.00 0.80 1.25 0.98
> 60 hrs 1.00
BMI Under or normal weight 0.37 0.28 0.49 < 0.001
Overweight 0.61 0.47 0.78 < 0.001
Obese 1.00
Diagnosed conditions One condition 2.26 1.69 3.04 < 0.001
2 conditions 3.89 2.81 5.38 < 0.001
3 or more conditions 8.04 5.92 10.91 < 0.001
No conditions
28Pain severity and duration
The odds of a driver suffering from severe or chronic pain increased significantly with the
number of diagnosed health conditions. Drivers with 3 or more diagnosed health conditions
were 7.98 (95% CI 5.99-10.62) and 7.69 (95% CI 5.77-10.26) times the odds more likely to
have severe pain and pain lasting over a year respectively, than those with no diagnosed
health conditions. No other determinants were significant predictors of pain outcomes.
Health-related quality of life
Working hours and the number of diagnosed conditions were related to the health utility
score of drivers [Table 11]. Drivers with 1 condition (OR 0.94, 95% CI 0.92-0.96), 2
conditions (OR 0.92, 95% CI 0.81-0.84) and 3 or more conditions (OR 0.82, 95% CI 0.81-
0.84) all had reduced odds of having a higher health utility scores relative to drivers with no
conditions. Working less than 60 hours a week was associated with significantly increased
odds of having a higher utility score. Working less than 40 hours/week and between 40-60
hours/week resulted in 1.05 (95% CI 1.02-1.08) and 1.02 (95% CI 1.00-1.04) increased
odds respectively of having a higher utility score and therefore better quality of life.
TABLE 11 DETERMINANTS IDENTIFIED AS SIGNIFICANT PREDICTORS OF HIGH HEALTH-RELATED
QUALITY OF LIFE SCORE
Final multivariate model
OR 95% CI p
Vehicle type Other 0.96 0.93 1.01 0.09
Road train 1.02 0.99 1.05 0.14
B Double 1.01 0.99 1.03 0.38
Articulated truck 1.02 0.99 1.04 0.16
Rigid truck 1
Working hours ≤ 40hrs 1.05 1.02 1.08 < 0.01
41—60 hrs 1.02 1.00 1.04 < 0.01
> 60 hrs 1
Diagnosed conditions One condition 0.94 0.92 0.96 < 0.001
2 conditions 0.90 0.87 0.92 < 0.001
3+ conditions 0.82 0.81 0.84 < 0.001
No conditions 1
29Crashes
Reported crashes were relatively rare in this cohort and the only factor significantly
associated with increased odds of experiencing a crash in the last year was being
diagnosed with 3 or more health conditions (OR 1.77, 95% CI, 1.13-2.78).
Near misses
Age, increased working hours/week and number of diagnosed conditions were significantly
associated with higher odds of experiencing more than 10 misses per week [Table 12].
Drivers with 3 or more diagnosed conditions had 2.94 (95% CI 2.06-4.20) higher odds
compared to those with no conditions. As expected, working fewer hours per week
decreased the odds of near misses in both drivers working between 41-60 hours/week (OR
0.66, 95% CI 0.51-0.86) and those working less than 40 hours/week (OR 0.45, 95% CI
0.27-0.73).
TABLE 12 DETERMINANTS IDENTIFIED AS SIGNIFICANT PREDICTORS OF EXPERIENCING
> 10 NEAR MISSES / WEEK
Final multivariate model
OR 95% CI p
Gender Male
Female
Age < 35 years 3.28 2.30 4.67 < 0.001
35—44 years 2.07 1.42 3.04 < 0.001
45—54 years 1.27 0.88 1.84 0.21
> 55 years 1
Working hours ≤ 40hrs 0.45 0.27 0.73 < 0.01
41—60 hrs 0.66 0.51 0.86 < 0.01
> 60 hrs 1
Diagnosed conditions One condition 1.69 1.17 2.44 < 0.01
2 conditions 1.60 1.06 2.40 0.03
3 + conditions 2.94 2.06 4.20 < 0.001
No conditions 1
30Work ability
The type of vehicle driver, BMI and number of diagnosed conditions all had a significant
impact on work ability [Table 13]. Articulated (OR 0.75, 95% CI 0.57-0.99) and B double
(OR 0.59, 95% CI 0.45-0.79) truck drivers both had decreased odds of reporting poor work
ability compared to rigid truck drivers. The respective odds of reporting poor work ability
were 0.66 (95% CI 0.50-0.87) and 0.71 (95% CI 0.56-0.91) in drivers with normal or
overweight BMI ranges relative to obese drivers. Lastly, having more diagnosed conditions
increased the odds of having poor work ability by 1.99 (95% CI 1.50-2.64) in drivers with
one condition, 3.14 (95% CI 2.28-4.32) with 2 conditions and 6.40 (95% CI 4.77-8.59) in
drivers with 3 or more conditions.
TABLE 13 DETERMINANTS IDENTIFIED AS SIGNIFICANT PREDICTORS OF POOR WORK ABILITY
Final multivariate model
OR 95% CI p
Gender Male
Female
Age < 35 years 1.37 1.04 1.80 0.03
35—44 years 0.98 0.72 1.33 0.90
45—54 years 0.91 0.69 1.19 0.49
> 55 years 1
Vehicle type Other 1.45 0.85 2.49 0.17
Road train 0.86 0.59 1.25 0.43
B Double 0.59 0.45 0.79 < 0.001
Articulated truck 0.75 0.57 0.99 0.04
Rigid truck 1
BMI Under or normal weight 0.66 0.50 0.87 < 0.01
Overweight 0.71 0.56 0.91 0.01
Obese 1
Diagnosed conditions One condition 1.99 1.50 2.64 < 0.001
2 conditions 3.14 2.28 4.32 < 0.001
3 or more conditions 6.40 4.77 8.59 < 0.001
No conditions 1
31Discussion
To our knowledge, this is the largest survey of the physical and mental health of Australian
professional drivers. This report describes Australian truck drivers’ demographic
characteristics, overall physical and psychological status and driving performance,
comparing long-haul drivers to short-haul drivers, and owner drivers to employee drivers.
This report also describes how the work, personal and social factors captured influence
health and driving performance.
This survey characterises the physical health of truck drivers as poorer than the average for
Australians. Over 80% of truck drivers in our study were classified as being overweight or
obese compared to the average of 70% for Australian males [29]. Comparable prevalence
rates of obesity have been reported on for truck drivers in the United States of America,
Canada and Australia [30, 31, 32, 33]. It is widely acknowledged that obesity is associated with a
series of health problems such as type 2 diabetes, high blood pressure and stroke [34, 35]. In
our survey, more drivers had been diagnosed with an ongoing health condition than the
average for Australian men, and the rate of drivers having 3 or more conditions was almost
four times the rate of the Australian population. Back problems were the most common
condition reported in our sample of truck drivers, and appeared to be double the
prevalence rates of back problems for Australian males [25]. This result aligns with the
Driving Health study report 2 in that musculoskeletal injury was the most common type of
work-related injury for Australian truck drivers [2]. These factors, alongside the high
prevalence of severe and long-standing pain, paint a picture of poor physical health in truck
drivers.
Characterising mental health is somewhat more nuanced. The prevalence of diagnosed
mental health conditions in our sample appears to be consistent with the average among
Australian males [25]. However, we found that 1 in 2 drivers surveyed reported some level of
psychological distress, and that the proportion of truck drivers under 35 with severe
psychological distress was almost double that of the average for Australian males in the
same age bracket [25]. Beyond the age of 45 the prevalence of severe psychological
distress in our survey sample was below the average reported for the Australian male
population. One explanation for the lower incidence of severe distress in older drivers could
be that drivers who have managed to remain in the occupation for a long time have been
successful in identifying coping strategies to deal with the psychological strain of being a
truck driver. Older drivers have been found to self-regulate their behaviour to compensate
for decline in their physical and cognitive abilities, however it is unclear whether self-
regulation extends to psychological distress [36]. A further explanation could relate to
changing parental responsibilities with age, as younger drivers are more likely to be
juggling a young family and work responsibilities However, the industry cannot rely on
younger drivers finding their own coping strategies without support. Driving Health report
number 5 demonstrated that for drivers under the age of 40 suicide was a leading cause of
death, second only to external causes of injury, such as crashes [5].
32Australia is at risk of a shortage of truck drivers in the future, in part due to difficulty
attracting young drivers to the profession [37] and must take steps to protect younger drivers’
mental health. Future initiatives to address the mental health of drivers, such as those
proposed by Healthy Heads in Trucks and Sheds (healthyheads.org.au) and Steering
Healthy Minds (steeringhealthyminds.com.au), should not only address the capacity of
drivers to cope with the stresses of the job, but also aim to reduce the psychological strain
placed on drivers. Consultation with older drivers will help to better understand these
results and determine if their strategies to deal with stresses at work could be used to help
younger drivers.
In this survey the number of chronic conditions reported by drivers was a significant
predictor of not only health outcomes, but also driving performance outcomes and self-
rated work ability. While the significance of having multiple chronic conditions is not
surprising when considering general health and health related quality of life, having three or
more chronic conditions approached doubling the odds of experiencing a crash. The
consequences of a crash are potentially catastrophic, yet they only represent a small
proportion of the burden of injury and illness for drivers [2]. Not only is the management of
chronic health conditions of high importance for drivers, so are preventative efforts to
reduce the risk of drivers developing multiple health conditions. Eating a healthy diet and
getting regular exercise are the basis of prevention for many chronic conditions such as
diabetes, mental health and cardiovascular diseases [38, 39, 40]. However, the long hours on
the road reported in this survey impact access to fresh food [41] and the opportunity to
exercise [32]. Unpredictable work shifts and working through the night mean that accessing a
health professional can be a challenge [30]. The majority of drivers completing this survey
were employee drivers rather than owner drivers, suggesting there may be a role to play for
employers to devote increased resources to driver health and wellbeing. Helping drivers to
be healthy and stay healthy at work will not only benefit employees, but will likely improve
their performance at work as well.
Other determinants observed as consistent predictors of the outcomes measured were the
number of hours worked and age. In line with a previous study on work health and safety in
the Australian road freight transport industry [12], nearly two fifths of participants in our
survey worked over 60 hours per week. Our findings suggest that working long hours puts
Australian truck drivers at greater risk of poorer mental and physical health, while exposing
drivers to a greater likelihood of near misses at work. To date, most state governments
have tightened the working hour regulations for commercial vehicle driving, requiring
drivers to have longer rests at night and shorter daily work hours [42]. While aiming to
improve safety in the industry, Driving Health report number 7 describes some of the
impact these regulations have on drivers who are left to balance the pressures of delivering
on time whilst adhering to mandated rest periods. In a series of interviews with drivers, it
was suggested that experienced drivers were able to manage their own fatigue levels [43]. In
our survey, being experienced led to fewer near misses and was a protective factor against
psychological distress.
Being a short-haul driver increased the likelihood of high levels of psychological distress,
and was the only difference between the driver groups retained in multivariate analysis.
One explanation for this is the larger proportion of time spent in stressful metropolitan road
traffic conditions and more frequent interaction with the general public on the road [42]. It
could also be the case that long haul drivers’ increased ability to be able to plan when and
where to stop provides a level of autonomy that leads benefits in mental health [44].
33The differences found between long- and short- haul drivers related to obesity, pain
duration and crashes were not large enough for work type to remain a significant predictor
of the outcomes examined. Owner drivers were more likely to report very good health
when compared to employee drivers, but being an owner driver or an employee driver was
not significant in any of the modelled outcomes. These results suggest that the physical
health challenges are similar for drivers regardless of the distances driven or employee
status, however interventions to address mental health may need to be different for short-
haul drivers compared to long-haul drivers. However, owner drivers made up just less than
14% of our survey sample so further engagement with owners may be required when
designing interventions to improve owner driver health.
STRENGTHS & LIMITATIONS
This study presents data from one of the largest health focused surveys of truck drivers in
Australia. Our sample includes drivers from all over Australia who drive a wide range of
vehicles across various experience levels. However, there are some limitations in this study
to be noted. While the recruitment approach included direct email, presenting at industry
events and utilising various industry and social media channels, using these approaches is
likely to bias the sample towards drivers possessing the technological skills to easily
access and complete the survey. Despite this, comparison of the sample with workforce
statistics suggests it is representative of the driving workforce [28]. Delivering the survey
online simplified recruitment and distribution of the survey to a wider range and larger
number of drivers than would have been otherwise possible. At forming around 14% of the
sample, owner drivers could be considered to be underrepresented in the data. However,
the proportion of owner drivers is similar to industry estimates [28]. The data in the survey
relies largely on self-reporting and may be influenced by the narrative and memory of the
drivers themselves. The application of validated measures such as the Kessler 6 aimed to
reduce the impact of recall bias on the findings. Finally, as a cross-sectional survey these
results should not be used as a basis for establishing causal relationships, but rather
should be used to highlight areas for further investigation.
Summary & Conclusions
The profile of physical health of truck drivers in Australia is poor. Truck drivers are more
likely to be overweight, report poor general health and be diagnosed with multiple chronic
health conditions compared to the rest of the population. The profile of mental health is
poorer for drivers under 35, but better for drivers over 45 when compared to rest of the
population. Having multiple chronic health conditions was a strong and consistent predictor
of health, work performance and self-reported work ability. Drivers work long hours, putting
them at further risk of poor mental and physical health. The health challenges are similar
across work and employment types for drivers, with the exception of short-haul drivers
being at greater risk of high levels of psychological distress.
This study provides useful baseline data that establish a health profile of Australian truck
drivers. It highlights the need for mental health interventions, particularly for younger
drivers, and interventions targeted towards the prevention and management of chronic
health conditions, in order to help drivers be healthy and stay healthy at work. Future work
in this area will examine the contribution of a wider range of work, personal, environmental
and regulatory factors to driver health.
34You can also read


