2021 Atlantic Hurricane Season Outlook: August 12, 2021
←
→
Page content transcription
If your browser does not render page correctly, please read the page content below

Catastrophe
     Willis Re    Analytics
     Briefing
     Catastrophe Analytics
     Hurricane Season Outlook

2021 Atlantic Hurricane Season Outlook: August 12, 2021
We are monitoring the developing season closely. This briefing provides an update to our early-
season briefing released on June 7. As the hurricane season enters the months of peak activity, we
provide an update on how the season appears to be shaping up.

Current Situation
With 6 named storms so far (Ana, Bill, Claudette, Danny, Elsa, and Fred) the 2021 season is progressing at a rapid
pace. In fact, Elsa was the earliest 5th named storm on record. All eyes are currently on Tropical Storm Fred that formed
the middle of this week. We expect Fred to regain tropical storm strength as it skirts along the Greater Antilles toward
the Florida Straits. Conditions are clearly favorable for storm activity.
Storms that form in the deep tropical North Atlantic are typically our strongest hurricanes. We already had one such
storm (Elsa) indicating that this region is primed for hurricane development. The past 5 years has seen above normal
activity. Will 2021 extend this unbroken run of above normal activity? Even if we had average activity for the rest of the
season, we would still exceed the average numbers of named storms. What are the chances we’ll exceed last year’s
record breaking 30 named storms, and 11 US landfalls?
As a reminder, the 30-year historical period we use as a baseline was updated this year from the period 1981 to 2010
to the more recent period 1991 to 2020. This gives a more up-to-date view of historical activity. With most of this new
period being in an active hurricane period, the new normal hurricane activity has shifted upwards to 14.4 named storms,
7.2 hurricanes and 3.2 major hurricanes. Compare that with our previous normal activity of 12.1 named storms, 6.4
hurricanes, and 2.7 major hurricanes. This represents an increase in normal activity of about 12 to 18%.

Forecasts
The most recent forecasts issued last week are worth paying attention to. They contain real skill. The early August
forecasts are unanimous in calling for above average activity (Table 1). This is relative to the new higher averages and
so these forecasts certainly call for an active season. This would be a continuation of the recent 5-year streak of above
normal activity. Note that the forecasts in Table 1 include the storms that have already happened. Note also that the
National Oceanic and Atmospheric Administration (NOAA), and the UK Met Office forecast ranges of activity to reflect
the forecast uncertainty. They state a 70% likelihood of the numbers falling within these ranges.

NOAA raised both the floor and the ceiling of its forecast range compared to its late May forecast, and now expects 15-
21 named storms. This is higher than the normal range and they are not ruling out the chance of an extremely active
season. But beating 2020 is unlikely. This nudge upwards reflects their observation that the deep tropical North Atlantic
is primed for hurricane development. Here, ocean temperatures warmed faster than normal in June and July, trade
winds are weaker than normal, and wind shear is light. They also observed a stronger than normal West African
Monsoon. This suggests the atmosphere is favorable for strong easterly waves to track across the North Atlantic and
focus energy for hurricane development. They also note an increasing likelihood of La Niña becoming established
before the season is over. Perhaps most important is the near-zero chance of El Niño this year that would suppress
hurricane activity.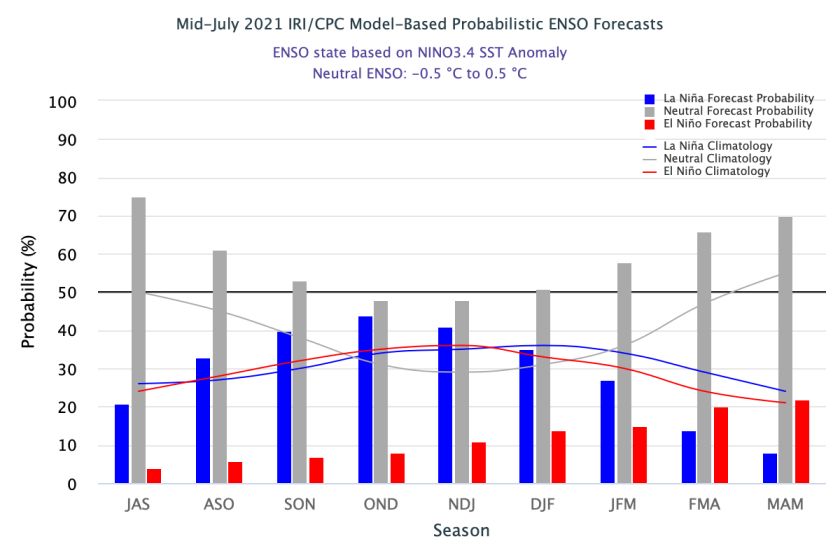
Interestingly, Tropical Storm Risk (TSR) reduced the proportion of strong storms relative to their early season forecast
but kept the numbers of named storms the same at 18. This reduction reflects a forecast for brisk, less favorable trade
winds across the tropical North Atlantic. However, they raised the forecast of US landfalling activity which they now
forecast to be above the recent 10-year average. This is based on favorable steering flow throughout July and the
increased likelihood for a weak La Niña later in the season that favors storm formation closer to the coast.

The latest forecast from Colorado State University (CSU) is nearly the same as their June 3 forecast, calling for an
above average season. They note the overall warm ocean and weak wind shear. In-line with TSR, they call for slightly
above normal chance of major hurricanes making landfall in the Continental US and Caribbean.

Atlantic seasonal hurricane forecasts issued between August 2 and August 5, 2021

 Table 1. Summary of 2021 Atlantic Seasonal Hurricane Forecasts Issued in Early August

                                                         Date                # Named                                       # Major
 Data Source                                                                                    # Hurricanes                                        ACE1
                                                        Issued                Storms                                      Hurricanes

 1991-2020 average (Source NOAA/CPC)                                    14.4                   7.2                    3.2                     122.1

 Average of 5 analog years (Source CSU)              Aug 5, 2021        16                     8                      5                       153

 Colorado State University                           Aug 5, 2021        18                     8                      4                       150

 NOAA/CPC                                            Aug 4, 2021        15-21                  7-10                   3-5                     142-246

 Tropical Storm Risk                                 Aug 5, 2021        18                     7                      3                       122

 UK Met Office                                       Aug 2, 2021        12-18                  4-8                    1-5                     64-168
1 Accumulated    Cyclone Energy (ACE) is a combined measure of hurricane intensity, duration and frequency. ACE is calculated as the sum of the square of the
maximum wind speed in each 6-hour period during the life of a tropical cyclone from the time it reaches tropical storm strength (wind speeds ≥ 65 kmph (39 mph))
in units of 104; ACE = 10-4∑v2max, where v is measured in knots.

Analog years
An alternative view to forecast models is provided by hurricane activity in past years that had similar July climate
conditions and Aug-Sept-Oct forecast conditions to this year. CSU uses this approach to qualitatively correct their
forecast. CSU’s selected analog years – 1996, 2001, 2008, 2011, 2016, 2017 – are characterized by cool-neutral to
weak La Niña conditions and slightly warmer than normal North Atlantic Ocean temperatures for the peak of the
hurricane season. The average activity among these 6 analog years is shown in the above table and indicates above
normal numbers of named storms, hurricanes, and major hurricanes, and is close to their official forecast.

                                                                                2
Climate Signals: Ocean Temperatures
The formation and development of hurricanes is
highly dependent on the available energy in the
upper layers of the ocean. Therefore, ocean
temperatures are often used as a proxy for
available energy and is a major factor in
determining seasonal activity.
This year, North Atlantic Ocean temperatures
warmed faster than normal during the first half of
the summer and are now broadly warmer than
normal (Figure 1, top panel). There are a couple
of remaining cool spots off the coast of North
Africa and off Florida’s East Coast. But dynamical
model forecasts indicate these should warm up
to become warmer than normal for the peak of
the hurricane season. This anticipated warming
will favor storm development in the deep tropics -
the breeding ground for our most intense
hurricanes.
To sustain strong hurricanes the ocean heat
must extend down through the top few hundred
meters of the ocean. A summary measure of this
heat is known as the Ocean Heat Content
(OHC). Figure 1, bottom panel shows that high
OHC extends across the main hurricane
development regions.
The highest warmth extends across parts of the
Caribbean and with a hotspot in the Gulf of
Mexico associated with the loop current. These
hotspots inject energy into hurricanes as they
pass over, as was the case for Hurricane Katrina
in 2005. These reservoirs of heat, should they
persist, are more than sufficient to nurture and
intensify passing hurricanes.
Figure 1. (top panel) Departure of weekly average sea surface
temperature from a long-term average (°C) valid on August 7,
2021. (bottom panel) Ocean Heat Content (KJ/cm2) valid on
August 11, 2021.
Sources: https://www.nhc.noaa.gov/tafb/atl_anom.gif: NCEP/NOAA, and
http://isotherm.rsmas.miami.edu/heat/weba/atlantic.php: University of Miami
Rosenstiel School
3Climate Signals: Emerging La Niña?
ENSO is currently in a neutral state but oceanic
conditions over the equatorial Pacific are
trending towards La Niña. This is evidenced by
the cooler than normal waters that now extend
across the central equatorial Pacific. The
atmosphere, however, has not yet locked in
step with the oceanic trend and looks fairly
ENSO neutral.
We are still under a La Niña Watch, as issued
by NOAA, which means that forecasts favor the
development of La Niña in the coming months.
Indeed, the latest forecasts now more strongly
favor La Niña than the forecasts issued in May
(Figure 2). The chance of El Niño has also
shrunk to just 6%. This corresponds to a 94% Figure 2. The official CPC/IRI ENSO probability forecast, based on
chance of favorable conditions (neutral or La a consensus of forecasters using human judgment and model
output.
Niña). The emergence of La Niña would push
hurricane activity towards the higher end of the
Source: International Research Institute for Climate and Society. Published
forecast ranges. July 19, 2021
Explainer: El Niño Southern Oscillation (ENSO)
The sloshing back and forth of warm water across the equatorial Pacific associated with El Niño Southern Oscillation
(ENSO) exerts the strongest known control on Atlantic hurricane activity. The atmosphere responds with rising air
following the warm water across the Pacific. In turn, this shifts the entire global overturning circulation.
During El Niño, when warm waters slosh over to the central and eastern Pacific, the ascending air drives strong winds
aloft over the Western Atlantic. Such strong winds act to rip hurricanes apart. During La Niña, when warm waters slosh
over to the Western Pacific, these hostile winds aloft over the Atlantic dissipate, leaving favorable conditions for hurricane
activity.
Confidence
Forecasts issued in early August contain useful skill but all seasonal forecasts should be read with caution. They
significantly outperform the standard benchmark of the so-called “persistence” forecast (a forecast of average activity
every year). The sources of enhanced skill arise from persistence of temperature anomalies in the oceans and the fact we
are past the April/May predictability barrier for ENSO. Remaining uncertainties stem from the progression of ENSO, the
response of TCs to the forecast environmental conditions, and the influence of intra-seasonal variability that can raise or
suppress activity for periods of a few weeks.
Summary
The collection of forecasts issued in early August are unanimous in calling for an active season. No forecasts call for an
inactive season. Things to watch during the peak hurricane months of August and September are the potential
emergence of La Niña (strengthening the case for an active season), and the evolution of hotspots of heat in the Gulf of
Mexico associated with the Loop Current.
4Additional advice
The Willis Re Analytics Team will report on all tropical storms and hurricanes in the North Atlantic and the Gulf of Mexico.
This includes briefings and updates to our clients during hurricane events. These will contain the latest information from
the National Hurricane Center, commentary on likely tracks and intensities and, when available, updates and modeling
guidance from the catastrophe modeling companies.
Forecast information sources
Klotzbach, P. J., Bell, M. M. and J. Jones: “Forecast of Atlantic Seasonal Hurricane Activity and Landfall Strike Probability
for 2021”, Aug 5, 2021, Department of Atmospheric Science, Colorado State University, Fort Collins CO, U.S. Available at
https://tropical.colostate.edu/Forecast/2021-08.pdf
Met Office: “North Atlantic tropical storm seasonal forecast 2021”, Aug 2, 2021. Available at
https://www.metoffice.gov.uk/research/weather/tropical-cyclones/seasonal/northatlantic2021
Rosencrans, M., and CoAuthors: NOAA 2021 Atlantic Hurricane Season Outlook. Issued Aug 4, 2021. Available at
https://www.cpc.ncep.noaa.gov/products/outlooks/hurricane.shtml
Saunders, M. and A. Lea: “August Forecast Update for North Atlantic Hurricane Activity in 2021”, Aug 5, 2021,
Department of Space and Climate Physics, University College London, London, U.K. Available at
https://www.tropicalstormrisk.com/
Contact us
Willis Research Network
Dr. James Done Prasad Gunturi Roy Cloutier
Willis Senior Academic Fellow Executive Vice President, Willis Re Executive Vice President, Willis Re
Capacity Center for Climate and Catastrophe Analytics Catastrophe Analytics
Weather Extremes, National Center 8400 Normandale Lake Blvd 8400 Normandale Lake Blvd
for Atmospheric Research Suite 375 (Mailing Suite 1700) Suite 375 (Mailing Suite 1700)
P.O. Box 3000, Boulder, CO, U.S. Minneapolis, MN 55437, U.S. Minneapolis, MN 55437, U.S.
D: +1 303 497-8209 T: +1 952 841 6638 T: +1 952 841 6652
E: done@ucar.edu E: prasad.gunturi@willistowerswatson.com E: roy.cloutier@willistowerswatson.com
Willis Limited, Registered number: 181116 England and Wales.
Registered address: 51 Lime Street, London, EC3M 7DQ.
A Lloyd’s Broker. Authorised and regulated by the Financial Conduct Authority for its general insurance mediation activities only.
© Copyright 2021 Willis Limited / Willis Re Inc. All rights reserved: No part of this publication may be reproduced, disseminated, distributed, stored in a retrieval system, transmitted or otherwise transferred
in any form or by any means, whether electronic, mechanical, photocopying, recording, or otherwise, without the permission of Willis Limited / Willis Re Inc. Some information contained i n this document
may be compiled from third party sources and we do not guarantee and are not responsible for the accuracy of such. This document is for general information only and is not intended to be relied upon.
Any action based on or in connection with anything contained herein should be taken only after obtaining specific advice from independent professional advisors of your choice. The views expressed in this
document are not necessarily those of Willis Limited / Willis Re Inc., its parent companies, sister companies, subsidiaries or affiliates, Willis Towers Watson PLC and all member companies thereof
(hereinafter “Willis Towers Watson”). Willis Towers Watson is not responsible for the accuracy or completeness of the contents herein and expressly disclaims any responsibility or liability for the reader's
application of any of the contents herein to any analysis or other matter, or for any results or conclusions based upon, arising from or in connection with the contents herein, nor do the contents herein
guarantee, and should not be construed to guarantee, any particular result or outcome. Willis Towers Watson accepts no responsibility for the content or quality of any third party websites to which we
refer.
The contents herein are provided for informational purposes only and do not constitute and should not be construed as profess ional advice. Any and all examples used herein are for illustrative purposes
only, are purely hypothetical in nature, and offered merely to describe concepts or ideas. They are not offered as solutions to produce specific results and are not to be relied upon. The reader is cautioned
to consult independent professional advisors of his/her choice and formulate independent conclusions and opinions regarding the subject matter discussed herein. Willis Towers Watson is not responsible
for the accuracy or completeness of the contents herein and expressly disclaims any responsibility or liability for the reader's application of any of the contents herein to any analysis or other m atter, nor do
the contents herein guarantee, and should not be construed to guarantee, any particular result or outcome.
5You can also read