2022 GLOBAL HUNGER INDEX - FOOD SYSTEMS TRANSFORMATION AND LOCAL GOVERNANCE
←
→
Page content transcription
If your browser does not render page correctly, please read the page content below
2022
GLOBAL HUNGER INDEX
FOOD SYSTEMS TRANSFORMATION AND LOCAL GOVERNANCE

2022
GLOBAL HUNGER INDEX
FOOD SYSTEMS TRANSFORMATION AND LOCAL GOVERNANCE

Klaus von Grebmer, Jill Bernstein, Miriam Wiemers, Laura Reiner, Marilena Bachmeier, Asja Hanano, Olive Towey,
Réiseal Ní Chéilleachair, Connell Foley, Seth Gitter, Grace Larocque, and Heidi Fritschel

Guest Author
Danielle Resnick, Brookings Institution and International Food Policy Research Institute

Bonn / Dublin
October 2022

A Peer-Reviewed Publication

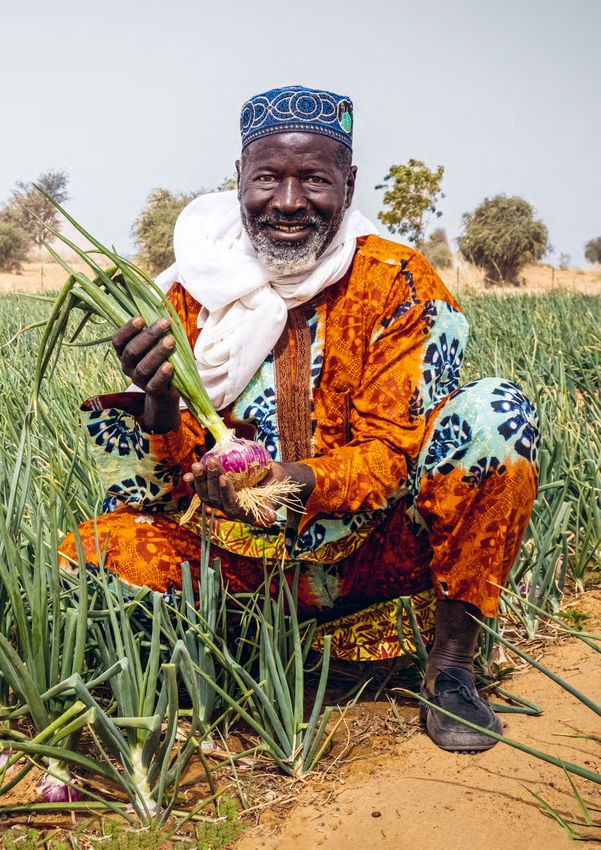
Madachir Kadir displays an onion harvested from the kitchen garden
near his community of Tahoua, Niger. People’s local setting—whether
village, district, or municipality—remains the main level at which
food system governance and food policies affect them most directly.

FOREWORD

T
      his year’s Global Hunger Index (GHI) brings us face to face with         This year’s GHI report considers one important avenue for food
      a grim reality. The toxic cocktail of conflict, climate change, and   systems transformation: community action that engages local lead-
      the COVID-19 pandemic had already left millions exposed to            ers and citizens in improving governance and accountability. The
food price shocks and vulnerable to further crises. Now the war in          essay by Danielle Resnick provides promising examples from a vari-
Ukraine—with its knock-on effects on global supplies of and prices          ety of settings where citizens are finding innovative ways to amplify
for food, fertilizer, and fuel—is turning a crisis into a catastrophe.      their voices in food system debates—including by tracking govern-
   The 2022 global GHI score shows that progress in tackling hun-           ment performance and by engaging in multistakeholder platforms—
ger has largely halted. Other indicators reveal the tragic scale of the     and keeping decision makers accountable for addressing food and
unfolding crisis. The State of Food Security and Nutrition in the World     nutrition insecurity and hunger. Encouragingly, examples of empow-
2022 reported that in 2021 the number of undernourished people—             erment are just as visible in fragile contexts with high levels of soci-
an indicator of chronic hunger—rose to as many as 828 million.              etal fractionalization as they are in more stable settings with longer
Further, according to the Global Report on Food Crises 2022, the            traditions of local democracy.
number of people facing acute hunger also rose from 2020, reach-               It is critical to act now to rebuild food security on a new and
ing nearly 193 million in 2021. These impacts are now playing out           lasting basis. Failure to do so means sleepwalking into the cata-
across Africa South of the Sahara, South Asia, Central and South            strophic and systematic food crises of the future. Much more can
America, and beyond.                                                        be done to ward off the worst impacts of the current crisis and set
   As we face the third global food price crisis in 15 years, it is         deep changes in motion rather than reinforcing the dangerous and
clearer than ever that our food systems in their current form are           unsustainable arrangements we now live with. We must ensure rights-
inadequate to the task of sustainably ending poverty and hunger.            based food systems governance at all levels, building on the initial
The global food crisis underway now is widely presented as an after-        steps taken at the 2021 United Nations Food Systems Summit.
shock caused by the war in Ukraine. The severity and speed of the           Governments and development partners must harness local voices,
impacts on hunger have occurred largely, however, because millions          match local governance efforts to conditions and capacities on the
of people were already living on the precarious edge of hunger—a            ground, and support local leadership through capacity building and
legacy of past failures to build more just, sustainable, and resilient      funding. Governments need to enable citizens to participate fully in
food systems.                                                               developing and monitoring public policies that affect food security
   While it is urgent that the international community respond to           while upholding a legal right to food.
these escalating humanitarian crises, it must not lose sight of the            Prevention pays off. Investments made today can avert future
need for a long-term transformation of food systems. The shocks             crises that may be even more costly and tragic than what we now
we have experienced reveal chronic vulnerabilities that will con-           face. It has been said that the saddest words are “If only.” We may
tinue to put millions at risk of hunger. Past and current GHI reports       find ourselves saying, “If only past generations had used their time
highlight these persistent vulnerabilities and show what actions can        and resources to do what was needed to end hunger and ensure the
address immediate humanitarian needs and kick-start food system             right to food for all.” May the next generation not say the same of us.
transformation. Rather than operating reactively, the international
community must take proactive steps to actually make good on its
international commitments and pledges, scaling them up and direct-
ing them toward emergency measures. Political attention and funding
must be targeted toward evidence-based policies and investments
that address structural obstacles to food and nutrition security. More      Mathias Mogge                                Dominic MacSorley
high-quality and timely data are also needed so that we can monitor         Secretary General                            Chief Executive Officer
progress in these areas.                                                    Welthungerhilfe                              Concern Worldwide

2022 Global Hunger Index | Foreword3
CONTENTS

     Chapter 01                    CHAPTER 02                  CHAPTER 03                     APPENDIXES

SUMMARY                                                                                                                   5

CHAPTERS
01      Global, Regional, and National Trends in Hunger                                                                   6
02      Food Systems Transformation and Local Governance                                                                 22
03      Policy Recommendations                                                                                           32

APPENDIXES
A       Methodology                                                                                                      35
B       Data Underlying the Calculation of the 2000, 2007, 2014, and 2022 Global Hunger Index Scores                     39
C       2000, 2007, 2014, and 2022 Global Hunger Index Scores, and Changes since 2014                                    42
D       Countries’ 2022 GHI Scores by Region                                                                             43

BIBLIOGRAPHY                                                                                                             47

RESOURCES FOR UNDERSTANDING HUNGER AND MALNUTRITION                                                                      52

PARTNERS                                                                                                                 54

4                                                                                        Contents | 2022 Global Hunger Index
SUMMARY

As the 2022 Global Hunger Index (GHI) shows, the global hunger                Conflict, Climate Extremes, and COVID-19 Effects
situation is undeniably grim. The overlapping crises facing the world         Are Worsening Hunger in Many Countries
are exposing the weaknesses of food systems, from global to local, and
highlighting the vulnerability of populations around the world to hunger.     Hunger is at alarming levels in 5 countries—Central African Republic,
                                                                              Chad, Democratic Republic of the Congo, Madagascar, and Yemen—
                                                                              and is provisionally considered alarming in 4 additional countries—
Global Progress against Hunger Is
                                                                              Burundi, Somalia, South Sudan, and Syria. In a further 35 countries,
at a Near Standstill
                                                                              hunger is considered serious, based on 2022 GHI scores and provi-
Global progress against hunger has largely stagnated in recent years.         sional designations. In a number of countries, hunger is worsening:
The 2022 GHI score for the world is considered moderate, but at 18.2,         since 2014, hunger has increased in 20 countries with moderate,
it shows only a slight decline from the 2014 score of 19.1. Indeed,           serious, or alarming GHI scores across multiple regions. Even within
one indicator used in the GHI, the prevalence of undernourishment,            well-performing regions and countries, hotspots of food and nutrition
shows that the share of people who lack regular access to sufficient          insecurity persist. There are, however, also signs of progress: since
calories is increasing. As many as 828 million people were under-             2000, 32 countries have seen their GHI scores decline by 50 percent
nourished in 2021, representing a reversal of more than a decade              or more, including at least one country from nearly every world region.
of progress against hunger. Without a major shift, neither the world
as a whole nor approximately 46 countries are projected to achieve
                                                                              Local Action Can Help Strengthen Food Systems
even low hunger as measured by the GHI by 2030.
                                                                              Confronted with weaknesses in the global food system, citizens in
                                                                              some areas are finding innovative ways to improve food system gov-
A Barrage of Crises Is Undermining
                                                                              ernance at the local level, holding decision makers accountable for
the Fight against Hunger
                                                                              addressing food and nutrition insecurity and hunger. Citizens are
The situation is likely to worsen in the face of the current barrage          using a range of tools, including systems for tracking government
of overlapping global crises—conflict, climate change, and the eco-           budgets and expenditures, community scorecards for assessing the
nomic fallout of the COVID-19 pandemic—all of which are powerful              performance of local governments, and inclusive multistakeholder
drivers of hunger. The war in Ukraine has further increased global            platforms that engage a range of local actors. Encouragingly, exam-
food, fuel, and fertilizer prices and has the potential to significantly      ples of empowerment are just as visible in fragile contexts with high
worsen hunger in 2023 and beyond. These crises come on top of                 levels of societal fractionalization as they are in more stable settings
underlying factors such as poverty, inequality, inadequate governance,        with longer traditions of local democracy.
poor infrastructure, and low agricultural productivity that contrib-
ute to chronic hunger and vulnerability. Globally and in many coun-
                                                                              Transforming Food Systems at All Levels Is Crucial
tries and regions, current food systems are inadequate to the task of
addressing these challenges and ending hunger.                                In the face of spiraling crises, it is crucial to scale up resources to
                                                                              respond to current emergencies while also transforming food systems
                                                                              so they are more equitable, inclusive, sustainable, and resilient—
High Hunger Persists in Too Many Regions
                                                                              and thus are able to help avert future crises. Governments and other
Hunger is serious in both South Asia (where hunger is highest) and            actors at all levels must put inclusive governance and accountability
Africa South of the Sahara (where hunger is second highest). South            at the center of efforts to transform food systems, while respecting,
Asia has the world’s highest child stunting and child wasting rates. In       protecting, and fulfilling the right to food. Stakeholders at all gover-
Africa South of the Sahara, the prevalence of undernourishment and the        nance levels should harness local voices and capacities and promote
rate of child mortality are higher than in any other world region. Parts of   strong local leadership, and governments and development partners
East Africa are experiencing one of the most severe droughts of the past      need to raise citizens’ awareness of their entitlements. Finally, efforts
40 years, threatening the survival of millions. In West Asia and North        to strengthen governance must be tailored to conditions and capac-
Africa, where hunger is moderate, there are worrying signs of a reversal in   ities on the ground.
progress against hunger. Hunger is considered low in Latin America and
the Caribbean, East and Southeast Asia, and Europe and Central Asia.

2022 Global Hunger Index | Summary5
01 In the village of Subo, Kenya, Mumina Mohamed has learned how to use climate-smart farming techniques to increase her yields of maize, mung beans, and cowpeas. With the increased harvest, she is able to provide her children with three meals a day and cover their school fees.
GLOBAL, REGIONAL, AND
NATIONAL TRENDS IN HUNGER

Key Messages                                                             The World: Progress Is at a Near Standstill

>   Global progress against hunger has largely stagnated in recent       The 2022 Global Hunger Index shows that after decades of global
    years, according to the 2022 GHI. In many countries across           hunger reduction, progress has nearly come to a halt. The 2022 GHI
    regions the situation has worsened. Indeed, one indicator used       score for the world is 18.2, considered moderate, down slightly from
    in the GHI, the prevalence of undernourishment, shows that the       the 2014 score of 19.1. This is a considerable slowdown compared
    share of people who lack regular access to sufficient calories is    with previous periods: the 2000 world GHI score of 28.0 fell to
    increasing, with as many as 828 million people undernourished        24.3 for the 2007 GHI score (Figure 1.1). The prevalence of under-
    in 2021.                                                             nourishment—one of the four indicators used in the calculation of
                                                                         GHI scores—declined between 2000 and 2017, at which point it
>   The situation is likely to worsen in the face of the current bar-    increased, at first gradually and then sharply.1 As many as 828 million
    rage of overlapping global crises—conflict, climate change, and      people were undernourished in 2021, representing a reversal of more
    the economic fallout of the COVID-19 pandemic—all of which           than a decade of progress in tackling hunger (FAO, IFAD et al. 2022).
    are powerful drivers of hunger. The war in Ukraine has further       The other indicators used in the GHI show mixed results. Rates of
    increased global food, fuel, and fertilizer prices and has the       child wasting (low weight-for-height) have stagnated in recent years
    potential to contribute to food shortages in 2023 and beyond.        worldwide,2 while rates of child mortality and child stunting (low
                                                                         height-for-age) have continued to decline (FAO, IFAD et al. 2022;
>   These crises come on top of underlying factors such as poverty,      UN IGME 2021). Compared with other indicators, however, child
    inequality, inadequate governance, poor infrastructure, and low
    agricultural productivity that contribute to chronic hunger and      1
                                                                             The global prevalence of undernourishment was 13.0 percent in 2000 and 7.6 percent in
                                                                             2017. There were small increases in the prevalence of undernourishment in two instances
    vulnerability. Globally and in many countries and regions, cur-
                                                                             between 2000 and 2017, but neither exceeded 0.3 percentage points. Between 2017 and
    rent food systems are inadequate to the task of addressing these         2021 the global prevalence of undernourishment increased from 7.6 to 9.8 percent.
                                                                         2
                                                                             These are the authors’ calculations based on data sources for child wasting listed in Appendix
    challenges and ending hunger.
                                                                             A. A comparison of child wasting values for 2012–2016 and 2017–2021 shows virtually
                                                                             no change.

>   Africa South of the Sahara and South Asia are the regions with
    the highest hunger levels and are most vulnerable to future shocks   FIGURE 1.1 WORLD GHI SCORES AND PREVALENCE OF
    and crises. Like other world regions, progress against hunger in                UNDERNOURISHMENT IN RECENT DECADES
    these regions has stagnated, which is particularly troubling given   30
                                                                                             28.0
    their desperate need for improvement.
                                                                                                                24.3                        GHI scores
                                                                         25
                                                                                                                                            Undernourishment (%)
>   Without a major shift, neither the world as a whole nor approxi-
    mately 46 countries are projected to achieve even low hunger as      20                                                         19.1
                                                                                                                                                     18.2
    measured by the GHI by 2030. There are 44 countries that cur-
    rently have serious or alarming hunger levels. Twenty countries      15
    with moderate, serious, or alarming hunger have higher 2022 GHI
    scores than 2014 GHI scores, the most recent historical reference
                                                                         10
    year for GHI scores in this report. These countries are in diverse
    world regions, not just those with the highest hunger overall.
                                                                             5

>   Levels of hunger and undernutrition vary widely within countries.
                                                                             0
    Hotspots of food and nutrition insecurity persist even within
                                                                                              2000

                                                                                                                  2007

                                                                                                                                                       2022
                                                                                                                                     2014

    well-performing regions and countries, where increased and tar-
    geted efforts are needed. A closer look at within-country data       Note: GHI scores for the year 2000 include data from 1998–2002; 2007 GHI scores include
                                                                         data from 2005–2009; 2014 GHI scores include data from 2012–2016; and 2022 GHI
    and at the performance of existing efforts to combat hunger can      scores include data from 2017–2021. Data on undernourishment are from FAO (2022a).
                                                                         The undernourishment values are for 2000–2021 for the world as a whole, including countries
    help guide programs and policies so that they benefit the spe-
                                                                         both included in and excluded from the GHI. For a complete list of data sources for the calcu-
    cific populations most in need.                                      lation of GHI scores, see Appendix A. Colors correspond to the GHI Severity of Hunger Scale.

2022 Global Hunger Index | Chapter 01 | Global, Regional, and National Trends in Hunger7
BOX 1.1 ABOUT THE GLOBAL HUNGER INDEX SCORES
The Global Hunger Index (GHI) is a tool for comprehensively measuring and tracking hunger at global, regional, and national levels.
GHI scores are based on the values of four component indicators:3
Undernourishment: the share of the population with Child wasting: the share of children under age five
insufficient caloric intake. who have low weight for their height, reflecting
acute undernutrition.
Child stunting: the share of children under age five Child mortality: the share of children who die before
who have low height for their age, reflecting chronic their fifth birthday, partly reflecting the fatal mix of
undernutrition. inadequate nutrition and unhealthy environments.
These four indicators are aggregated as follows: GHI Severity of
Hunger Scale
Extremely
alarming
GHI ≥ 50.0
Alarming
GHI 35.0–49.9
1/3 + 1/6 + 1/6 + 1/3 = GHI
Undernourishment Child stunting Child wasting Child mortality SCORE Serious
GHI 20.0–34.9
Moderate
Latest published data available from internationally recognized sources:
GHI 10.0–19.9
Low
UN Inter-Agency
UN Food and United Nations Children’s Fund (UNICEF),
Group for Child
GHI ≤ 9.9
Agriculture World Health Organization (WHO), World Bank,
Mortality Estimation
Organization (FAO) Demographic and Health Surveys (DHS) Program (UN IGME) 100-point scale
Based on the values of the four indicators, a GHI score is calculated on a 100-point scale reflecting the severity of hunger, where 0 is the
best possible score (no hunger) and 100 is the worst.4 Each country’s GHI score is classified by severity, from low to extremely alarming.
3 Each of the indicators is standardized; see Appendix A for details.
4 GHI scores are comparable only within each year’s report, not between different years’ reports. To allow for tracking of a country’s or region’s GHI performance over time, this
report provides GHI scores for 2000, 2007, and 2014, which can be compared with 2022 GHI scores. For a detailed explanation of the concept of the GHI, the date ranges and
calculation of the scores, and the interpretation of results, see Appendix A.
stunting rates change slowly over time, and it may take several years forestry, fisheries, and aquaculture, increasingly impeding efforts to
for these rates to reflect the increasingly challenging global context. meet human needs. As climate-related extremes push down the pro-
ductivity of agriculture and fisheries, the result is rising food insecurity,
The world is facing a series of overlapping chronic and acute crises water scarcity, and malnutrition. According to current projections, cli-
that are exposing vulnerabilities in the global food system and under- mate change is a key factor that will prevent the world from achieving
mining progress in ending hunger (Figure 1.2). Based on current GHI the second Sustainable Development Goal of “Zero Hunger” by 2030
projections, the world as a whole, and at least 46 countries, will fail to (IPCC 2022). As described in the 2019 Global Hunger Index report on
achieve even low hunger by 2030. The three key drivers of hunger—cli- hunger and climate change, “Human actions have created a world in
mate change, violent conflict, and economic downturns including those which it is becoming ever more difficult to adequately and sustainably
caused by the COVID-19 pandemic—are each worsening. The war in feed and nourish the human population” (von Grebmer et al. 2019, 27).
Ukraine adds an additional layer of complexity, disrupting food, fertilizer,
and energy markets around the world. The countries and populations Violent conflict, another driver of hunger, is also on the rise, as
already vulnerable due to entrenched poverty, inequality, and weak insti- described in the 2021 Global Hunger Index report (von Grebmer
tutions and governance are bearing the greatest burden of these crises. et al. 2021). According to the 2022 Global Report on Food Crises,
conflict/insecurity was the main driver of acute food insecurity in
Human-induced climate change is causing more frequent and 2021.5 Of 193 million people facing crisis or worse levels of acute
intense extreme weather events, leading to widespread adverse impacts food insecurity in 2021, conflict/insecurity was the primary driver
for nature and people. Climate change is putting stress on agriculture, 5
See “Resources for Understanding Hunger and Malnutrition” on page 52.
8 Global, Regional, and National Trends in Hunger | Chapter 01 | 2022 Global Hunger IndexFIGURE 1.2 THE RISING RISK FROM DRIVERS OF HUNGER
Worldwide, the number of undernourished people is climbing …
UNDERNOURISHED PEOPLE The number of undernourished people 828.0
800 (Millions) turned sharply upward in 2020.
721.7 767.9
700 701.9
Projected
value for 2021.
600 618.4 Shaded areas
show lower
and upper
500 bounds of the
esimated range.
400
… driven by harmful trends in food prices, poverty, conflict, and climate.
159.7
FOOD PRICES
150
(FAO Food Price Index)
Food prices reached
new highs in 2022.
100
50
PEOPLE LIVING IN EXTREME
POVERTY (Millions)
1,100
1,000 In 2020, owing largely to the COVID-19
pandemic, extreme poverty increased
900 for the first time this century.
800
714
700
600 641
500
NUMBER OF CONFLICTS 175
175
150
125 The number of state-based, non-state,
and one-sided conflicts more than
100
83 doubled between 2010 and 2021.
75
50
GLOBAL TEMPERATURE ANOMALIES
1.2 COMPARED WITH THE 20TH CENTURY
(°C) 0.99 0.98
1.0
0.8
0.6
Annual global temperatures are
0.4
rising, leading to weather extremes
0.2 and climate disasters.
0
2010
2011
2012
2013
2014
2015
2016
2017
2018
2019
2020
2021
2022
Data sources: FAO (2022a,c); World Bank (2022b); Mahler et al. (2022); UCDP (2022); NOAA (2022).
2022 Global Hunger Index | Chapter 01 | Global, Regional, and National Trends in Hunger9for 139 million people—nearly three-quarters of the total (FSIN and which spend a higher share of their income on food than wealthier
GNAFC 2022). Conflict is also a major driver of chronic hunger as households (Gill and Nagle 2022). Furthermore, rising food prices have
measured by the prevalence of undernourishment, one of the four the potential to spark further unrest and conflict (Brück and d’Errico
indicators used in the GHI. The number of conflicts that occurred 2019), perpetuating the cycle of conflict and hunger.
per year increased between 2010–2014 and 2015–2019, and con-
flicts are becoming increasingly complex and prolonged (FAO, IFAD
The Regions: High Hunger Persists in Too Many
et al. 2021). The 2022 war in Ukraine, with its global implications
Regions
for food prices and supplies, further escalates the nexus of conflict
and hunger. Box 1.2 describes the multiple ways in which the con- Progress in tackling hunger is stagnating in South Asia and Africa
flict in Ukraine is affecting global food prices and access and raising South of the Sahara, the world regions with the highest hunger levels
concerns about even more extreme impacts in the future. as measured by the GHI, at 27.4 and 27.0, respectively (Figure 1.3).
The hunger levels in both regions are considered serious. As in the
The COVID-19 pandemic has worsened the economic plight of other world regions, progress in reducing hunger has largely stagnated
low- and middle-income countries, slowing economic growth, driv- in South Asia and Africa South of the Sahara relative to 2014 (the
ing up prices for goods and services, and increasing projected global most recent reference year in this year’s report), when their scores
poverty rates. Since the COVID-19 pandemic hit in 2020, rising fuel were 28.0 and 28.1. South Asia and Africa South of the Sahara are
prices, the disruption of global supply chains, and, in some cases, dangerously off track in terms of the progress needed to achieve the
aggressive stimulus programs have contributed to a surge in global second Sustainable Development Goal of “Zero Hunger” by 2030.
inflation. Countries across the world, low- and high-income alike, are
experiencing this rise in inflation, which is the most extreme spike South Asia, the region with the world’s highest hunger level, has
experienced globally for more than 20 years (Reinhart and von Luckner the highest child stunting rate and by far the highest child wasting rate
2022). At the same time, the effects of the pandemic are projected of any world region.6 India’s child wasting rate, at 19.3 percent, is the
to last longer in poorer countries than in higher-income economies. highest of any country in the world and drives up the region’s average
Growth in gross domestic product (GDP) is expected to return more owing to India’s large population. Patterns of wasting among young
slowly to pre-pandemic expectations for poorer countries, even before children of different ages shed light on child wasting in South Asia. The
taking into account the war in Ukraine (IMF 2022). Extreme poverty, child wasting rate in South Asia is highest at birth and then consistently
too, is projected to have increased in 2020 for the first time this cen- declines to the age of three, at which point it becomes fairly steady. In
tury, and 75 million to 95 million more people are estimated to live Africa South of the Sahara, however, wasting increases between birth
in extreme poverty in 2022 compared with pre-pandemic predictions and approximately age one, at which point it begins to decline. These
(Mahler et al. 2022). Nearly two-thirds of survey respondents from patterns suggest that the factors driving South Asia’s high child wast-
18 low- and middle-income countries reported that their household ing rate are mothers’ insufficient weight gain during pregnancy and low
food quantity had diminished, and just over half reported that their birth weight among infants (Headey and Ruel 2022). In Africa South
household food quality had declined since the start of the pandemic of the Sahara, by contrast, the increase in child wasting up to age one
(Alliance2015 2022)—again, before the war in Ukraine began. may reflect challenges relating to the transition from exclusive breast-
feeding to complementary foods and the increased risk of disease
The economic pressures and disruptions that have emerged since due to the consumption of contaminated foods, drinking water from
2020 have resulted in extraordinary increases in food prices world- unimproved sources, or poor environmental sanitation (Akombi et al.
wide, with the war in Ukraine pushing prices even higher and causing 2017). Meanwhile, India, Pakistan, and Afghanistan each have child
grave concern for the future (see Box 1.2). According to the Food Price stunting rates between 35 and 38 percent, with Afghanistan’s rate
Index of the United Nations Food and Agriculture Organization (FAO), in being the highest in the region. In 2022, Afghanistan is experiencing
February 2022, global food prices reached the highest levels measured drought, political and economic instability, extreme poverty, and the
since the inception of the Food Price Index in 1990. Then, with the consequences of the global rise in food and fuel prices made worse by
onset of the war in Ukraine in late February 2022, the Food Price Index the war in Ukraine, which together may result in higher stunting rates
set another record, jumping 13 percent from February to March 2022, 6 These comparisons are based on regional indicator values calculated by the authors. FAO, IFAD
et al. (2022) indicate that Africa South of the Sahara has a higher child stunting rate than South
resulting in a level 34 percent higher than that of March 2021 (FAO
Asia. The primary difference is that the authors use child stunting and wasting survey data and
2022b). High food prices disproportionately burden poor households, GHI estimates, whereas FAO, IFAD et al. use modeled child stunting and wasting data.
10 Global, Regional, and National Trends in Hunger | Chapter 01 | 2022 Global Hunger Indexin years to come. As of May 2022, UNICEF estimates that 1.1 million predicted to continue in the late 2022 season. This extended drought
Afghan children will need treatment for acute malnutrition in 2022 has been devastating to herds, crops, water availability, and household
alone (UNICEF 2022b). incomes in the region, pushing the number of people facing acute food
insecurity in these three countries to 18.4 million as of June 2022 (UN
Africa South of the Sahara is the world region with the second- OCHA 2022). The effects of the drought are compounded by conflict in
highest GHI score, slightly below that of South Asia.7 The prevalence of the region, the ongoing fallout of the COVID-19 pandemic, price spikes
undernourishment and rate of child mortality are higher in Africa South made even more severe by the war in Ukraine, and an infestation of
of the Sahara than in any other world region. Conflict is a key contrib- desert locusts devastating local crops (Joint Research Centre 2022).
utor to food insecurity for many of the region’s countries, including
Burkina Faso, Cameroon, Central African Republic, Chad, Democratic There are troubling trends in West Asia and North Africa, the world
Republic of the Congo, Ethiopia, Mali, Niger, Nigeria, Rwanda, Somalia, region with the next-highest hunger level after South Asia and Africa
South Sudan, and Uganda (FAO, ECA, and AUC 2021; FAO, IFAD et South of the Sahara, according to its GHI score. With a 2022 score
al. 2021; FSIN and GNAFC 2022). The region is also exceptionally
8 of 11.4, West Asia and North Africa has a level of hunger considered
vulnerable to climate variability and change given its high poverty rate moderate. Yemen, the country with the highest GHI score in this year’s
and reliance on natural resource-dependent activities such as farm- report, lies in the region. Worryingly, the prevalence of undernour-
ing, fishing, and livestock herding. Heavy rains triggering flooding, ishment in West Asia and North Africa has seen an upward trend in
increased drought frequency, and desertification all have the poten- recent years, rising from 6.1 percent in 2010 to 8.6 percent in 2021,
tial to further decrease food production and increase food insecurity its highest rate since 2001. Jordan’s prevalence of undernourishment
in this region in the future (WMO 2021). increased from 6.0 percent in 2013–15 to 16.9 percent in 2019–
2021, and undernourishment rates have also increased in Lebanon,
In East Africa, Ethiopia, Kenya, and Somalia are experiencing one Oman, and Yemen in this period (FAO 2022a). The 2022 GHI scores
of the most severe droughts of the past 40 years, threatening the sur- for each of these countries are higher than their 2014 GHI scores.
vival of millions. Climate change and the atmospheric phenomenon La
Niña have contributed to severe rainfall shortages over the past four Latin America and the Caribbean is the one world region with an
consecutive rainy seasons since late 2020, and drought conditions are increase between its 2014 and 2022 GHI scores. Though its hunger
7
The countries included in each of the regions referred to here and throughout the report are level is still considered low, the increase in GHI scores from 8.0 to
shown in Appendix D.
8.8 is a troubling trend. Underpinning this increase is the rise in the
8 This includes food insecurity due to conflicts occurring within the countries themselves and
food insecurity experienced by refugees who have fled violence in neighboring countries. region’s prevalence of undernourishment, from 5.3 percent in 2014
FIGURE 1.3 REGIONAL 2000, 2007, 2014, AND 2022 GLOBAL HUNGER INDEX SCORES
50 Low
42.4
Moderate
38.1
40 Serious
35.0
35.0
Alarming
28.1
28.0
27.4
GHI score
27.0
30
18.4
16.0
20
14.2
14.2
13.6
13.3
12.4
11.4
10.6
10.3
9.3
8.8
8.2
8.0
10
7.0
6.3
0
‘00 ‘07 ‘14 ‘22 ‘00 ‘07 ‘14 ‘22 ‘00 ‘07 ‘14 ‘22 ‘00 ‘07 ‘14 ‘22 ‘00 ‘07 ‘14 ‘22 ‘00 ‘07 ‘14 ‘22
South Asia Africa South West Asia & Latin America & East & Europe &
of the Sahara North Africa Caribbean Southeast Asia Central Asia
Source: Authors.
Note: See Appendix A for data sources. The regional and global GHI scores are calculated using regional and global aggregates for each indicator and the formula described in Appendix A. The
regional and global aggregates for each indicator are calculated as population-weighted averages, using the indicator values reported in Appendix B. For countries lacking undernourishment
data, provisional estimates provided by the Food and Agriculture Organization of the United Nations (FAO) were used to calculate aggregates only, but are not reported in Appendix B. Appendix D
shows which countries are included in each region.
2022 Global Hunger Index | Chapter 01 | Global, Regional, and National Trends in Hunger11to 8.6 percent in 2021 (FAO 2022a). The dramatically worsening Republic of the Congo, Madagascar, and Yemen—and an additional
situation in Venezuela is a major contributor to this upward swing. 4 countries provisionally designated as alarming—Burundi, Somalia,
The country’s 2014 GHI score was 8.1, considered low, whereas its South Sudan, and Syria—despite there being insufficient data for
2022 GHI score of 19.9 is considered moderate verging on serious. the calculation of GHI scores.
Other countries in the region have seen a stagnation or worsening of
their GHI scores since 2014, including Ecuador, Haiti, and Suriname. Once data for 2022 become available, and if data were available
for all countries, it is highly possible that one or more countries would
At 8.2, East and Southeast Asia’s 2022 GHI score is low and has move into the extremely alarming category. Parts of Somalia in par-
decreased relative to its 2014 score, 10.3, which was in the moder- ticular are facing a serious risk of famine in 2022 owing to an excep-
ate category. While its prevalence of undernourishment, child wasting tionally severe and prolonged drought, sharp increases in staple food
rate, and child mortality rate are each considered low or very low, the prices due to the war in Ukraine, and rising conflict and insecurity.
region’s child stunting rate of 13.4 percent (FAO, IFAD et al. 2022) There are reports of an alarming increase in acute malnutrition in chil-
is considered to be at a medium level. Several countries in Southeast dren and child deaths related to hunger in southern Somalia (FEWS
Asia in particular have child stunting rates that are very high, including NET 2022b). Humanitarian assistance to alleviate the crisis has been
Indonesia (30.8 percent), Lao PDR (33.1 percent), and Timor-Leste insufficient to date. As of May 2022, 1.5 million children under the
(46.7 percent). Also, several countries in the region have medium age of five—45 percent of the country’s children—were projected to
or high wasting rates, including Cambodia (9.5 percent), Indonesia face acute malnutrition through the end of the year, including 386,400
(10.2 percent), and Malaysia (9.7 percent). These values underscore who were expected to be severely malnourished. As of June 2022, at
the need to maintain and increase efforts to address child undernu- least 2.1 million Somalis were expected to face a food emergency (IPC
trition in the region despite its low overall hunger level. Phase 4), and an additional 213,000 appeared likely to experience
famine (IPC Phase 5) between June and September 2022 (IPC 2022).
Europe and Central Asia has the lowest 2022 GHI score of any
region in the report, considered low at 6.3. The region’s 2000 GHI Yemen, with a 2022 GHI score of 45.1, considered alarming, has
score was 13.6, considered moderate. Each of the countries in the the highest score of any country in this year’s report (Table 1.1 and
region has a low 2022 GHI score, with the exception of Tajikistan, Figure 1.4). Like so many countries in this report, Yemen is suffer-
which has a score of 13.9, considered moderate. As recently as ing from conflict within its own borders as well as from the effects of
2000, the region had one country with alarming hunger (Tajikistan), conflict elsewhere. Since 2014, when Yemen became embroiled in a
four countries with serious hunger levels (Albania, Azerbaijan, civil war (Robinson 2022), poverty has increased dramatically and the
Turkmenistan, and Uzbekistan), and seven countries in the moder- country’s economy has been crippled (World Bank 2022a). Yemen is
ate category. Many countries in the region experienced a period of highly dependent on food imports, including wheat from Russia and
low agricultural production and relatively high food insecurity during Ukraine. Even before the February 2022 onset of the war in Ukraine,
the transition from socialist planned economies to market economies food prices in Yemen were rising owing to depreciation of the country’s
between 1990 and 2000. Since this transition, most countries have currency and rising fuel costs. When the conflict in Ukraine began, food
regained their production levels for most commodities and exceeded prices rose even higher, compounding food insecurity in Yemen and
them in some cases (Burkitbayeva, Liefert, and Swinnen 2021). The pushing prices of basic goods further out of reach (FEWS NET 2022a).
high volumes of grain and other agricultural commodities produced
in Ukraine and the Russian Federation highlight the significant risk Central African Republic has the second-highest 2022 GHI score
that the war in Ukraine poses for global food security and trade. in this year’s report, at 44.0, considered alarming. A staggering
52.2 percent of the population was undernourished in 2019–2021,
the highest rate of any country in this year’s report. Additionally,
The Countries: Conflict Is Driving Hunger Directly
40.0 percent of the country’s children are stunted, 5.3 percent are
and Indirectly
wasted, and 10.3 percent of children do not live to their fifth birth-
According to the 2022 GHI scores and provisional designations, day. According to the most recent edition of the Human Development
9 countries have alarming levels of hunger and 35 have serious Index (HDI), Central African Republic has the second-worst HDI score
levels of hunger. There are 5 countries with 2022 GHI scores in of any country with data in the world, after only Niger (UNDP 2020).
the alarming range—Central African Republic, Chad, Democratic The country has experienced decades of violence and instability, and
12 Global, Regional, and National Trends in Hunger | Chapter 01 | 2022 Global Hunger IndexTABLE 1.1 GLOBAL HUNGER INDEX SCORES BY 2022 GHI RANK
Rank1 Country 2000 2007 2014 2022 Rank1 Country 2000 2007 2014 2022
BelarusFIGURE 1.4 2022 GHI SCORES AND PROGRESS SINCE 2000
55
Extremely
alarming
50
Higher
hunger
Yemen
45
Central African Republic
Alarming
40
Madagascar
Chad Dem. Rep. of the Congo
2022 Global Hunger Index score
35
GHI Severity Scale
Niger Liberia Haiti
Lesotho
Sierra Leone
Guinea-Bissau
30
Zambia Afghanistan India
Serious
Rep. of Congo
Ethiopia Nigeria
Rwanda Comoros
Papua New Guinea
Angola Pakistan
25 Burkina Faso Korea (DPR)
Tanzania
Mali Kenya
Togo
Benin
Djibouti Gambia
Malawi Mauritania
Solomon
20 Nepal
Botswana Venezuela
Bangladesh Islands
Lao PDR
Cameroon Guatemala
Indonesia Namibia
Cambodia Gabon
Côte d’Ivoire
Eswatini
Moderate
Myanmar Senegal
Ecuador
15 Philippines
Nicaragua
Tajikistan Ghana
Lower Iraq Sri South Mauritius
Bolivia Lanka Africa Oman
hunger Honduras
Thailand Egypt Malaysia
Viet Nam
Cabo Verde
Guyana Jordan
10 Suriname Lebanon
Low
5
-40 -35 -30 -25 -20 -15 -10 -5 0 5 10
Higher reduction Lower reduction Increase in
in hunger in hunger hunger
Absolute change in GHI score since 2000
Source: Authors.
Note: This figure illustrates the change in GHI scores since 2000 in absolute values. It features countries where data are available to calculate 2000 and 2022 GHI scores and where 2022 GHI
scores show moderate, serious, alarming, or extremely alarming hunger levels. Some likely poor performers may not appear due to missing data.
14 Global, Regional, and National Trends in Hunger | Chapter 01 | 2022 Global Hunger Indexa 2019 peace agreement was never fully implemented, resulting in FIGURE 1.5 WHERE THE INDICATORS OF HUNGER ARE HIGHEST
chronic cycles of violence and displacement. A contentious election
cycle in late 2020 and early 2021 fueled further violence, acceler- Child stunting (%) 2017–2021
60 55.5
ated population displacement, and sparked a particularly severe food 50.9
50 46.7
security crisis in the country in 2021 (Murray and Sullivan 2021; 44.4
41.8 40.0 39.8 39.6 38.2 38.2
40
UNICEF and WFP 2021).
30
Madagascar, with an alarming 2022 GHI score of 38.7, has the 20
third-highest score in the 2022 GHI. Nearly half of the population, 10
48.5 percent, was undernourished in 2019–2021, the second- 0
pu ar
n
a
M ep al
di
en
e
er
ng of
Af ine w
al
highest rate in this year’s report, after only Central African Republic.
ta
t
e
c
R tr
un
es
ig
ad .
ric C o
gh a
m
Co .
em
Gu N
as
is
an en
e p
N
-L
Ye
r
an
e
ag
a
Bu
at
th . R
or
Meanwhile, 39.8 percent of children were stunted and 7.7 percent
Gu
m
m
Pa
Ti
De
Af
of children were wasted as of 2021, and the child mortality rate was
5.0 percent. The arid southern regions of Madagascar are especially Child wasting (%) 2017–2021
20 19.3
vulnerable to food and nutrition insecurity. Drought is a regular occur- 16.9
16.1
15.0
rence in the area, including a recent drought that began in 2019, 15
12.0 11.5 11.5
with aftereffects expected to last until the end of 2022. People in the 10.4 10.2 10.2
10
south of the country have been facing a hunger and undernutrition
crisis since 2020, caused not only by drought but also by disease out- 5
breaks and the economic impact of COVID-19 containment measures,
0
as well as chronic issues such as poverty, poor infrastructure, a lack
a
n
en
ka
al
s
er
os
ad
a
iu
di
si
da
ep
ig
of water for irrigation or drinking, and criminal activity (ACAPS 2022).
or
an
m
Ch
ne
rit
In
Su
N
m
N
Ye
iL
au
do
Co
Sr
M
In
Cyclones Emnati and Batsirai devastated extensive tracts of southeast
Madagascar, causing loss of lives, assets, and livelihoods and exacer-
Undernourishment (%) 2019–2021
bating food insecurity in southern Madagascar. 60
52.2
50 48.5 47.2
41.6 41.4 39.8
Since 2014, hunger has increased in 20 countries with moder- 40 38.3
35.8 34.7 32.7
ate, serious, or alarming 2022 GHI scores across multiple regions 30
(Appendix C). The 2022 GHI scores of these countries vary widely, 20
from 10.2 (Suriname) to 45.1 (Yemen), showing that worsening hun- 10
ger can afflict countries with a range of hunger severity. Venezuela 0
had the largest increase in this period, with hunger rising from low
M Re ral
r
ti
a
en
ria
da
o
ad
ng of
ca
re
th
ai
ad p.
m
an
Ch
t
be
o
Co .
as
Ko
H
so
an en
e ep
Ye
Rw
(2014 GHI score of 8.1) to moderate verging on serious (2022 GHI
Li
ag
Le
ric C
th . R
R
DP
m
De
score of 19.9). Over the longer term, only two countries—Venezuela
Af
and Yemen—with moderate, serious, or alarming 2022 GHI scores
Child mortality (%) 2020
12 11.5 11.4
have a higher 2022 GHI score than their 2000 GHI score (Figure 1.4). 11.0 10.8
10.3
10 9.8 9.6
9.1 9.0 8.6
Several countries have exceptionally high values for one or more of 8
the indicators used in the calculation of GHI scores, even if their overall 6
scores do not put them in the highest categories of hunger (Figure 1.5). 4
For example, Timor-Leste has the third-highest child stunting rate of 2
any country in the world with data, at 46.7 percent, despite a GHI score 0
in the serious category. India, with a GHI score considered serious, has
ea
ia
ia
ad
e
So Re tral
n
i
o
n
al
on
th
da
ni
al
er
in
ut p.
Ch
M
so
Be
an en
m
Le
ig
Su
Gu
Le
So
N
the world’s highest child wasting rate, at 19.3 percent; rates are also
ric C
ra
h
er
Si
very high in Sudan, Yemen, and Sri Lanka. At 47.2 and 41.6 percent,
Af
respectively, Haiti and the Democratic People’s Republic of Korea each Source: Authors (see Appendix A for data sources). Very high High
2022 Global Hunger Index | Chapter 01 | Global, Regional, and National Trends in Hunger15have very high undernourishment rates—the third- and fourth-highest countries, where increased and targeted efforts are needed” (Local
rates of any countries with data. Nigeria, with a serious hunger level, Burden of Disease Child Growth Failure Collaborators 2020, 234).
has the second-highest child mortality rate, at 11.4 percent, just after
that of Somalia, at 11.5 percent. Awareness of which countries strug- Inequality in nutrition within country borders is perhaps unsur-
gle the most according to each indicator is urgently required to ensure prising given the high degree of inequality in the coverage of health
these problems do not go unheeded. interventions. In Africa South of the Sahara, research reveals that
coverage of reproductive, maternal, newborn, and child health inter-
There are also signs of progress, with many countries achieving ventions is distributed unequally in nearly all countries, and this
impressive reductions in hunger. Since 2000, 32 countries have seen inequality has decreased only slightly in recent years. Fragile and
their GHI scores decline by 50 percent or more, including at least one conflict-affected states tend to have higher levels of inequality in
country from nearly every world region.9 For example, in Africa South terms of health intervention coverage, whereas good governance,
of the Sahara, Angola, Djibouti, Ghana, Malawi, and Senegal have each political stability, and absence of violence are associated with more
reduced their GHI scores by 50 to 60 percent since 2000. In West Asia equitable health intervention coverage (Faye et al. 2020).10
and North Africa, Algeria, Iran, and Türkiye have reduced their scores by
50 percent or more since 2000, each moving from the moderate to the Despite the high level of attention given to nutrition indicators
low category. Thirteen of the 32 countries in this category are in Europe at the national level, many public health and nutrition programs are
and Central Asia. Five countries in Latin America and the Caribbean— administered at a state or local level. This reality drives the need for
Bolivia, Brazil, Panama, Peru, and Uruguay—have had reductions of better data at the subnational level, as well as for a clearer under-
50 percent or more, with all of these except Bolivia reaching the low standing of what improves food security and nutrition at state or local
category according to 2022 GHI scores. Mongolia has experienced the levels (Local Burden of Disease Child Growth Failure Collaborators
most dramatic improvement in East and Southeast Asia: its 2022 GHI 2020). Community feedback on and oversight of locally managed
score of 5.7, reflecting low hunger, is more than 80 percent lower than health and nutrition programs can help improve the design and imple-
its 2000 score of 30.0, considered serious. Given that many countries mentation of such programs, as discussed in chapter 2 of this report.
have experienced an increase in hunger in recent years, it is remarkable
that all but 3 of these 32 countries also experienced declines relative Ethiopia serves as an example of a country where child stunt-
to their 2014 GHI scores, and those that did experience increases saw ing rates vary considerably between regions, with the northern
their GHI scores rise by less than one point. regions experiencing higher levels of stunting than those in the
south (Figure 1.6). The regions of Afar, Amhara, Benishangul-Gumuz,
and Tigray have the highest stunting rates in Ethiopia, ranging from
Within Country Borders: Hotspots of Hunger
40.7 to 48.4 percent (EPHI and ICF 2021). Extreme conditions,
Many countries, even those with favorable GHI scores, have wide dis- including cyclical drought, high levels of deforestation, and conflicts,
parities in nutritional status, with areas of serious child undernutrition. all negatively affect agricultural production, food security, and child
A recent project mapped and analyzed child stunting, wasting, and nutrition (Ahmed et al. 2021).
underweight data down to the local district or county level between
2000 and 2017 in 105 low- and middle-income countries. Stunting In Nepal, stunting rates range from 22.6 and 22.9 percent, respec-
disparities between districts or counties were particularly pronounced tively, in Gandaki and Bagmati provinces in the central region of the
in Honduras, India, Nigeria, and Viet Nam. The areas with the least country to more than double that, at 47.8 percent, in Karnali province
improvement over time—where stunting levels either increased or stag- in the west of the country (CBS 2020) (Figure 1.6). Karnali, along with
nated—were in central Chad, central Pakistan, central Afghanistan, and Sudurpashchim, Lumbini, and Madhesh provinces, where one-third
northeastern Angola, as well as throughout the Democratic Republic or more of children are stunted, are the provinces with the highest
of the Congo and Madagascar. In terms of child wasting, disparities Multidimensional Poverty Index values (NPC 2021). Other explanations
were particularly evident in Ethiopia, Indonesia, Kenya, and Nigeria. for the high levels of child undernutrition in these provinces include
The study authors concluded that there were “hotspots of persistent difficult geographical terrain, poor infrastructure and transportation
CGF [child growth failure] even within well-performing regions and 10 The reproductive, maternal, newborn, and child health interventions included in the study are
not nutrition-specific interventions, yet these types of interventions, and access to health care
9 No country in South Asia has reduced its score by 50 percent or more since 2000, but Nepal more generally, often serve as entry points to nutrition-specific interventions (Baye, Laillou,
came very close, with a reduction of 48.4 percent. and Chitweke 2020).
16 Global, Regional, and National Trends in Hunger | Chapter 01 | 2022 Global Hunger Indexfacilities, food insecurity, low overall socioeconomic development, undernutrition. Compared with districts where stunting rose or stayed
and lack of access to healthcare services (Bhusal and Sapkota 2022). the same, districts that reduced stunting had better-organized DPEM
committee meetings, with more participation from diverse sectors;
The example of India shows the importance of considering the subna- had better communication between district-level actors and decision
tional context when designing programs and policies to target child stunt- makers at the national level; reported better multisectoral integration,
ing. Researchers investigated the factors that contributed to a decline in with representatives from various sectors focusing on nutrition; and
stunting in four Indian states between 2006 and 2016: Chhattisgarh, were less likely to report a need for additional training in their dis-
Gujarat, Odisha, and Tamil Nadu. They found that stunting fell mainly in tricts on nutrition-related issues (Iruhiriye et al. 2022).
response to improvements in the coverage of health and nutrition inter-
ventions, household conditions (such as socioeconomic status and food
Conclusion
security), and maternal factors (such as mothers’ health and education).
While improvements in household conditions were the most important The global hunger situation as reflected in the 2022 GHI is grim. The
factor for each of the four states, the second most important factor var- overlapping crises facing the world are exposing the weaknesses of
ies by state. As the authors conclude, this variability across states “indi- food systems, from global to local, and highlighting the vulnerability
cates the need for contextualized policy and programmatic initiatives of populations around the world to hunger. Despite the “Zero Hunger”
to help focus the efforts in the sectors that need the most attention for target articulated in the Sustainable Development Goals, the prog-
continued decline in stunting” (Avula et al. 2022, 10). ress that has been made is being lost, and the situation is worsen-
ing in too many countries. The threat of famine looms yet again in
In Rwanda, districts that have implemented their nutrition pro- the Horn of Africa, with humanitarian funds insufficient as of yet to
grams with a high degree of political commitment and multisec- reach all those in need. A failure to address this threat at the scale
toral collaboration have experienced the most success in reducing required would be a tragic indictment of the global food system and
child stunting. Starting in 2009, the Rwandan government has a fundamental breach of the human right to food.
become increasingly committed to reducing undernutrition while It is critical to act now to halt and reverse the forces driving hun-
also decentralizing government services to the district and local ger and undernutrition and to take steps to build a more resilient,
levels. Each district created an annual District Plan to Eliminate just, and sustainable world where hunger is a thing of the past. There
Malnutrition (DPEM), laying out multisectoral approaches to tackling can be no more excuses.
FIGURE 1.6 SUBNATIONAL INEQUALITY OF CHILD STUNTING, ETHIOPIA AND NEPAL
Tigray (48.4)
Afar
Amhara (42.2) ETHIOPIA
(41.5) Sudurpashchim
Benishangul- (40.9) NEPAL
Karnali (47.8)
Gumuz (40.7) Dire Dawa (25.4)
Harari (36.4) Gandaki (22.6)
Addis Ababa
Lumbini
(15.0)
Gambela Oromia (35.3) (35.5)
(17.3) Bagmati (22.9)
Somali (30.6) Province No. 1
Southern Nations,
Nationalities, Madhesh (24.9)
and Peoples (36.4) (34.2)
Stunting rate
10–19.9% 20–29.9% 30–39.9% 40% or more
Source: EPHI and ICF (2021). Source: CBS (2020).
Note: The map of Ethiopia reflects the nine regional states and two city administrations as they existed in 2019, the year when the survey from which the data were obtained was conducted.
Two new regional states have since been formed but are not shown here. Boundaries, names, and designations shown on maps in this report do not imply official endorsement or acceptance
by Welthungerhilfe or Concern Worldwide.
2022 Global Hunger Index | Chapter 01 | Global, Regional, and National Trends in Hunger17ENDING HUNGER: A DREAM OR STILL A POSSIBILITY?
BOX 1.2
Maximo Torero
There is already enough food to feed everyone in the world; (Kharas and Dooley 2021; FAO, IFAD et al. 2022). In coun-
those going hungry just lack access. tries like Democratic Republic of the Congo, Ethiopia, Nigeria,
Global trade moves food from where it is produced to where and Yemen, the number of people facing hunger jumped by
it is consumed, keeping people fed. Russia and Ukraine are two 20 percent between 2020 and 2021 (FSIN and GNAFC 2021).
of the world’s largest agricultural producers, whose food exports Globally, 3.1 billion people cannot afford nutritious foods
account for some 12 percent of total calories traded in the world and depend on starchy foods for calories (FAO, IFAD et al.
(Laborde 2021). The war is wrecking a quarter of global grain 2022). Based on current GHI projections, 46 countries will fail
trade. What is at stake is an international agricultural trade worth to achieve a low level of hunger by 2030.
some $1.8 trillion (UNECE 2021). At the outset of the pandemic, countries committed to
The fallout of this disruption could be devastating. Some 50 working together to keep global agricultural trade flowing amid
nations that rely on Russia and Ukraine for the bulk of their wheat lockdown measures. Now, with panic setting in, signs of pro-
imports—including Bangladesh, Egypt, Iran, and Türkiye—have tectionism have emerged, as governments begin to impose food
been scrambling to find alternative suppliers (Reuters 2022; El export bans to protect domestic supply (Glauber, Laborde, and
Safty 2022). Mamun 2022).
This situation comes on top of persistent food inflation, Rising prices have already put even the most basic foods
which began in the second half of 2020. In March 2022, beyond the reach of many poor families across the globe. If the
global food prices jumped to their highest levels ever recorded. war in Ukraine continues, food inflation will spell greater disas-
Compared with the previous year, prices for cereals were up ter, especially for poorer countries.
37 percent; cooking oils, 56 percent; and meat, 20 percent. As My colleagues and I estimate that between 8 and 13 million
of July, prices have fallen slightly since March, but in June they more people could become undernourished in 2022–23, with
were still 27 percent higher than in June 2021 (FAO 2022c). the biggest increases occurring in Asia, Africa South of the
Even before the Ukraine war, fertilizer prices were skyrock- Sahara, and the Middle East (FAO 2022d).
eting owing to high demand and the rising cost of natural gas,
How to Avert Disaster
a key component in fertilizers. The disruption of fertilizer ship-
The war between Russia and Ukraine may seem like the death
ments from Russia, a leading fertilizer exporter, is undermining
knell for the hunger goal.
food production everywhere, from Brazil and Canada to Kenya
But the chasm between reality and the utopian ideal of
and Zimbabwe, and could lead to lower global crop yields next
achieving “Zero Hunger” should not be a reason for despair.
year (Polansek and Mano 2022). And global food stockpiles are
Rather, the goal should serve to hold governments and the inter-
lower than they were before the pandemic.
national community accountable for fulfilling the universal right
All of this adds up to greater food price volatility. When the
to food and ensuring a dignified life for everyone. As international
price of food ticks upward, it does not mean simply that people
cooperation shrinks amid geopolitical tension, such advocacy
must tighten their belts or pay more for their meals. For those
has never been more important. This goal is a battle cry to rally
already on the brink of famine, it could literally mean starva-
support and push countries into action.
tion. Food inflation can unsettle markets and even precipitate
So what can be done? The answer is, a lot. Food aid that
the overthrow of governments, as it did in Sri Lanka (Jayasinghe,
has kept families afloat through the pandemic must continue.
Pal, and Ghoshal 2022), whose experience serves as a warning
Without strong social safety nets, countries cannot begin to
to the rest of the world.
reverse the trend in hunger. Governments are financially strapped
A Losing Fight and not keen on expanding social safety nets—but they must
At the 1974 World Food Congress in Rome, Henry Kissinger remember that the generous COVID-19 aid packages, especially
declared that in 10 years no child would go to bed hungry across industrialized countries, cushioned the shock of the pan-
(Kissinger 1974). Although his prediction did not come true, the demic lockdowns, which would have triggered a global recession
decades that followed marked steady progress against hunger. and sent hunger rates soaring.
Unfortunately, though, when 193 countries met at the United Vulnerable countries, especially poorer countries that rely on
Nations in 2015 to commit to ending global hunger in 15 years, food imports from Russia and Ukraine, should be given imme-
the trend was already reversing—the number of undernourished diate financing to buy food for their populations (FAO 2022e).
people in the world had started to rise (FAO, IFAD et al. 2022). An emergency fund of $24.6 billion would cover the immedi-
Then came the COVID-19 pandemic, which wiped out two ate needs of the 62 most vulnerable countries, which are home
decades of progress on combating extreme poverty and hunger, to 1.79 billion people. The International Monetary Fund is well
forcing hundreds of millions more people into chronic hunger positioned to implement this initiative.
18 Global, Regional, and National Trends in Hunger | Chapter 01 | 2022 Global Hunger IndexYou can also read