2021 GLOBAL HUNGER INDEX - HUNGER AND FOOD SYSTEMS IN CONFLICT SETTINGS
←
→
Page content transcription
If your browser does not render page correctly, please read the page content below
2021
GLOBAL HUNGER INDEX
HUNGER AND FOOD SYSTEMS IN CONFLICT SETTINGS
2021
GLOBAL HUNGER INDEX
HUNGER AND FOOD SYSTEMS IN CONFLICT SETTINGS

Klaus von Grebmer, Jill Bernstein, Miriam Wiemers, Tabea Schiffer, Asja Hanano, Olive Towey,
Réiseal Ní Chéilleachair, Connell Foley, Seth Gitter, Kierstin Ekstrom, and Heidi Fritschel

Guest Authors
Caroline Delgado and Dan Smith, Stockholm International Peace Research Institute

Bonn / Dublin
October 2021

A Peer-Reviewed Publication
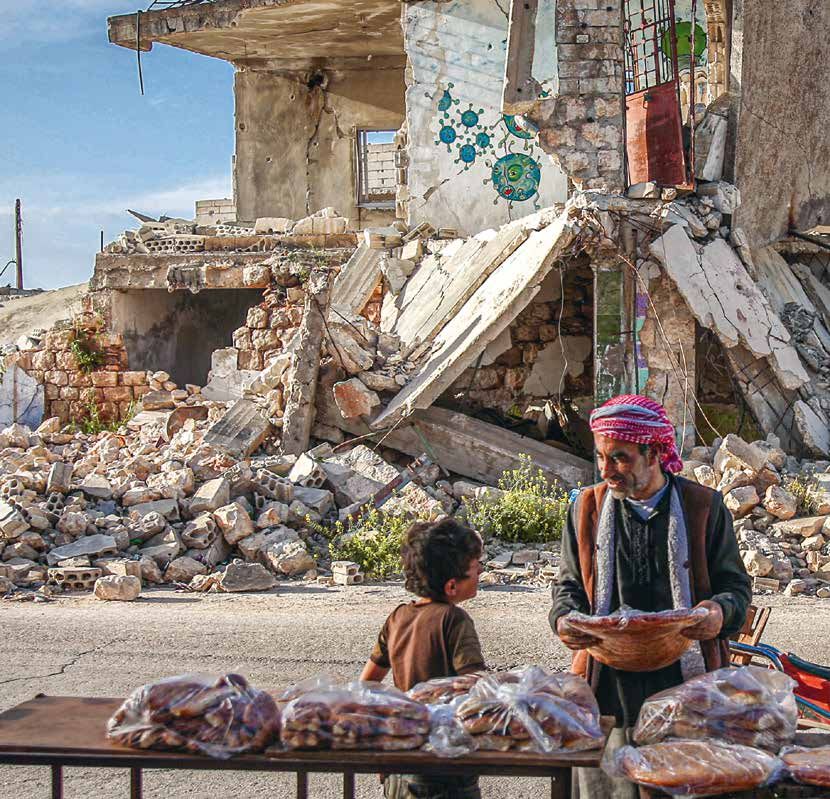
A child returns from a free bread distribution at a camp in Idlib,
Syria, for people displaced by the country’s civil war. While food
distributions address immediate needs, longer-term measures, like the
construction or rehabilitation of bakeries, can ensure self-supply and
create employment opportunities during times of protracted conflict.
FOREWORD
A
s the year 2030 draws closer, achievement of the world’s com- lens into peace building. They assert that progress on peace and food
mitment to Zero Hunger is tragically distant. Current projec- security is possible even in the most unfavorable circumstances, and
tions based on the Global Hunger Index (GHI) show that the even small-scale interventions by humanitarian, development, and
world as a whole—and 47 countries in particular—will fail to achieve peace actors can go a long way in contributing to peace building. They
even low hunger by 2030. identify four priorities for making effective progress: a flexible and
Recent reports have already sounded the alarm. The State of Food agile approach based on a thorough understanding of local contexts;
Security and Nutrition in the World 2021 emphasizes that under- a commitment to working in partnerships that bring together local
nourishment was on the rise even before the COVID-19 pandemic, actors, national governments, and international organizations; inte-
which has only exacerbated food insecurity. The Global Report on grative ways of working along the humanitarian-development-peace
Food Crises 2021 points to the growing magnitude and severity of nexus that include relevant stakeholders; and flexible, need-based,
food crises in 2020 and the grim outlook for 2021. The World Food cross-sectoral, and multiyear financing.
Programme warns that 41 million people are “teetering on the very Given the complex mix of challenges before us, it is imperative
edge of famine.” that we tackle all three major drivers of hunger—conflict, climate
The 2021 GHI now adds to this analysis. It tracks key indicators change, and the economic devastation brought on by COVID-19—at
used to measure progress toward Zero Hunger at national, regional, once, going beyond empty promises, half measures, and temporary
and global levels, reflecting multiple dimensions of hunger over time. fixes. Ultimately, conflicts must be resolved through political solutions
It points to a dire hunger situation, a result of the toxic cocktail of and societal change, and international law must be strengthened to
the climate crisis, the COVID-19 pandemic, and increasingly severe ensure accountability for violations to the right to food, including in
and protracted violent conflicts. These forces have slowed or reversed conflict situations. International actors should use their leverage to
previous progress in the fight against hunger. push states toward good governance. We must build resilience into
Against the backdrop of the 2021 United Nations Food Systems our food systems, including through climate adaptation and mitigation.
Summit, this year’s GHI report delves into one of the biggest pol- Most critically, we urgently need greater global solidarity to respond to
icy challenges of 2021: how to deliver meaningful change for and overcome the current pandemic, which will surely not be the last.
the 155 million people considered acutely food insecure and the We have learned in the past few years that human progress is not
10 countries classified by the GHI as alarming or extremely alarming, inevitable. The combination of climate change, COVID-19, and conflict
8 of which are affected by conflict. is taking us back to a world we thought we had left behind. Extreme
Violent conflict is the leading cause of food crises. It affects poverty has risen for the first time in 20 years, and the number of
virtually every aspect of food systems, from production, harvest- people affected by, and at risk of, famine is increasing once more.
ing, processing, and transport to input supply, financing, marketing, But the narrative can still be changed. There is no shortage of
and consumption. Furthermore, in many cases the effects of violent ambition, as expressed in a multiplicity of international agreements
conflict and climate change intersect with each other to exacerbate and summits: not only the UN Food Systems Summit, the Sustainable
communities’ risks and vulnerabilities. The focus of this year’s essay Development Goals, the Paris Agreement on climate change, and
by Caroline Delgado and Dan Smith of the Stockholm International United Nations Security Council Resolution 2417 on conflict and
Peace Research Institute is on the intersection of conflict and hun- hunger, but also the upcoming 2021 Tokyo Nutrition for Growth
ger, and the steps we must take to break the links between the two Summit and the 26th UN Climate Change Conference. It is time to
in order to contribute to a more peaceful and food-secure planet. make good on these aspirations to realize the right to food for all
The authors argue for the integration of a peace-building lens into and leave no one behind.
the creation of resilient food systems and a food and nutrition security
Mathias Mogge Dominic MacSorley
Secretary General Chief Executive Officer
Welthungerhilfe Concern Worldwide
2021 Global Hunger Index | Foreword3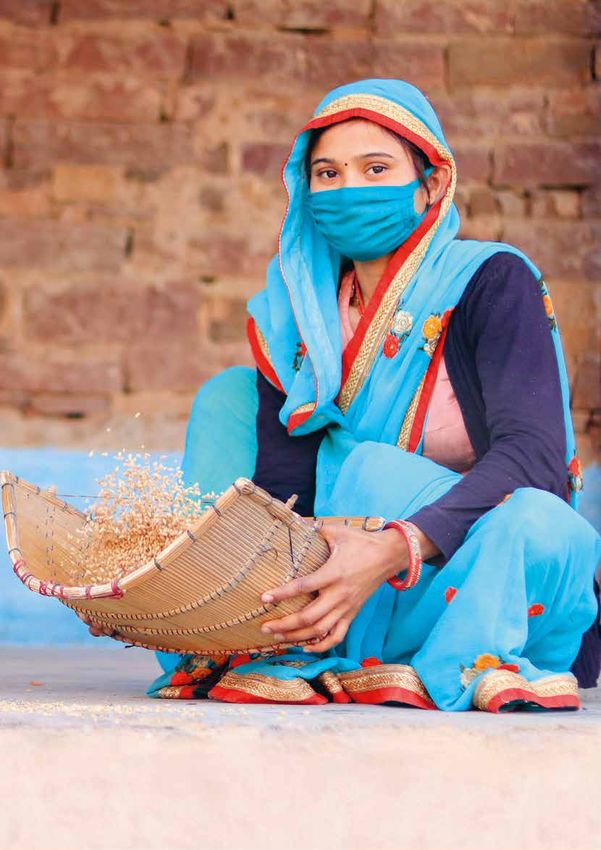
CONTENTS

     Chapter 01                    CHAPTER 02                     CHAPTER 03                  APPENDIXES

SUMMARY                                                                                                                   5

CHAPTERS
01      Global, Regional, and National Trends                                                                             6
02      Hunger and Food Systems in Conflict Settings                                                                     24
03      Policy Recommendations                                                                                           34

APPENDIXES
A       The Concept of the Global Hunger Index                                                                           37
B       Formula for Calculation of Global Hunger Index Scores                                                            40
C       Data Sources for the Global Hunger Index Components, 2000, 2006, 2012, and 2021                                  41
D       Data Underlying the Calculation of the 2000, 2006, 2012, and 2021 Global Hunger Index Scores                     41
E       2000, 2006, 2012, and 2021 Global Hunger Index Scores                                                            44
F       Countries’ 2021 GHI Scores by Region                                                                             45

BIBLIOGRAPHY                                                                                                             49

PARTNERS                                                                                                                 54

4                                                                                        Contents | 2021 Global Hunger Index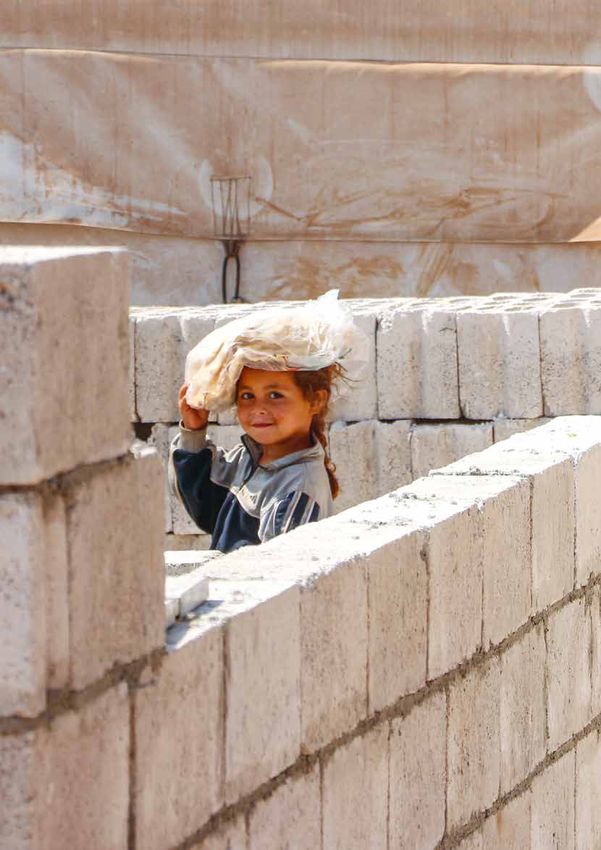
SUMMARY
The 2021 Global Hunger Index (GHI) points to a dire hunger situ- of the Congo, Madagascar, and Yemen—and is provisionally cate-
ation in a world coping with multiple crises. Progress toward Zero gorized as alarming in 4 additional countries—Burundi, Comoros,
Hunger by 2030, already far too slow, is showing signs of stagnating South Sudan, and Syria. Hunger has been identified as serious in
or even being reversed. 31 countries and is provisionally categorized as serious in 6 additional
countries. Since 2012, hunger has increased in 10 countries with
moderate, serious, or alarming hunger levels, in some cases reflect-
The Fight against Hunger Is Dangerously Off Track
ing a stagnation of progress and in others signaling an intensification
Based on current GHI projections, the world as a whole—and of an already precarious situation. Fourteen countries have achieved
47 countries in particular—will fail to achieve a low level of hunger significant improvements in hunger, with a reduction of 25 percent or
by 2030. Conflict, climate change, and the COVID-19 pandemic— more between their 2012 and 2021 GHI scores. However, wide vari-
three of the most powerful and toxic forces driving hunger—threaten ations in children’s nutritional status, even within countries’ borders,
to wipe out any progress that has been made against hunger in recent are pervasive and can be obscured by national averages.
years. Violent conflict, which is deeply intertwined with hunger, shows
no signs of abating. The consequences of climate change are becom-
Violent Conflict Drives Hunger
ing ever more apparent and costly, but the world has developed no
fully effective mechanism to mitigate, much less reverse, it. And The two-way links between hunger and conflict are well established.
the COVID-19 pandemic, which has spiked in different parts of the Violent conflict is destructive to virtually every aspect of a food sys-
world throughout 2020 and 2021, has shown just how vulnerable tem, from production, harvesting, processing, and transport to input
we are to global contagion and the associated health and economic supply, financing, marketing, and consumption. At the same time,
consequences. heightened food insecurity can contribute to violent conflict. Without
resolving food insecurity, it is difficult to build sustainable peace,
and without peace the likelihood of ending global hunger is minimal.
Global Progress Is Slowing, and Hunger Remains
Stubbornly High in Some Regions
Breaking the Links between Conflict and Hunger Can
Evidence shows current setbacks against hunger and suggests trouble
Advance Both Food Security and Peace
ahead. Although GHI scores show that global hunger has been on the
decline since 2000, progress is slowing. While the GHI score for the It is possible to begin to break the destructive links between con-
world fell 4.7 points, from 25.1 to 20.4, between 2006 and 2012, it flict and hunger and to build resilience, even amid conflict and
has fallen just 2.5 points since 2012. After decades of decline, the extreme vulnerability. Working together, actors such as states, com-
global prevalence of undernourishment—one of the four indicators munity groups, local and international nongovernmental organiza-
used to calculate GHI scores—is increasing. This shift may be a har- tions (NGOs), and United Nations agencies can create conditions
binger of reversals in other measures of hunger. In both Africa South for food security and sustainable peace. Effectively integrating a
of the Sahara and South Asia, hunger is considered serious. Africa peace-building lens into the creation of resilient food systems and a
South of the Sahara has the highest rates of undernourishment, child food security lens into peace building will require that external actors
stunting, and child mortality of any region of the world. South Asia’s have a well-grounded knowledge of the context and act with sensitiv-
high hunger level is driven largely by child undernutrition, particularly ity to the realities of ongoing conflicts. It is important to strengthen
as measured by child wasting. In the regions of Europe and Central locally led action and reflect local concerns and aspirations while
Asia, Latin America and the Caribbean, East and Southeast Asia, working through partnerships that bring together diverse actors and
and West Asia and North Africa, hunger levels are low or moderate. their respective knowledge. Funding should be flexible, long term,
and adaptable to fluid fragile and conflict-affected contexts. Finally,
it is crucial to address conflict on a political level and prosecute those
Hunger Remains Serious, Alarming, or Extremely
who use starvation as a weapon of war.
Alarming in Nearly 50 Countries
According to the 2021 GHI, one country, Somalia, suffers from an
extremely alarming level of hunger. Hunger is at alarming levels in
5 countries—Central African Republic, Chad, Democratic Republic
2021 Global Hunger Index | Summary501 Puja Jatav sieves edible grains at a Nutrition Smart Village, a relief initiative that fosters nutrition-sensitive agriculture, in the village of Haripur, India. People have been severely hit by COVID-19 and by pandemic-related restrictions in India, the country with the highest child wasting rate worldwide.
GLOBAL, REGIONAL, AND
NATIONAL TRENDS

Key Messages                                                                                       >   Dozens of countries suffer from severe hunger. According to the
                                                                                                       2021 GHI scores and provisional designations, drawing on data
>   The fight against hunger is dangerously off track. Based on cur-                                   from 2016–2020, hunger is considered extremely alarming in
    rent GHI projections, the world as a whole—and 47 countries                                        one country (Somalia), alarming in 9 countries, and serious in
    in particular—will fail to achieve a low level of hunger by 2030.                                  37 countries.

>   Food security is under assault on multiple fronts. Worsening con-                              >   Inequality—between regions, countries, districts, and communi-
    flict, weather extremes associated with global climate change, and                                 ties—is pervasive and, left unchecked, will keep the world from
    the economic and health challenges associated with the COVID-                                      achieving the Sustainable Development Goal (SDG) mandate to
    19 pandemic are all driving hunger.                                                                “leave no one behind.”

>   After decades of decline, the global prevalence of undernourish-                              It is difficult to be optimistic about hunger in 2021. The forces now
    ment—a component of the Global Hunger Index—is increasing.                                    driving hunger are overpowering good intentions and lofty goals.
    This shift may be a leading indicator of reversals in other mea-                              Among the most powerful and toxic of these forces are conflict, cli-
    sures of hunger.                                                                              mate change, and COVID-19—three Cs that threaten to wipe out any
                                                                                                  progress that has been made against hunger in recent years. Violent
>   Africa South of the Sahara and South Asia are the world regions                               conflict, which is deeply intertwined with hunger, shows no signs
    where hunger levels are highest. Hunger in both regions is con-                               of abating. The consequences of climate change are becoming ever
    sidered serious.                                                                              more apparent (Masson-Delmotte et al. 2021) and costly, but the
                                                                                                  world has developed no fully effective mechanism to slow, much less

     BOX 1.1 ABOUT THE GLOBAL HUNGER INDEX SCORES
     The Global Hunger Index (GHI) is a tool for comprehensively                                       (child wasting and child stunting data are from UNICEF,
     measuring and tracking hunger at global, regional, and national                                   the World Health Organization, the World Bank, and the
     levels. GHI scores are based on the values of four component                                      Demographic and Health Surveys Program)
     indicators:
                                                                                                   >   child mortality—the mortality rate of children under age five,
      >   undernourishment—the share of the population with insuf-                                     partly reflecting the fatal mix of inadequate nutrition and
          ficient caloric intake (data are from the UN Food and                                        unhealthy environments (data are from the United Nations
          Agriculture Organization)                                                                    Inter-agency Group for Child Mortality Estimation).

      >   child wasting—the share of children under age five who have                             Based on the values of the four indicators, the GHI determines
          low weight for their height, reflecting acute undernutrition                            hunger on a 100-point scale, where 0 is the best possible score
                                                                                                  (no hunger) and 100 is the worst. Each country’s GHI score is
      >   child stunting—the share of children under age five who have                            classified by severity, from low to extremely alarming. The 2021
          low height for their age, reflecting chronic undernutrition                             GHI scores include data from 2016–2020.

                                                                                GHI Severity Scale
                ≤ 9.9                      10.0–19.9                            20.0–34.9                                     35.0–49.9                              ≥ 50.0
                 low                       moderate                              serious                                       alarming                        extremely alarming

    0                            10                            20                                            35                                           50
     Note: GHI scores are comparable only within each year’s report, not between different years’ reports. To allow for tracking of a country’s or region’s GHI performance over time, this
     report provides GHI scores for 2000, 2006, and 2012, which can be compared with 2021 GHI scores. For a detailed explanation of the concept of the GHI, the date ranges and
     calculation of the scores, and the interpretation of results, see Appendixes A and B.

2021 Global Hunger Index | Chapter 01 | Global, Regional, and National Trends7
reverse, it (Raiser et al. 2020). And the COVID-19 pandemic, which FIGURE 1.1 WORLD GHI SCORES AND PREVALENCE OF
has spiked in different parts of the world throughout 2020 and 2021, UNDERNOURISHMENT IN RECENT DECADES
has shown just how vulnerable we are to global contagion and the 30 28.0
associated health and economic consequences. As we struggle to
25.1 GHI scores
contain the current pandemic, we must be realistic that this will not 25 Undernourishment (%)
be the last. As a result of these forces—as well as a host of underly- 20.4
ing factors such as poverty, inequality, unsustainable food systems, 20
17.9
lack of investment in agriculture and rural development, inadequate
safety nets, and poor governance—progress in the fight against 15
hunger shows signs of stalling and even being reversed. It is in this
dire context that the hunger situation is playing out in the world as 10
a whole, in global regions, and in individual countries.
5
The World
0
The fight against hunger is dangerously off track. Based on current
1998
2000
2002
2004
2006
2008
2010
2012
2014
2016
2018
2020
GHI projections, the world as a whole—and 47 countries in particu-
lar—will not achieve a low level of hunger by 2030.1 Of these coun- Note: GHI scores for the year 2000 include data from 1998–2002; 2006 GHI scores include
data from 2004–2008; 2012 GHI scores include data from 2010–2014; and 2021 GHI
tries, 28 are located in Africa South of the Sahara, with the remaining scores include data from 2016–2020. Data on undernourishment are from FAO (2021). The
undernourishment values include data from high-income countries with low levels of hunger,
countries spread between South Asia, West Asia and North Africa,
which are excluded from the GHI. For a complete list of data sources for the calculation of
East and Southeast Asia, and Latin America and the Caribbean. GHI scores, see Appendix C.
Recent projections by the Food and Agriculture Organization of the
United Nations (FAO) support these findings: taking into account world fell 4.7 points, from 25.1 to 20.4, between 2006 and 2012,
the effects of the COVID-19 pandemic, 657 million people (nearly it has fallen just 2.5 points since 2012. The latest data on the prev-
8 percent of the world population) are projected to be undernourished alence of undernourishment—one of the four indicators used to
in 2030—approximately 30 million more than if the pandemic had calculate GHI scores—reveal a slight rise beginning in 2018 and a
not occurred (FAO, IFAD et al. 2021). Likewise, the world is not on marked increase in 2020 (FAO, IFAD et al. 2021; Figure 1.1).2 Data
track to meet the Sustainable Development Goals (SDGs) on child on undernourishment may be a leading indicator of a broader rever-
nutrition. Only 25 percent of all countries are on track to meet the sal of progress against hunger.
goal of halving the number of children affected by stunting by 2030,
and just 28 percent of countries are on track to meet the goal of Conflict continues to be a primary driver of hunger (see Box 1.4
reducing childhood wasting to less than 3 percent and maintaining it and Chapter 2). More than half of the people facing undernourishment
at this level (UNICEF, WHO, and World Bank 2021b). The latest pro- live in countries affected by conflict, violence, or fragility (FAO, IFAD
jections on child mortality show that 53 countries need to accelerate et al. 2021). Of the 155 million people in a situation of acute food
progress if they are to achieve the SDG target of reducing under-five crisis, emergency, or catastrophe in 2020, conflict was the primary
mortality rates to 2.5 percent or less by 2030 (UN IGME 2020b). driver of hunger for 99.1 million people in 23 countries (FSIN and
GNAFC 2021).3 Conflict is a consistent predictor of child malnutri-
Evidence shows current setbacks against hunger and suggests tion, particularly as measured by child stunting (Brown et al. 2020).
trouble ahead. Although GHI scores show that global hunger has been Conflict also increases child mortality directly through injuries and
on the decline since 2000, coinciding with a decline in extreme pov-
erty in that period, progress is slowing. While the GHI score for the
2 Of the data used to calculate the GHI scores in this year’s report, the effects of the COVID-19
pandemic are reflected only in the data on the prevalence of undernourishment, made pos-
sible by FAO’s “nowcast” methodology. The data on child stunting and child wasting largely
1 The 2030 projections are linear projections based on the existing 2000, 2006, 2012, and do not yet reflect the pandemic’s effects because of obstacles to collecting household survey
2021 GHI scores for each country, and only countries with sufficient data for the calculation data in the context of physical distancing policies. At the time of this report’s completion, the
of these scores were included in the analysis. These projections are not comparable to pro- latest published data on child mortality from the UN Inter-agency Group for Child Mortality
jections from previous reports owing to changes in data availability and revisions of existing Estimation were from 2019.
data. For example, last year’s report had 2020 GHI scores for 107 countries, whereas this 3
These data on food insecurity are based on the Integrated Food Security Phase Classification
year’s report has 2021 GHI scores for 116. (IPC) system, as reported in the Global Report on Food Crises (FSIN and GNAFC 2021).
8 Global, Regional, and National Trends | Chapter 01 | 2021 Global Hunger Indextrauma and indirectly through diarrhea, measles, malaria, lower respi- beyond the currently anticipated funding levels (Sulser et al. 2021).
ratory tract infections, and malnutrition associated with poor living Climate change mitigation and adaptation require strong political will
conditions and damaged health care infrastructure (Kadir et al. 2018). and compliance with climate agreements.
Climate change is already increasing food insecurity through The COVID-19 pandemic is worsening food security, with the full
higher temperatures, changing precipitation patterns, and more fre- scope of the impacts still not fully known. The pandemic is increas-
quent extreme weather events, and the negative effects are wide- ing food insecurity in various ways, including through lost income
spread, rapid, and intensifying (Mbow et al. 2019; Masson-Delmotte caused by infection, quarantine, or government-imposed lockdowns or
et al. 2021). Hunger levels are significantly higher in countries that movement restrictions, disruptions to food systems or food supplies,
are most sensitive to the rainfall and temperature extremes charac- and increases in food prices caused by these disruptions (Amare et
teristic of climate change, particularly in economies highly dependent al. 2021). The restrictions implemented to save lives and prevent
on agriculture (FAO, IFAD et al. 2021). A recent analysis shows that the collapse of medical care resulted in a deep shock to the global
climate change could increase the number of chronically hungry peo- economy. Owing in part to the economic impact of the pandemic,
ple in 2050 by 78 million relative to a situation without the current the number of people experiencing acute food insecurity increased
climate crisis. Investment in agricultural research and development, by nearly 20 million in 2020 compared with the previous year, and
water management, and rural infrastructure could offset this increase economic shocks were a more significant driver of acute food inse-
in hunger, but this would require an additional US$25.5 billion a year curity in 2020 than in 2019 (FSIN and GNAFC 2021). Another
BOX 1.2 COVID-19 AND NUTRITION: WHAT WE KNOW SO FAR
The pandemic is worsening malnutrition not only through food The effects of the pandemic on child malnutrition have not
insecurity but also through reductions in health care use, immu- yet been comprehensively measured given barriers to collecting
nization, treatment of malnutrition, and antenatal care. A 2020 anthropometric data, but estimates suggest sizable impacts.
survey showed that pandemic-induced disruptions to health An estimate of the pandemic’s impact on economic, food,
care services were widespread. Approximately half of the sur- and health systems suggests that there could be an additional
veyed countries reported partial or severe disruptions to ser- 9.3 million wasted children and 2.6 million stunted children in
vices designed to manage malnutrition. Sixty to 70 percent of 2020–2022 in low- and middle-income countries compared
countries reported disruptions to routine immunization services with pre-pandemic expectations (Osendarp et al. 2021). The
(WHO 2020). A survey of households in 25 countries found that regions of the world expected to be most heavily impacted are
at least one-third of respondents reported delaying, skipping, or those where child undernutrition is already most severe, includ-
being unable to complete essential health care visits since the ing Africa South of the Sahara and South Asia (Ntambara and
start of the COVID-19 pandemic (Alliance2015 2021). Sickness Chu 2021).
and infection contribute to malnutrition, and while it is difficult Child mortality is predicted to increase as a result of the
to assess the impact of vaccination services on child stunting, pandemic, primarily due to the indirect effects of COVID-19.
wasting, and underweight, vaccination is considered an import- Disruptions to reproductive, maternal, newborn, child, and ado-
ant component of malnutrition prevention (Prendergast 2015). lescent health services, which have occurred in most countries
Antenatal care was found to be at least partially disrupted in as a result of the pandemic, have been shown to increase mor-
56 percent of surveyed countries (WHO 2020). This disruption tality among children under age five (WHO 2020). Increases
may have profound implications for children’s nutritional sta- in child wasting and declines in nutrition intervention coverage
tus given that antenatal care has been shown to significantly associated with the pandemic could lead to between 47,000
decrease the probability of low birth weight, child stunting, and and 283,000 additional child deaths between 2020 and 2022
child underweight in low- and middle-income countries (Kuhnt in low- and middle-income countries (Osendarp et al. 2021).
and Vollmer 2017). The wide range reflects the ongoing uncertainty of the situation,
which is without precedent in modern times.
2021 Global Hunger Index | Chapter 01 | Global, Regional, and National Trends9recent study found that the pandemic exacerbated food insecurity Africa South of the Sahara has the highest rates of undernour-
in many areas of the world, in part because reduced incomes led ishment, child stunting, and child mortality of any region of the
to decreased food affordability and ultimately reduced food choice world. Of major concern is its rising undernourishment rate, which
and diversity (Béné et al. 2021). Projections and evidence to date increased from 19.6 percent in 2014–2016 to 21.8 percent in 2018–
also suggest that the pandemic worsened child mortality and vari- 2020 (FAO 2021). While available data suggest child stunting is still
ous forms of malnutrition through multiple channels (see Box 1.2). declining slowly in the region, from 34.8 percent in 2015 to 32.4 in
Given the vast inequality in vaccine access between countries and 2020, nearly one-third of children are still stunted, or too short for
regions, the poorest will likely continue to bear a disproportionate their age, indicating chronic undernutrition (UNICEF, WHO, and World
brunt of the pandemic into the future. Bank 2021a). Perhaps most troubling, Africa is the one world region
predicted to experience an increase in the number of undernourished
people between now and 2030, when its undernourished population is
The Regions
expected to be on par with that of Asia (FAO, IFAD et al. 2021). Each
Africa South of the Sahara and South Asia are the world regions with of the major drivers of hunger is imposing extraordinary challenges on
the highest hunger levels, with GHI scores of 27.1 and 26.1, respec- the region. As mentioned, climate change is projected to push an addi-
tively (Figure 1.2). These hunger levels are considered serious, and tional 78 million people globally into hunger in 2030 relative to projec-
contrast with those of Europe and Central Asia, Latin America and tions without the climate crisis, and more than half of this burden is
the Caribbean, East and Southeast Asia, and West Asia and North expected to be experienced in Africa South of the Sahara (Sulser et al.
Africa, each of which has a GHI score in the low or moderate range. 2021). The long-term effects of the COVID-19 pandemic are expected
Africa South of the Sahara’s 2000 GHI score was substantially higher to include 30 million more people undernourished globally in 2030
than South Asia’s, and at that time six out of the seven countries in than would otherwise be the case, again with more than half of these
the world with extremely alarming hunger levels were in Africa South expected in Africa South of the Sahara (FAO, IFAD et al. 2021). And
of the Sahara. However, between 2000 and 2006, Africa South of while projections of the impact of conflict on hunger in 2030 are not
the Sahara achieved improvements in each of the GHI indicators, available, the level of conflict in the region is high and the situation is
while in South Asia the prevalence of undernourishment stagnated not improving: as of 2019 Africa had the highest number of children
and the child wasting rate rose, putting these two regions on a similar living in a conflict zone of any region, and it was the only region in the
footing. The 2006, 2012, and 2021 GHI scores for the two regions, world that did not experience a decrease in political violence between
and their rate of decrease since 2006, are comparable. 2019 and 2020 (Save the Children 2020; ACLED 2021a).
FIGURE 1.2 REGIONAL 2000, 2006, 2012, AND 2021 GLOBAL HUNGER INDEX SCORES, WITH CONTRIBUTION OF COMPONENTS
FIGURE 1.2 REGIONAL 2000, 2006, 2012, AND 2021 GLOBAL HUNGER INDEX SCORES, WITH CONTRIBUTION OF COMPONENTS
Under-five mortality rate
50
42.5
Prevalence of wasting in children
38.1
Prevalence of stunting in children
35.9
36.2
40
Proportion of undernourished
30.5
GHI score
29.2
27.1
26.1
30
18.4
16.1
15.2
20
14.3
14.1
13.5
13.2
12.7
10.8
11.0
9.5
8.7
8.5
8.5
7.6
10
6.5
0
'00 '06 '12 '21 '00 '06 '12 '21 '00 '06 '12 '21 '00 '06 '12 '21 '00 '06 '12 '21 '00 '06 '12 '21
Africa South South Asia West Asia & Latin America & East & Europe &
of the Sahara North Africa Caribbean Southeast Asia Central Asia
Source:
Source: Authors.
Authors.
Note:
Note: See
See Appendix
Appendix C C for
for data
data sources.
sources. The
The regional
regional GHI
GHI scores
scores are
are calculated
calculated using
using regional
regional aggregates
aggregates for
for each
each indicator
indicator and
and the
the formula
formula described
described in
in Appendix
Appendix B.
B. The
The regional
regional aggregates
aggregates for
for
each
each indicator
indicator are
are calculated
calculated as
as population-weighted
population-weighted averages,
averages, using
using the
the indicator
indicator values
values reported
reported in
in Appendix
Appendix D.
D. For
For countries
countries lacking
lacking undernourishment
undernourishment data,
data, provisional
provisional estimates
estimates provided
provided by
by
the Food and Agriculture Organization of the United Nations (FAO) were used in the calculation of aggregates only, but are not reported in Appendix D. Appendix F indicates which countries
the Food and Agriculture Organization of the United Nations (FAO) were used in the calculation of aggregates only, but are not reported in Appendix D. Appendix F indicates which countries are are
included in each region.
included in each region.
10 Global, Regional, and National Trends | Chapter 01 | 2021 Global Hunger IndexSouth Asia’s high regional hunger level is driven largely by East and Southeast Asia’s 2021 GHI score is low and declining
child undernutrition, particularly as measured by child wasting. At over time, yet further dissection reveals worrying subregional inequal-
14.7 percent, South Asia’s child wasting rate as of 2020 is the high- ity. The child nutrition situation in East Asia is much better than in
est of any world region. The next-highest values belong to Africa Southeast Asia. For example, child wasting in 2020 was 8.2 percent
South of the Sahara, with 6.2 percent, and West Asia and North in Southeast Asia and just 1.7 percent in East Asia. Likewise, child
Africa, with 6.3 percent—these rates are problematic but dramat- stunting was 27.4 percent in Southeast Asia compared with just
ically lower than that of South Asia. Meanwhile, South Asia’s child 4.9 percent in East Asia (UNICEF, WHO, and World Bank 2021a).
stunting rate, at 31.8 percent, is nearly as high as that of Africa While regional groupings are useful for considering broad trends, this
South of the Sahara. More than half of the children in the world kind of disaggregation at the subregional level is also critical, as is
who experience wasting and more than one-third of the children disaggregation at the country and subnational levels.
who experience stunting are located in South Asia (UNICEF, WHO,
and World Bank 2021a). A recent analysis found that South Asian Europe and Central Asia has the lowest 2021 GHI score of any
mothers with no education and those with short stature were most region, at 6.5, down from 7.6 in 2012. While it fares relatively well on
likely to have stunted children (Wali, Agho, and Renzaho 2020). This the GHI indicators, Europe and Central Asia is a transitional region,
hints at a deeper explanation of South Asia’s persistent undernu- with a still tenuous food security status. Eastern Europe’s prevalence
trition—gender inequality. Women in South Asia face inequality in of moderate or severe food insecurity—an alternative measure of food
multiple realms, including social structures, the workplace, health insecurity developed by FAO4 —increased from 10.4 percent in 2019
and nutrition, and overall safety. These disadvantages in turn con- to 14.8 percent in 2020. Meanwhile, Central Asia’s prevalence of
tribute to food and nutrition insecurity not only for women but also moderate or severe food insecurity rose from 13.2 to 18.0 percent
for their children (Rao 2020). in this period (FAO 2021). These increases reflect the pressure that
the COVID-19 pandemic and associated lockdowns have put on these
West Asia and North Africa, with a moderate 2021 GHI score populations and show the need for strong safety net programs during
of 12.7, has yet to achieve a low level of hunger. The prevalence downturns and crises, even in regions with relatively low hunger.
of undernourishment in the region has seen an upward trend from
8.0 percent in 2007–2009 to 10.9 percent in 2018–2020 (FAO
2021). The region’s 2020 child stunting rate, at 15.6 percent, and
its 2020 child wasting rate, at 6.3 percent, are considered to be of
moderate public health concern/significance (UNICEF, WHO, and
World Bank 2021a; de Onis et al. 2019). The GHI score for the region
is driven up by Yemen, which has an alarming 2021 GHI score of
45.1, and Iraq, which has a serious 2021 GHI score of 22.8. The
populations of these two countries, both of which are in the midst
of or have been engaged in violent conflict in recent years, consti-
tute roughly 15 percent of the population of the region as a whole.
Latin America and the Caribbean, whose 2021 GHI score is cat-
egorized as low, is the only region with an increase in its GHI score
since 2012. This very small increase, from a 2012 GHI score of 8.5
to a 2021 GHI score of 8.7, can be traced back to a problematic trend
of rising undernourishment. After years of decline, the region’s preva-
lence of undernourishment increased from 5.7 percent in 2013–2015
to 7.7 percent in 2018–2020 (FAO 2021). Its child undernutrition
and child mortality values are declining slowly, but without substan-
tial, sustained efforts to support children’s nutrition and health, the
4 The prevalence of moderate or severe food insecurity is based on the Food Insecurity Experience
increased prevalence of undernourishment may translate into worse
Scale, an experience-based food security scale used to produce a measure of access to food
outcomes for children. at different levels of severity that can be compared across contexts (FAO, IFAD et al. 2021).
2021 Global Hunger Index | Chapter 01 | Global, Regional, and National Trends11The Countries ports, and a near cessation in payment of government salaries, affect-
ing up to 30 percent of households. These factors have created a
According to the 2021 GHI, of the 116 countries with sufficient data food security crisis in Yemen (Tandon and Vishwanath 2020). In
to calculate the latest GHI scores, one country, Somalia, suffers from 2021, according to the World Food Programme, more than 5 million
an extremely alarming level of hunger, 5 have levels of hunger that are Yemenis are on the verge of famine and tens of thousands of Yemenis
alarming—Central African Republic, Chad, Democratic Republic of already face famine-like conditions (WFP 2021e).
the Congo, Madagascar, and Yemen—and 31 countries have serious
levels of hunger. There are many more countries where the hunger At 43.0, considered alarming, Central African Republic (CAR) has
situation may be just as concerning, but data gaps prevent calculation the third-highest 2021 GHI score of the countries with sufficient data
of their exact GHI scores. Of these, hunger is provisionally categorized for inclusion in the ranking. The prevalence of undernourishment in
as alarming in four additional countries—Burundi, Comoros, South CAR is 48.2 percent, meaning nearly half of the population lacks
Sudan, and Syria—and serious in six additional countries—Guinea, access to sufficient calories on a regular basis. Forty percent of chil-
Guinea-Bissau, Niger, Uganda, Zambia, and Zimbabwe (Box 1.3). 5 dren are stunted, 5.3 percent of children are wasted, and 11.0 percent
of children die before reaching the age of five. CAR has been engaged
Somalia has the highest level of hunger according to the 2021 in a civil war since 2013, and although a peace deal was signed in
GHI ranking—its GHI score of 50.8 is considered extremely alarming. 2019, the situation is still fragile and volatile, with renewed violence
At 59.5 percent, Somalia’s 2018–2020 prevalence of undernourish- by rebel groups posing a threat to the country (Semba 2021). The
ment was the highest of any country with available data. (The value main drivers of food insecurity in CAR are violence and civil insecurity
for the next-highest country, Central African Republic, was more and the associated displacement of the population; market disruption
than 10 percentage points lower, at 48.2 percent.) In recent years, caused by the COVID-19 pandemic, worsened by supply chain block-
Somalia has faced multiple crises that have increased food insecu- ages perpetrated by armed groups; and low agricultural production,
rity, including droughts, floods, desert locusts, and the effects of the itself exacerbated by instability in the country (IPC 2021a).
COVID-19 pandemic beginning in 2020 (Riddell 2020). The coun-
try has been in a state of conflict for the past 30 years, and though Chad has the fourth-highest 2021 GHI score in this report—39.6,
fighting has eased somewhat in recent years, it is considered a frag- which is considered alarming. Although Chad’s GHI score has
ile state and is vulnerable to multiple militias vying for power (Day declined relative to 2012, the most recent historical reference year
2020). After enduring a devastating famine that killed approximately for GHI scores in this report, the prevalence of undernourishment
260,000 people in 2011, Somalia faced the threat of famine again rose between 2014–2016 and 2018–2020. Chad’s current preva-
in 2017 and 2018, which was averted by an effective response by lence of undernourishment, at 31.7 percent, indicates that nearly
international organizations, the Somali government, and civil society one-third of the population lacks regular access to sufficient calories.
(Clayton, Abdi Ibrahim, and Yusuf 2019; WFP 2021b). Surveys conducted in 2019 show that child undernutrition is a major
concern: Chad’s child stunting rate, at 35.1 percent, is considered
Yemen, with the second-highest 2021 GHI score at 45.1, faces very high in terms of public health significance, and its child wast-
an alarming level of hunger and the threat of famine in 2021. All of ing rate, at 13.0 percent, is considered high (de Onis et al. 2019).6
Yemen’s GHI indicators are concerning, with a prevalence of under- With an under-five mortality rate of 11.4 percent, it is one of the few
nourishment of 45.4 percent, a child stunting rate estimated at countries in the world where more than 1 in 10 children die before
51.4 percent, a child wasting rate estimated at 15.1 percent, and age five. Food insecurity in Chad is driven by conflict, insecurity,
a mortality rate for children under age five of 5.8 percent. Since and weather extremes, exacerbated by the impact of the COVID-19
2014/2015 Yemen has been engulfed in a civil war characterized pandemic. Chad hosts approximately half a million refugees—mainly
by escalating violence, restrictions on imports through the country’s from Sudan and Central African Republic—for whom food insecurity
is a major concern (FSIN and GNAFC 2021).
5
There are several resources within this report to assess how countries fare over time, rela-
tive to other countries, and according to multiple indicators. To understand how the countries
included in the GHI compare with each other, Table 1.1 shows the numerical ranking, from
lowest to highest hunger levels, for each country with a 2021 GHI score. Appendix F shows
the 2021 GHI scores, from highest to lowest, within each region to allow for an assessment of
countries’ hunger status relative to nearby countries. Appendix D shows the values of the GHI
indicators—the prevalence of undernourishment, child wasting, child stunting, and child mor-
tality—for each country, including their historic values. 6
Values are averages of stunting values and wasting values from the two surveys.
12 Global, Regional, and National Trends | Chapter 01 | 2021 Global Hunger IndexTABLE 1.1 GLOBAL HUNGER INDEX SCORES BY 2021 GHI RANK
Rank1 Country 2000 2006 2012 2021 Rank1 Country 2000 2006 2012 2021
BelarusBOX 1.3 ASSESSING THE SEVERITY OF HUNGER IN COUNTRIES WITH INCOMPLETE DATA
In this year’s GHI report, 19 countries that met the criteria for undernutrition (see Box 1.4 and Chapter 2). The countries with
inclusion in the GHI had insufficient data to allow for calculation missing data may often be those facing the greatest hunger bur-
of a 2021 GHI score. To address this gap and give a prelimi- dens. Of the 4 countries provisionally designated as alarming—
nary picture of hunger in the countries with missing data, the Burundi, Comoros, South Sudan, and Syrian Arab Republic—it
table below indicates provisional designations of the severity of is possible that with complete data, one or more of them would
hunger. These designations are based on those GHI indicator fall into the extremely alarming category. However, without suf-
values that are available, the country’s last known GHI severity ficient information to confirm that this is the case, we have
designation, the country’s last known prevalence of undernour- conservatively categorized each of these countries as alarming.
ishment, the prevalence of undernourishment for the subregion
7
7
in which the country is located, and/or an examination of the Previously published undernourishment values, GHI scores, and GHI severity classifi-
cations are not considered valid once superseding reports have been issued, but were
2019, 2020, and 2021 editions of the Global Report on Food used as benchmarks to consider the plausibility of a country falling into a broad range
of undernourishment values and GHI scores.
Crises (FSIN 2019; FSIN and GNAFC 2020, 2021).8 8
The Global Reports on Food Crises report on acute food insecurity, which is different
In some cases, data are missing because of violent con- from chronic hunger as measured by the prevalence of undernourishment. However, the
2019, 2020, and 2021 GRFCs were used to confirm whether a country experienced
flict or political unrest (FAO, IFAD et al. 2017; Martin-Shields
extreme hunger crises such as famine, threat of famine, and/or repeated hunger crises
and Stojetz 2019), which are strong predictors of hunger and in 2018, 2019, and 2020.
PROVISIONAL HUNGER SEVERITY DESIGNATIONS AND EXISTING DATA FOR COUNTRIES WITH INCOMPLETE DATA
Subregional Range of prevalence
Provisional 2021 Child stunting, Child wasting, Child mortality, Last prevalence of
Last GHI prevalence of of undernourishment
Country GHI severity 2016–2020 2016–2020 2019 undernourishment
categorization undernourishment values for provisional
designation (%) (%) (%) value (%)
(%) designation (%)
Moldova Low 5.4* 2.7* 1.4 Low (2017) 8.5 (2017)With a 2021 GHI score of 39.0, Democratic Republic of the The status of each of the GHI indicators (the prevalence of under-
Congo (DRC) also faces an alarming level of hunger. Food insecurity nourishment, child stunting, child wasting, and child mortality)
is driven by ongoing conflict, large-scale population displacement, provides insight into the particular nature of hunger in each coun-
low household purchasing power, and damage to crops from pests, try (see Figure 1.3 and Appendix D). For example, Haiti, with a GHI
and has been exacerbated by the measures taken to contain the score of 32.8, has the third-highest prevalence of undernourishment
COVID-19 pandemic (FSIN and GNAFC 2021). Although DRC expe- of any country in this year’s GHI report, yet more than 50 countries
rienced its first peaceful transition of presidential power in 2019, have higher stunting rates and more than 70 countries have higher
it still faces steep challenges along the path to development (IFAD wasting rates. Despite Haiti’s moderate child stunting and child wast-
2019). The security situation worsened in several eastern provinces ing values relative to other countries, other indicators of child nutri-
in 2020. Violence has led to high levels of displacement: at the end tion such as child anemia rates and the percentage of children who
of 2020, 5.3 million people were displaced within the country—the receive appropriate diets reveal that child undernutrition is nonethe-
highest level in Africa (IDMC 2021). In the latter half of 2020, the less a major challenge in Haiti (IHE and ICF 2018). Timor-Leste, by
combination of DRC’s large population and widespread food insecu- contrast, has the second-highest child stunting rate in this report,
rity led to the largest food crisis in the world in terms of the number yet 21 countries have prevalence of undernourishment values that
of affected people (FSIN and GNAFC 2021). exceed Timor-Leste’s rate of 22.6 percent. To address its child nutri-
tion challenges, Timor-Leste must tackle underlying issues by increas-
Madagascar is the only country with an alarming 2021 GHI score ing dietary diversity and consumption of nutritious foods; improving
(36.3) that is not experiencing conflict.9 The country’s food insecu- the water, sanitation, and hygiene (WASH) environment; empowering
rity is driven by consecutive years of drought brought on by global women; and scaling up community-based management of acute mal-
climate change, which is pushing areas in the south of the country nutrition programming (Bonis-Profumo, McLaren, and Fanzo 2019).
to the brink of famine in 2021 (WFP 2021a,c). Its undernourishment
rate, at 43.2 percent, is one of the five highest rates for 2018–2020 There are several success stories of countries that have reduced
and has been steadily increasing since 2010–2012, when it was as hunger substantially over recent years and decades (Figure 1.4).
low as 28.3 percent (FAO 2021). Fourteen countries have seen a 25 percent reduction or more between
their 2012 and 2021 GHI scores. For example, Bangladesh has
Despite committing to the goal of achieving Zero Hunger by experienced an impressive decline in GHI scores since 2012, drop-
2030, too many countries are still experiencing increasing hunger. ping from 28.6 points, considered serious, to 19.1 points, consid-
According to the GHI, hunger has increased in 10 countries with ered moderate. Its child stunting rate fell substantially in recent
moderate, serious, or alarming hunger levels since 2012, the latest decades, from 51.1 percent in 2000 to 28.0 percent in 2019. These
historical reference year in this year’s report. These 10 are Central improvements are underpinned by the government’s firm commit-
African Republic, Republic of Congo, Ecuador, Lesotho, Madagascar, ment, determination, and action to tackle malnutrition as part of the
Malaysia, Oman, South Africa, Venezuela, and Yemen. In the case of country’s path toward developed-country status by 2041 (Haddad
several of these countries with moderate 2021 GHI scores, this result and Khondker 2020). Mongolia has decreased its GHI score by over
indicates a stagnation of progress along the path toward low hunger 50 percent between its 2012 and 2021 scores, falling to a 2021 GHI
or Zero Hunger. Ecuador and South Africa, for example, experienced score of 6.1, considered low. However, as a result of the COVID-19
substantial declines in hunger between 2000 and 2012, only to see pandemic, household food insecurity is increasing, forcing house-
their progress halted and partially reversed according to their 2021 holds to reduce the quality and quantity of food they consume (FAO,
scores. For those countries with alarming levels of hunger that are UNICEF et al. 2021). When data are available on the impact of the
experiencing rising hunger—Central African Republic, Madagascar, pandemic on child stunting, child wasting, and child mortality, and
and Yemen—these increases represent intensification of already as data on the prevalence of undernourishment increasingly show
dangerous situations. the effects of the pandemic, it will be important to consider these
effects on the progress of Mongolia and other countries that have
experienced recent gains.
9 Comoros—which lacks sufficient data for the calculation of a 2021 GHI score but is provision-
ally categorized as having an alarming hunger level—is also not experiencing conflict.
2021 Global Hunger Index | Chapter 01 | Global, Regional, and National Trends15FIGURE 1.3 WHERE THE INDICATORS OF HUNGER ARE HIGHEST The GHI is best suited to measure hunger over recent years and
decades, while other tools are better suited to real-time assessments
Undernourishment (%) 2018–2020 and short-term projections of hunger. These tools show that the most
60 59.5
severe hunger crises in 2021 are occurring in Ethiopia, Yemen, South
50 48.2 46.8 45.4
43.2 42.4 41.7
Sudan, and Nigeria (FEWS NET 2021).10 Measures of acute food
40 38.9 37.7 37.5
insecurity, from sources such as the Integrated Food Security Phase
30
Classification (IPC) and the Famine Early Warning Systems Network
20 (FEWS NET), and longer-term measures of hunger, such as the GHI,
10 complement each other. The former allow for the identification of
0 crises and the pinpointing of immediate needs, while the latter show
ric C a
p. l
ti
en
r
a
ria
o
q
ng of
Re tra
ca
trends in hunger and undernutrition over time.
i
re
ng
Ira
ai
al
m
be
o
Co .
as
o
H
an en
m
Co
e ep
K
Ye
Li
ag
So
th . R
R
of
ad
DP
m
p.
M
De
Re
Af
Within Country Borders
Child stunting (%) 2016–2020
60 54.0 52.2 51.4 Inequality of child nutrition is pervasive, and children are suffering
50 47.1
41.8 41.6 40.9 40.0 39.7 39.5 from inadequate diets and suboptimal health in all corners of the
40
world. Figure 1.5 illustrates the within-country disparities in child
30
stunting among children under the age of five in 74 countries. For
20
each country with available data, this figure shows the stunting rates
10
for the states or areas with the highest and lowest stunting levels, as
0
well as the national average—the longer the black line, the wider the
te
en
a
i
er
M ngo of
r
i ew
Pa ep. l
i
nd
ca
al
R a
aw
es
ig
disparity in stunting rates within the country. In addition to inequality
r
m
Gu nea
Co .
em
Gu a N
t
as
ru
e ep
an en
al
N
-L
Ye
Bu
ag
M
at
or
th . R
ric C
pu
ad
m
in nutrition and health, the size of the within-country gap in stunt-
m
Ti
De
Af
ing levels results from several factors, such as the number of states
Child wasting (%) 2016–2020 or provinces into which a country is split for the sake of the survey,
18 17.3
16 15.7 15.1 15.1 the national population size and land area, and the average national
14 13.1 13.0 12.6 12.0
stunting level. Even within countries on the low end of the stunting
12 11.5 11.5
10
range, such as Cuba and Turkey, stunting levels in some areas are
8 near 20 percent.
6
4
2 Subnational child wasting data reveal countries where moder-
0 ate national averages obscure high or very high levels of acute child
a
ti
ka
en
ia
ad
n
al
ia
te
undernutrition. In Cameroon, for example, the 2018–2019 child
di
da
ou
al
ep
an
es
an
m
Ch
In
m
Su
ib
-L
N
rit
Ye
iL
So
Dj
or
au
Sr
wasting rate averaged 4.3 percent nationally but reached 10 percent
m
M
Ti
in the regions of Extrême-Nord and Adamaoua (both in the coun-
11.7 11.7 Child mortality (%) 2019
12 11.4 11.0 10.9 try’s north). By contrast, the regions of Sud-Ouest and Ouest had
9.9 9.6
10 9.4 9.0 child wasting rates of less than 1 percent (WHO 2021). The northern
8.8
8 areas of the country have higher levels of poverty, are more affected
6 by conflict, receive more refugees from neighboring countries, and
4 are more vulnerable to climate change than other parts of the coun-
2 try (World Bank 2019).
0
The GHI uses the most up-to-date data available from United Nations agencies and other
n
10
ia
ia
ric C d
Si Rep al
e
a
i
n
so
al
da
on
ne
a
ni
er
al
tr
Fa
ra .
Ch
M
Be
an en
Su
international organizations (see Appendix C for the data sources and date ranges for each of
m
Le
i
ig
Gu
a
N
So
in
h
the indicators used in the GHI). The 2021 GHI scores are based on the latest data for each
ut
rk
er
So
Bu
indicator from 2016–2020, whereas the indicator data from 2021 will not be available until
Af
at least 2022. The 2021 GHI scores thus refer to the year of this report’s publication, not
Source: Authors (see Appendix C for data sources). the year from which the data are drawn.
16 Global, Regional, and National Trends | Chapter 01 | 2021 Global Hunger IndexFIGURE 1.4 2021 GHI SCORES AND PROGRESS SINCE 2000
55
extremely
alarming
Somalia
50
Higher
hunger
45 Yemen
alarming
Central African Republic
40
Chad
Dem. Rep. of the Congo
Madagascar
2021 Global Hunger Index score
35
Liberia
GHI Severity Scale
Haiti
Sierra Leone Mozambique
Rep. of Congo
30
Afghanistan Nigeria
serious
Papua New Guinea
Djibouti India Lesotho
Rwanda
Angola
DPR Korea
25 Mali Tanzania Pakistan
Ethiopia Burkina Faso
Togo
Kenya Botswana
Mauritania
Benin Iraq Venezuela
Côte d’Ivoire
Malawi
Guatemala Namibia
20 Lao PDR
Nepal Bangladesh
Cameroon Indonesia Solomon Islands
Gambia Eswatini
Myanmar
Cambodia
Philippines Gabon
moderate
Senegal
Sri Lanka
15 Ghana Nicaragua
Viet Nam Ecuador
Lower South Africa
hunger Bolivia Honduras Malaysia
Egypt
Oman
Mauritius
Thailand
Guyana Cabo Verde
10 Suriname
low
5
-40 -35 -30 -25 -20 -15 -10 -5 0 5 10
Higher reduction Lower reduction Increase in
in hunger in hunger hunger
Absolute change in GHI score since 2000
Source: Authors.
Note: This figure illustrates the change in GHI scores since 2000 in absolute values. It features countries where data are available to calculate 2000 and 2021 GHI scores and where 2021 GHI
scores show moderate, serious, alarming, or extremely alarming hunger levels. Some likely poor performers may not appear due to missing data.
2021 Global Hunger Index | Chapter 01 | Global, Regional, and National Trends17Child mortality levels are also uneven within country borders, impact on the poor and vulnerable is widening the gap between rich
indicating that the chances of child survival can be vastly differ- and poor (Binns and Low 2021).
ent depending on the state or department in which one lives. A
recent compilation of subnational child mortality data reveals that of Hunger and undernutrition tend to be higher in rural areas than
22 countries in Africa and South Asia, Nigeria has the largest dispar- in urban areas, but it is unclear how the COVID-19 pandemic will
ity in under-five mortality. Although the country’s under-five mortality affect this dynamic in the long term. A comparison of food insecurity
rate averages 11.7 percent nationally, at the state level it ranges from according to the Food Insecurity Experience Scale (FIES) in urban and
26.1 percent in Kebbi state to 5.8 percent in Bayelsa. Progress in rural Mali before and during the COVID-19 pandemic shows that in
reducing child mortality can also vary within countries. Kenya’s under- the early months of the pandemic in 2020, food insecurity increased
five mortality rate declined 57 percent between 1990 and 2019, with more in urban areas than in rural areas, erasing the previous rural-
rates decreasing in most counties, yet the rate in Nyandarua County urban gap in food insecurity. Urban survey respondents attributed the
increased by 32 percent in that period (UN IGME 2021). increase to the pandemic. Urban areas were more severely disrupted
by the pandemic given the stricter social distancing measures prac-
The prevalence of undernourishment is not regularly calculated ticed in densely populated cities. In addition, the pandemic hit at a
at the subnational level, but nascent efforts to do so have begun and point in the agricultural cycle when postharvest processing was the
reveal subnational variation. In Pakistan, for example, the 2018–2019 predominant activity, negatively affecting economic activity in urban
rates ranged from 12.7 percent undernourished in Khyber Pakhtunkhwa areas more than in rural areas (Adjognon et al. 2021). By contrast, a
province to 21.5 percent in Punjab (Afridi et al. 2021). In Viet Nam, short-term effect of the pandemic in Nigeria was a greater increase
the prevalence of undernourishment in 2016 ranged from 8.6 percent in food insecurity among households in remote and conflict-affected
in the Southeast region to 15.6 percent in the Central Highlands (Kim areas rather than urban areas. Although households in urban areas
et al. 2021). In part because the prevalence of undernourishment is experienced a greater drop in economic activity, this did not result
included in the monitoring framework of the Sustainable Development in a significant reduction in food security (Amare et al. 2021).
Goals, capacity-building efforts are underway to enable national gov-
ernments to calculate the prevalence of undernourishment for their
Conclusion
countries, including at subnational levels, and these efforts have the
potential to increase the availability of these data (FAO 2020). Now more than ever, it is clear that the world is not on track to achieve
the goal of Zero Hunger by 2030 and that past gains have been built
Inequality within countries is a persistent challenge, made more on an unsustainable foundation. In order to achieve the SDGs and truly
urgent by the movement restrictions and service disruptions associ- “leave no one behind,” we—humanity—must vigorously confront the
ated with the COVID-19 pandemic. Pandemics have historically wors- increasing challenges of conflict, climate change, and economic down-
ened inequality (Sedik and Xu 2020; Béné et al. 2021). While the full turns, as well as structural factors such as poverty and inequality, that
impact of the COVID-19 pandemic on inequality is yet to be under- leave people facing hunger and malnutrition. While eliminating current
stood, there are initial indications that inequality could worsen along conflict seems out of reach, we can make incremental steps toward
multiple dimensions. For example, the pandemic may exacerbate gen- breaking the cycle of hunger and conflict by recognizing and commit-
der inequality, a chronic and pervasive issue. The gender gap in the ting to address the unique challenges facing food systems in conflict
prevalence of moderate or severe food insecurity increased during settings. Through mitigation and adaptation measures, the devastation
the pandemic; this rate is now 10 percent higher among women than of global climate change could be lessened or even stopped. Although
among men (FAO, IFAD et al. 2021). There is evidence from South the COVID-19-induced recession has been extreme and unique in many
Africa that women’s employment has been negatively affected more ways, economic downturns are inevitable and will require better, more
than men’s (Casale and Posel 2021). Meanwhile the disruption to universally available safety nets to prevent hunger and malnutrition in
schooling has the potential to affect girls’ schooling more significantly the future. We live in a world of challenges and shocks, and our food
than boys’ as girls are forced into early marriage, take on dispropor- systems must be built to withstand and recover from these challenges
tionate shares of household work, or are subject to sexual violence in ways that deliver food and nutrition security for all people. Hunger
(Burzynska and Contreras 2020). Each of these aspects of gender and malnutrition do not continue for want of solutions, but rather for
inequality has the potential to increase food insecurity and undernutri- want of the political will and resources to implement the solutions at
tion in the long run. More generally, the pandemic’s disproportionate hand and to respect, protect, and fulfill the right to food.
18 Global, Regional, and National Trends | Chapter 01 | 2021 Global Hunger IndexYou can also read