Citizen science and online data: Opportunities and challenges for snake ecology and action against snakebite - Zurich Open Repository and Archive
←
→
Page content transcription
If your browser does not render page correctly, please read the page content below

Zurich Open Repository and
                                                                          Archive
                                                                          University of Zurich
                                                                          Main Library
                                                                          Strickhofstrasse 39
                                                                          CH-8057 Zurich
                                                                          www.zora.uzh.ch

 Year: 2021

   Citizen science and online data: Opportunities and challenges for snake
                     ecology and action against snakebite

     Durso, Andrew M ; Ruiz de Castañeda, Rafael ; Montalcini, Camille ; Mondardini, M Rosa ;
                        Fernandez-Marques, Jose L ; Grey, François ; et al

Abstract: The secretive behavior and life history of snakes makes studying their biology, distribution, and
the epidemiology of venomous snakebite challenging. One of the most useful, most versatile, and easiest
to collect types of biological data are photographs, particularly those that are connected with geographic
location and date-time metadata. Photos verify occurrence records, provide data on phenotypes and
ecology, and are often used to illustrate new species descriptions, field guides and identification keys, as
well as in training humans and computer vision algorithms to identify snakes. We scoured eleven online
and two offline sources of snake photos in an attempt to collect as many photos of as many snake species as
possible, and attempt to explain some of the inter-species variation in photograph quantity among global
regions and taxonomic groups, and with regard to medical importance, human population density, and
range size. We collected a total of 725,565 photos—between 1 and 48,696 photos of 3098 of the world’s
3879 snake species (79.9%), leaving 781 “most wanted” species with no photos (20.1% of all currently-
described species as of the December 2020 release of The Reptile Database). We provide a list of most
wanted species sortable by family, continent, authority, and medical importance, and encourage snake
photographers worldwide to submit photos and associated metadata, particularly of “missing” species,
to the most permanent and useful online archives: The Reptile Database, iNaturalist, and HerpMapper.

DOI: https://doi.org/10.1016/j.toxcx.2021.100071

Posted at the Zurich Open Repository and Archive, University of Zurich
ZORA URL: https://doi.org/10.5167/uzh-204930
Journal Article
Published Version

The following work is licensed under a Creative Commons: Attribution 4.0 International (CC BY 4.0)
License.

Originally published at:
Durso, Andrew M; Ruiz de Castañeda, Rafael; Montalcini, Camille; Mondardini, M Rosa; Fernandez-
Marques, Jose L; Grey, François; et al (2021). Citizen science and online data: Opportunities and
challenges for snake ecology and action against snakebite. Toxicon, 9-10:100071.
DOI: https://doi.org/10.1016/j.toxcx.2021.100071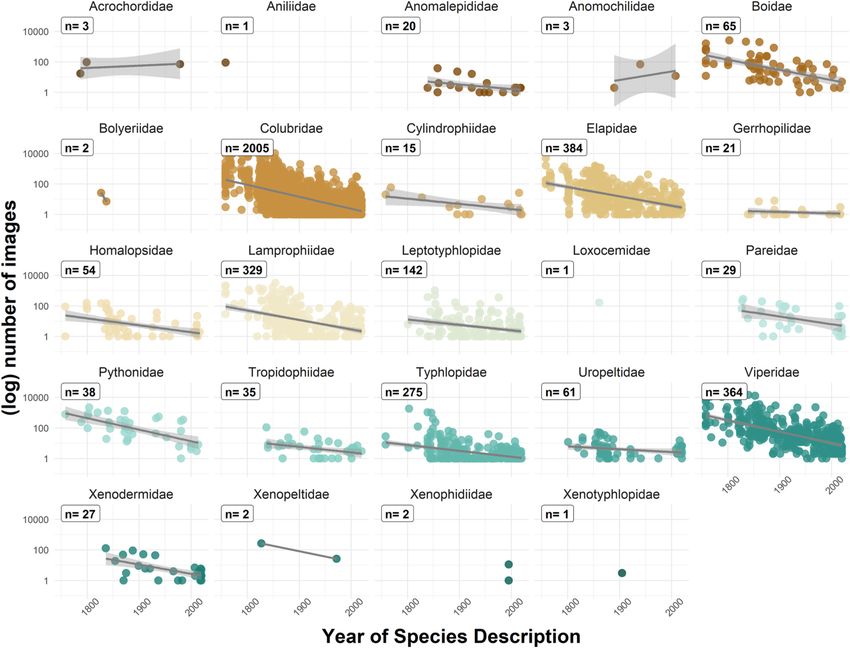
Toxicon:X 9–10 (2021) 100071

                                                                     Contents lists available at ScienceDirect

                                                                                  Toxicon: X
                                                       journal homepage: www.journals.elsevier.com/toxicon-x

Citizen science and online data: Opportunities and challenges for snake
ecology and action against snakebite
Andrew M. Durso a, b, *, Rafael Ruiz de Castañeda b, c, Camille Montalcini d, M. Rosa Mondardini e,
Jose L. Fernandez-Marques f, François Grey f, Martin M. Müller g, Peter Uetz h, i,
Benjamin M. Marshall j, Russell J. Gray k, Christopher E. Smith l, Donald Becker m,
Michael Pingleton n, Jose Louies o, Arthur D. Abegg p, q, Jeannot Akuboy r, Gabriel Alcoba s,
Jennifer C. Daltry t, u, Omar M. Entiauspe-Neto v, Paul Freed h, w, Marco Antonio de Freitas x,
Xavier Glaudas y, z, Song Huang aa, Tianqi Huang ab, Yatin Kalki ac, Yosuke Kojima ad,
Anne Laudisoit ae, Kul Prasad Limbu af, José G. Martínez-Fonseca ag, Konrad Mebert ah, ai,
Mark-Oliver Rödel aj, Sara Ruane ak, Manuel Ruedi al, Andreas Schmitz al, Sarah A. Tatum am,
Frank Tillack aj, Avinash Visvanathan an, Wolfgang Wüster ao, Isabelle Bolon b
a
   Department of Biological Sciences, Florida Gulf Coast University, Ft. Myers, FL, USA
b
   Institute of Global Health, Department of Community Health and Medicine, Faculty of Medicine, University of Geneva, Geneva, Switzerland
c
   World Health Organization, Geneva, Switzerland
d
   University of Bern, Bern, Switzerland
e
   Citizen Science Center Zürich (ETH Zürich and University of Zürich), Zürich, Switzerland
f
  University of Geneva, Geneva, Switzerland
g
   École polytechnique fédérale de Lausanne, Geneva, Switzerland
h
   The Reptile Database, Richmond, VA, USA
i
  Virginia Commonwealth University, Richmond, VA, USA
j
  Suranaree University of Technology, Nakhon Ratchasima, Thailand
k
   R. J. Gray Ecology, New Smyrna Beach, FL, USA
l
  HerpMapper, St. Paul, MN, USA
m
    HerpMapper, Cedar Rapids, IA, USA
n
   HerpMapper, Champaign, IL, USA
o
   Indian Snakes, Kottayam, Kerala, India
p
   Instituto Butantan, São Paulo, São Paulo, Brazil
q
   University of São Paulo, São Paulo, São Paulo, Brazil
r
  University of Kisangani, Kisangani, Democratic Republic of the Congo
s
  University of Geneva Hospitals, Geneva, Switzerland
t
  Flora & Fauna International, Cambridge, England, UK
u
   Global Wildlife Conservation, Austin, TX, USA
v
   Universidade Federal do Rio Grande, Rio Grande, Rio Grande do Sul, Brazil
w
    Reptile Database, Scotts Mills, OR, USA
x
   Murici Ecological Station, Murici, Alagoas, Brazil
y
   University of the Witwatersrand, Johannesburg, South Africa
z
   Bangor University, Bangor, Wales, UK
aa
     Anhui Normal University, Wuhu, Anhui, China
ab
     Rutgers University, New Brunswick, NJ, USA
ac
    Madras Crocodile Bank Trust, Mahabalipuram, Tamil Nadu, India
ad
     Toho University, Funabashi, Japan
ae
    EcoHealth Alliance, New York, NY, USA
af
    Tribhuvan University, Biratnagar, Nepal
ag
     Northern Arizona University, Flagstaff, AZ, USA
ah
     Global Biology, Birr, Switzerland
ai
    Institute of Development, Ecology, Conservation & Cooperation, Rome, Italy
aj
    Museum für Naturkunde - Leibniz Institute for Evolution and Biodiversity Science, Berlin, Germany
ak
     Rutgers University, Newark, NJ, USA
al
    Museum d’Histoire naturelle Geneve, Geneva, Switzerland

    * Corresponding author.

https://doi.org/10.1016/j.toxcx.2021.100071

Available online 22 June 2021
2590-1710/© 2021 The Author(s). Published by Elsevier Ltd. This is an open access article under the CC BY license (http://creativecommons.org/licenses/by/4.0/).
A.M. Durso et al.                                                                                                                                  Toxicon: X 9–10 (2021) 100071

am
   University of North Georgia, Dahlonega, GA, USA
an
   Friends of Snakes Society, Hyderabad, Telangana, India
ao
   Molecular Ecology and Fisheries Genetics Laboratory, School of Natural Sciences, Bangor University, Bangor, Wales, UK

A R T I C L E I N F O                                      A B S T R A C T

Handling Editor: Glenn King                                The secretive behavior and life history of snakes makes studying their biology, distribution, and the epidemi-
                                                           ology of venomous snakebite challenging. One of the most useful, most versatile, and easiest to collect types of
Keywords:                                                  biological data are photographs, particularly those that are connected with geographic location and date-time
Snakes                                                     metadata. Photos verify occurrence records, provide data on phenotypes and ecology, and are often used to
Biodiversity
                                                           illustrate new species descriptions, field guides and identification keys, as well as in training humans and
Photography
                                                           computer vision algorithms to identify snakes. We scoured eleven online and two offline sources of snake photos
Snakebite
Endemism                                                   in an attempt to collect as many photos of as many snake species as possible, and attempt to explain some of the
Online data                                                inter-species variation in photograph quantity among global regions and taxonomic groups, and with regard to
Citizen science                                            medical importance, human population density, and range size. We collected a total of 725,565 photos—between
Data science                                               1 and 48,696 photos of 3098 of the world’s 3879 snake species (79.9%), leaving 781 “most wanted” species with
                                                           no photos (20.1% of all currently-described species as of the December 2020 release of The Reptile Database). We
                                                           provide a list of most wanted species sortable by family, continent, authority, and medical importance, and
                                                           encourage snake photographers worldwide to submit photos and associated metadata, particularly of “missing”
                                                           species, to the most permanent and useful online archives: The Reptile Database, iNaturalist, and HerpMapper.

1. Introduction                                                                                  iNaturalist and HerpMapper require users to enter structured data (date,
                                                                                                 time, location, and species). HerpMapper requires a voucher photo, and
     Our understanding of the global diversity and distribution of the nearly                    iNaturalist strongly encourages voucher photos. Other online sources of
3900 species of snakes remains incomplete (Böhm et al., 2013; Roll et al.,                      snake photos exist, but many lack structured data. For example, Cal-
2017). This situation is partially attributable to the widespread fear of                        Photos and Wikimedia collect photos but do not require date, time, and
snakes (Tierney and Connolly, 2013), even among scientists and aca-                              location information to be associated with them. The photo sharing
demics, but largely to the secretive behavior and life history of snakes                         website Flickr, home to a community of photographers with a serious
(Steen, 2010), which limits sample sizes in ecological studies (Bonnet et al.,                   interest in biodiversity, allows but does not require users to include this
2002; Seigel, 1993) and hinders the assembly of country-level species                            information, and the social media sites Twitter and Facebook contain
checklists in some parts of the world (e.g., Bauer et al., 2017; Branch et al.,                  millions of such photos but little to no structured data. Finally, many
2019; Marques et al., 2018). Range maps for most snake species recently                          private collections of snake photos exist, most of which are challenging
became available (Roll et al., 2017), although changes in taxonomy and the                       to access. Marshall et al. (2020a) recently published an inventory of
rapid rate of new species description create challenges for scientists wishing                   online reptile images, conducted concurrently with our study, which we
to use such resources. The Reptile Database (Uetz et al., 2021) provides                         incorporate here and on which we build by adding 313,668 photos and
regular updates on snake taxonomy, but the complexity of biological                              281 species of snakes.
nomenclature and the absence of an automated interface with other online                             We attempted to combine these resources to assemble the largest set
data portals, such as VertNet and Genbank, makes connecting names                                of snake photos to date, which contains at least one photo of 3098
among sources challenging. Molecular systematics has produced an in-                             (79.9%) of all 3879 valid species as of the December 2020 release of The
crease in species description rates (Simkins et al., 2020), and the number of                    Reptile Database (Fig. 1). Controlling for variation among global regions
new snake species described in the 21st century so far has averaged 33 per                       and between scolecophidian blindsnakes (ca. 450 ecologically-similar
year (Uetz et al., 2021).                                                                        fossorial non-venomous species that are generally smaller and even
     Although preserved specimens remain the gold standard in biological
research in terms of permanence and reproducibility (Ceríaco et al., 2016),
one of the most useful, most versatile, and easiest to collect types of bio-
logical data are photographs (Borges et al., 2020; Leipzig et al., 2021).
Particularly when combined with geographic location and date-time in-
formation, photos of snakes and other wild animals have a variety of po-
tential applications, including serving as a verifiable basis for mapping
occurrence records, as data sources to answer ecological questions and to
map and quantify gradients of phenotypic variation, as reference material
for new species descriptions, for use in illustrating field guides and iden-
tification keys, as training material for improving identification skills, as
training and testing material for computer vision algorithms, and as
reference material for identifying snakes in snakebite cases.
     The development of citizen science platforms that emphasize the
collection and classification of biological and ecological data (Bonney
et al., 2009; Dickinson et al., 2010; Kullenberg and Kasperowski, 2016),
including photos, has the potential to reduce this shortfall (Chandler
et al., 2017; Goiran and Shine, 2019; Troia and McManamay, 2016).
Two major citizen science platforms contribute the vast majority of the
publicly-available structured online data on snake distribution and                              Fig. 1. Taxonomic structure of dataset. The innermost ring represents infra-
appearance: iNaturalist, which includes snakes as well as all other taxa,                        orders: blindsnakes (Scolecophidia; light gray) and all other snakes (Alethino-
and HerpMapper, which is specific to amphibians and reptiles. Both                               phidia; dark gray). The middle ring represents families, and the outermost ring
                                                                                                 represents genera. Width of slices is scaled to the number of photos.

                                                                                             2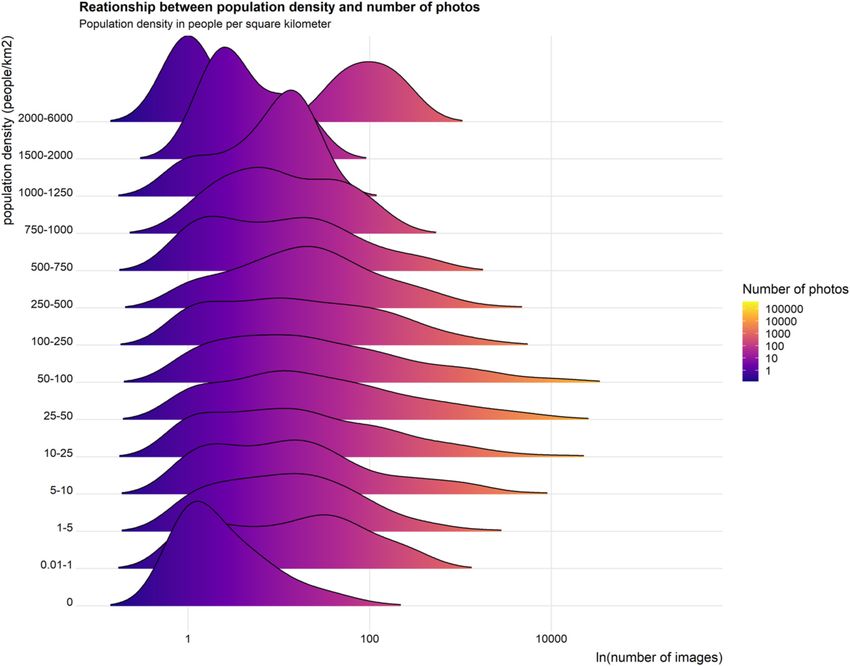
A.M. Durso et al.                                                                                                                     Toxicon: X 9–10 (2021) 100071

more cryptic than other snake species but which might not be mono-                      1. iNaturalist is a prominent citizen science platform where users
phyletic; Miralles et al., 2018) and alethinophidian (all other) snakes,                   submit photos or other media of any organism from any location
we asked several questions about what explains the variation among                         around the world. The user community of ~1.5 million contrib-
species in the number of photos, namely:                                                   utes crowd-sourced identification conforming to curated taxo-
                                                                                           nomic names, of which The Reptile Database (Uetz et al., 2021) is
 • Do species with larger geographic ranges have more photos?                              the single most comprehensive and up-to-date online provider for
 • Do species with a higher human population density in their range                        reptiles. We used the iNaturalist Data Export Tool (https://www.
   have more photos?                                                                       inaturalist.org/observations/export) with the query string qual-
 • Do species described earlier have more photos?                                          ity_grade = research&identifications = any&captive = false-
 • Do medically-important venomous snakes have more photos than                            &taxon_id = 85553 corresponding to Research Grade
   non-venomous species?                                                                   observations (i.e., dated and georeferenced observations, with at
                                                                                           least two users identifying the species and the majority of all
2. Methods                                                                                 identifications are in agreement), not in captivity, and in the
                                                                                           taxonomic clade Serpentes. The date range included all obser-
2.1. Photo sources                                                                         vations that had achieved Research Grade as of 5 February 2021.
                                                                                           The curated taxonomic names in iNaturalist follow The Reptile
    We collected photo URLs, species names, and other metadata where                       Database, with relatively few exceptions that we fixed manually.
available (detailed below) from Internet sources. Here we describe each                    It was not apparent at first that the iNaturalist Data Export Tool
source and our method for collecting and cleaning, where necessary, the                    counts each observation only once, even if observations have >1
above information. Our target was color photographs taken of wild                          photo (see GBIF).
living snakes, one individual snake per photo, as many photos as                        2. The Global Biodiversity Information Facility (GBIF) aggre-
possible per species. We did not consider photo quality (i.e., composi-                    gates biodiversity data from hundreds of institutions across the
tion, resolution, visibility of the entire snake or of diagnostic features) to             world. We queried GBIF on 6 February 2021 for all ‘human
be of particular importance, because we were interested in representing                    observation’ records of snakes, using the list of family names in
the kinds of photos that would be taken by a range of photographers,                       Appendix 1. The vast majority (404,793; 83.5%) of 484,563 re-
from expert to amateur.                                                                    cords with media returned were iNaturalist records, leaving
                                                                                           79,770 photos from 45 other data contributors. Most of these are

Fig. 2. Relationship between range size (millions of km2) and human population in range (millions of people) by global region, with point size scaled to number of
photos and medically-important venomous snakes (MIVS) in red. Each point is one species. (For interpretation of the references to color in this figure legend, the
reader is referred to the Web version of this article.)

                                                                                 3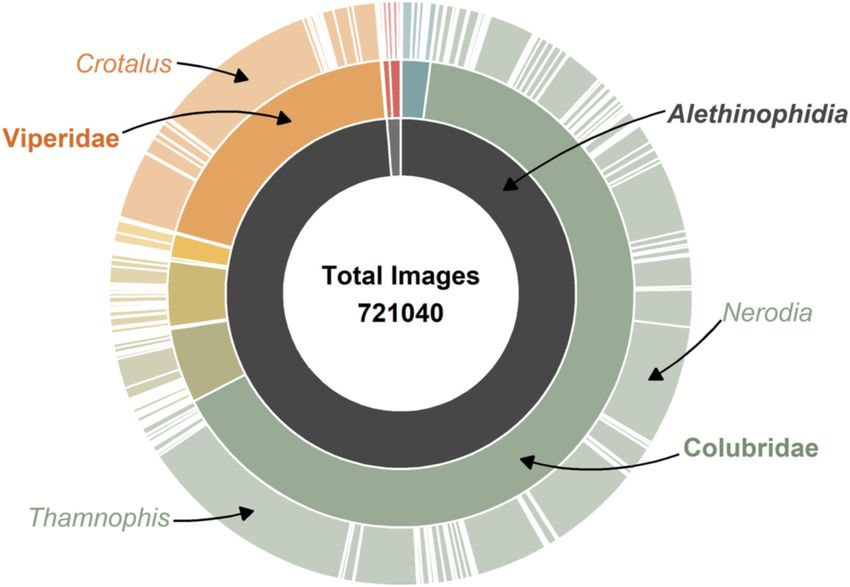
A.M. Durso et al.                                                                                                                               Toxicon: X 9–10 (2021) 100071

Table 1
Number of photos, number of species, and number of unique species (only from that data source) from each of the data sources.
  source            CalPhotos        Flickr     HerpMapper      iNaturalist     ISI            Literature    Private   TRD            Twitter       VMUS         Wikimedia

  photos            5,506            56,945     124,378         414,115         5,593          671           56,268    6,686          5,018         48,387       1,998
  species           915              1,560      1,127           2,273           5              324           1,788     1948           323           234          1,031
  unique species    11               55         10              199             0              159           34        200            1             12           38

       images of preserved specimens in natural history museums, with                           natural history subjects, along with descriptive information
       a handful of computerized tomography (CT) scans, sound re-                               including scientific names, provided by the person or organiza-
       cordings, or other miscellaneous images related to snakes, which                         tion that contributed the photos. Experts review identification of
       were not useful to us. However, GBIF provides two important                              the photos. We used the Custom Query form at https://calphotos.
       advantages over direct exports from iNaturalist: 1) the data                             berkeley.edu/cgi/img_query to collect lists of photos of snakes at
       downloads are archived with DOIs (GBIF.org, 2021) and 2) iNa-                            the family level, following the format ?where-family = Colu-
       turalist observations with more than one photograph are coun-                            bridae. For a list of snake family names and synonyms used, see
       ted. The GBIF platform only incorporates photos with CC0, CC-BY                          Appendix 1. By using the options text_only = 1&max = 3000 we
       and CC-BY-NC licenses, whereas the default users setting in                              generated a single table per family which we then copied into a
       iNaturalist is All Rights Reserved (ARR). Because we wanted to                           spreadsheet and summarized in R. The taxonomy does not
       understand the full scope of online snake photos, we used the                            necessarily follow any one standard (but uses the Reptile Data-
       higher count of either method, but spot-checking revealed that                           base as source for species names); deviations from The Reptile
       even doing so resulted in an undercount, because there are many                          Database taxonomy were fixed manually. This methodology dif-
       ARR observations with >1 photo. The average ± S.D. number of                             fers from that used by Marshall et al. (2020a), who used counts of
       photos per iNaturalist snake record in GBIF is 1.6 ± 1.2 (max =                          one for all species with photos in CalPhotos.
       71, but 93.8% of iNaturalist records have 3 or fewer photos);                         5. Wikimedia Commons is a collection of freely useable media files
       thus, we expect that iNaturalist contains several thousand addi-                         without a specific biodiversity focus, but which includes many
       tional snake photos that are not indexed in GBIF and are not                             photos of animals. We used the exact process implemented by
       easily quantified using iNaturalist’s native tools.                                      Marshall et al. (2020a) to query all Reptile Database snake spe-
    3. HerpMapper is the largest global reptile and amphibian citizen                           cies names and synonyms, discarding page results that did not
       science platform (O’Donnell and Durso, 2014). Users submit                               include the “Articles with ‘species’ microformats” category (for
       photos or other media of any reptile and amphibian species from                          more detail, see http://microformats.org/wiki/species). Because
       any location around the world. There is no identification vali-                          we enforced The Reptile Database taxonomy in our search terms,
       dation, but the HerpMapper data contributor community is made                            no correction of taxonomic names was necessary, but we un-
       up of professional herpetologists and amateur herpetological                             doubtedly missed a small number of photos that are tagged using
       enthusiasts (“herpers”) with a high level of expertise identifying                       e.g., misspelled scientific names or common names only in
       species of snakes and other reptiles. An important feature is that                       Wikimedia.
       other users of HerpMapper and the general public do not have                          6. The FitzPatrick Institute of African Ornithology Virtual
       access to exact locality data; only verified HerpMapper Partners                         Museum (VMUS) hosts a Reptile Atlas of Africa that collects
       have access, and very sensitive records can hidden from public                           georeferenced photos of largely southern African reptiles. We
       view entirely, in order to protect sensitive locality information.                       queried the VMUS for each snake family at the following URL:
       We submitted a data request and received a list of all snake photo                       http://vmus.adu.org.za/vm_search.php?
       URLs on 3 December 2019, which we updated from https://www.                              database=sarca&prj_acronym=ReptileMAP&db=sarca&URL=h
       herpmapper.org/records?taxon=Serpentes with the help of the                              ttp://sarca.adu.org.za&Logo=images/reptilemap_logo.
       HerpMapper admins following Marshall et al. (2020a). The date                            png&Headline=Reptile%20Atlas%20of%
       range now includes all observations that had been submitted as of                        20Africa&Use_main_filter=0&User_id=&Full_name=&
       5 February 2021. The curated taxonomic names in HerpMapper                               serve_sp_list=1&drop_down_list=Latin%
       follow The Reptile Database, with relatively few exceptions that                         20names&assessment=0#familyThe taxonomy does not neces-
       we fixed manually.                                                                       sarily follow any one standard; nevertheless, because most con-
    4. CalPhotos is a University of California Berkeley Natural History                         tributors are experts, there were sufficiently few deviations from
       Museum photo database, and one of the oldest online image da-                            The Reptile Database taxonomy that we fixed them manually.
       tabases specializing in natural history, dating to 1995. The                          7. The Indian Snakebite Initiative (ISI) Big 4 Mapping Project
       database contains digital images of plants, animals, and other                           (http://snakebiteinitiative.in/snake/) is a network of snake

Table 2
Percent of photos from each global region that come from each of the data sources. iNaturalist contributed the most photos for every global region except Africa. See
text for definitions of global regions.
  source                    Africa            Asia            Australia               Europe                marine             Canada + USA                   Latin America

  CalPhotos                 0.7               2.2             2.2                     1.6                   1.5                0.2                            1.7
  Flickr                    5.8               19.3            34.2                    13.8                  14.5               4.4                            9.6
  HerpMapper                0.8               6.5             3.3                     1                     2.4                24.8                           11
  iNaturalist               19.2              40.5            42.5                    60.8                  55.8               66.6                           55.8
  ISI                       0                 8.7             0                       0                     0                  0                              0
  Literature                0.2               0.4             0.1                     0                     0.4                0                              0.3
  Private                   5.7               17.2            14.5                    20.4                  9.5                3                              18.3
  TRD                       1.2               3.3             1.5                     0.7                   4.7                0.1                            2.7
  Twitter                   0.5               0.7             0.9                     1.4                   1.5                0.8                            0.2
  VMUS                      65.6              0.1             0                       0                     7.2                0                              0
  Wikimedia                 0.4               1.2             0.8                     0.3                   2.5                0.1                            0.4

                                                                                  4
A.M. Durso et al.                                                                                                                        Toxicon: X 9–10 (2021) 100071

Table 3                                                                                      carinatus, Naja naja). Photos were transferred over Microsoft
Number species in each photo bracket. MIVS = medically-important venomous                    OneDrive and associated metadata were provided via a one-time
snakes.                                                                                      admin access to the backend provided by a private arrangement
  Photo bracket        Number of species   Percentage of      Cumulative                     on 19th January 2019.
                       (MIVS)              species            percentage                  8. The Reptile Database itself curates a collection of reptile photos,
  no photos            781 (29)            20.1               20.1                           largely gathered from private photographers and described by
  1 photo              379 (43)            9.8                29.9                           Marshall et al. (2020a). Unlike the others, this data source con-
  2-10 photos          1,027 (113)         26.5               56.4                           tains about 700 images of preserved specimens from museum
  11-100 photos        1,089 (228)         28.1               84.5
                                                                                             collections, many of which are also represented by live photos.
  101-1000 photos      479 (119)           12.3               96.8
  1001–10,000          112 (30)            2.9                99.7                        9. Flickr is a photo-sharing website with a sub-community of pho-
    photos                                                                                   tographers with a serious interest in biodiversity. Unlike all of the
  more than 10,000     12 (4)              0.3                100                            above, there is no site-wide biodiversity focus or structured way
    photos                                                                                   for users to tag photos as particular species within a hierarchical
                                                                                             taxonomic framework. Marshall et al. (2020a) queried Flickr
        rescuers in India who collect photos and location information                        using their API (28 June 2020) but this took place after Flickr
        when they are called to remove a snake from a person’s home.                         changed from a free platform with unlimited storage to a service
        About 800 volunteer participants use an Android app to upload                        that offered a small amount of free image hosting but required
        photos and metadata. For more detail see http://                                     paid subscriptions for users with more than 1000 photos in 2019.
        snakebiteinitiative.in/#/Big4compo. This project collects                            We collected Flickr data in November 2018 using a python script
        photos of only the four most medically-important species                             (https://github.com/cam4ani/snakes/blob/master/get_flickr_d
        throughout India (Bungarus caeruleus, Daboia russelii, Echis                         ata.ipynb), prior to the point when many users may have deleted

Fig. 3. A) Percent of snake species in each country with at least one photo. Ninety-four countries have photos of every species in the dataset. Indonesia, with a high
percentage of island endemic species, has 102 snake species (29%) without any photos in the dataset. Globally, the Caribbean, the Horn of Africa, and the islands of
southeast Asia are the regions with the greatest need of additional data collection. B) Heatmap of ranges of species with no images, data from GARD (Roll et al.,
2017). Photographers with photos of missing species (see Appendix 4) are encouraged to submit them to The Reptile Database.

                                                                                  5
A.M. Durso et al.                                                                                                                      Toxicon: X 9–10 (2021) 100071

       their accounts or moved them to other platforms. We used all                        tags, 54,873 of which were at the species level (range 4–33 tags
       then-valid Reptile Database snake genus names as search terms,                      per image, mean ± S.D. = 9.5 ± 3.3). We selected the subset of
       as well as the list of families in Appendix 1, and common names in                  tagged images that had a single most common species-level tag,
       multiple languages taken from Wikipedia page titles (see script                     had been tagged by at least 3 participants, and where at least 50%
       for details). We discarded certain genera that have multiple other                  of the tags were the same (5019 images). We found images of 323
       meanings and would likely have resulted in large numbers of                         species (range 1–418 images per species), three of which were not
       irrelevant photos (e.g., Arizona, Virginia, Python). We did not                     represented in any other data source (1 image each; but see
       attempt to remove photos of captive snakes.                                         discussion).
   10. Twitter is not organized into snake or biodiversity-specific                    11. Facebook is home to numerous groups and pages that focus on
       groups (although certain hashtags such as #NotACopperhead                           providing rapid identification of snake photos (Smith et al.,
       would lead users to photos of snakes) but represents a rich source                  2019), the largest of which includes hundreds of thousands of
       of photos that is relatively easy to query. We queried the Twitter                  users and helps to identify hundreds of snake photos per day.
       public streaming API from 15th May 2019 to 23rd August 2019.                        Durso et al. (2021a) provided a list of such groups as of 2020.
       Because we were limited to 400 search terms, we identified parts                    These groups have photo collections of high value. Unfortunately,
       of genus names that corresponded to particular strings that would                   Facebook no longer supports systematic access via an API that is
       be uncommon in everyday words (e.g., “ophis”, which is the                          independent of the user access point, which means that searches
       ending of 21% (111 of 517) of then-valid snake genera; see Ap-                      are likely non-reproducible and influenced by user language,
       pendix 2 for full list) and added to these a list of common name                    location, and group access. Marshall et al. (2020a) and others
       parts (e.g., “viper”, “cobra”; see Appendix 2 for full list). The text              have lamented the same problem, which is especially acute
       of the Tweet, the expanded and display URLs for links and media,                    because Facebook likely represents the single largest and most
       text for hashtags, and username were checked for matches. We                        carefully curated online source of snake photos on the web (it is
       removed tweets that Twitter had marked as containing sensitive                      difficult to assess whether Facebook or iNaturalist has more
       media. We obtained a total of 194,545 images. One of us (AMD)                       photos because of the limitations described here—Facebook has
       went through a subset (N = 6684) of these images in a private                       almost 2000 times as many users but only a small percentage are
       project on Crowdbreaks (Müller and Salathé, 2019) to tag inap-                     involved in snake identification/biodiversity sub-communities).
       propriate, irrelevant, and redundant images; these categories                       In contrast to Twitter, most of the non-snake, viral, duplicate,
       were used to train an image classifier which predicted 16,190                       or otherwise irrelevant images have already been filtered out by
       (8.3%) of the total to be relevant. The classifier was based on a                   diligent moderators and administrators of snake ID groups, and
       ResNet-50 model (He et al., 2016) pre-trained on ImageNet (Deng                     every photo contains a species common and/or scientific name
       et al., 2009). The classifier was used to filter images which were                  (non-standardized taxonomy) in the caption or comment thread.
       predicted to be within the “snake, serpent, ophidian” category                      We attempted but were ultimately unable to access these photos
       and were manually verified to be relevant by AMD. We removed                        and metadata in a systematic way, but mention them here
       exact image duplicates, leaving us with 7808 images (4% of the                      because of their promise for future use in biodiversity imagery
       original). We then crowd-sourced species-level identifications in                   collection.
       the same manner as Durso et al. (2021a)—for each image, par-                    12. We compiled a list of professional herpetologists who we
       ticipants had to select a species, genus, or family-level taxonomic                 thought might have extensive private snake photo collections. A
       name matching the then-current Reptile Database taxonomy.                           total of 36 individuals generously provided between 1 and 2132
       Participants could also tag images as “not a snake/contains                         photos, which were transferred by email or third-party server.
       multiple species” (262 images). We awarded prizes to partici-                       About twice this many individuals were contacted but either
       pants who tagged the most images between 18th November and                          declined to provide photos or expressed willingness to do so, but
       28th November 2019 (see https://snakes.citizenscience.ch/en/                        never did. Some unknown percentage of these photos may be
       ranking/autumn-2019). We collected a total of 70,507 image                          redundant with other data sources, for instance if these

Fig. 4. Number of species per country plotted against the number of species with no photos found in that country. Country lists are from the Reptile Database (Uetz
et al., 2021).

                                                                                 6
A.M. Durso et al.                                                                                                                                     Toxicon: X 9–10 (2021) 100071

Table 4
Percent of photos from each data source that come from each of the global regions. See text for definitions of global regions.
  global region            CalPhotos         Flickr       HerpMapper      iNaturalist          ISI          Literature       Private           TRD          Twitter         VMUS

  Africa                   9.1               7.4          0.5             3.4                  0            18.3             7.4               12.9         6.9             99.6
  Asia                     25.5              21.8         3.3             6.3                  100          35               19.6              31.6         9.4             0.2
  Australia                8                 11.9         0.5             2                    0            1.9              5.1               4.6          3.5             0
  Europe                   10                8.6          0.3             5.2                  0            1.5              12.8              3.7          10.1            0
  marine                   0.4               0.4          0               0.2                  0            1                0.3               1.1          0.5             0.2
  Canada + USA             17.9              33.5         86.7            69.8                 0            1                23.2              6.9          66              0
  Latin America            29.1              16.4         8.6             13.1                 0            41.1             31.6              39.2         3.6             0

       individuals are also contributors to The Reptile Database, iNa-                      data source.
       turalist, HerpMapper, or CalPhotos. It is important to recognize
       that all photographers retain ownership and copyright to their                       2.2. Other data
       own photos.
   13. Once we had assembled a list of all species with 0 photos after                          We collected range size information in km2 from the Global Assess-
       taking all of the above into account (947 species), we sorted this                   ment of Reptile Distributions (GARD) Initiative (http://www.gardiniti
       list by year of species description and examined the peer-                           ative.org/data.html) (Roll et al., 2017). These maps do not include
       reviewed literature containing the original species description,                     marine snakes (N = 71), species described since 2017 (N = 246), species
       when available, for all species described between 1990 and 2020.                     whose geographic distribution is unknown (N = 11) and a small number
       We reasoned that prior to 1990, it was rare to publish color                         of species that are not mapped for no obvious reason (N = 24), so these
       photos in journals. If the original species description contained                    species were omitted from the spatial analysis. We also updated the
       one or more color photos of the species in life, we manually                         names of 171 species where the genus had changed and corrected the
       extracted these and added them to the dataset. We also extracted                     names of 52 species where spelling errors or changes to the gender of the
       photos of other snake species of which we already had photos, if                     specific epithet caused an imperfect match to the December 2020
       the papers contained any. In this way we were able to add 338                        Reptile Database taxonomy. Where two or more mapped species had
       photos of 163 additional species, between one and ten photos per                     been synonymized since 2017, we combined their range maps (14 spe-
       species.                                                                             cies combined into 5, affecting 285 photos; see Appendix 3 for complete
                                                                                            list). A number of currently-valid species of snakes have been split from
   Some data sources (iNaturalist, Flickr) allow filtering by Creative                      mapped species since 2017. When a mapped species had been split into
Commons license, whereas the legal ownership of photos on others                            two or more species since the GARD maps were produced, we combined
(Twitter, Facebook) is unclear. We operate under the assumption that all                    photo counts back to the more widespread species for which we had a
photographers retain copyright to their own photos, regardless of the                       map (252 species re-combined into 101, affecting 20% [145,814] of the
data source, pursuant to our Data Management Plan on file with the                          photos in the dataset; see Appendix 3 for complete list). We used a linear
Swiss National Science Foundation (SNSF). In cases where an All Rights                      model with the form:
Reserved license applied, we simply counted the photo as existing in the

Table 5
Average, standard deviation, and maximum number of photos per species by global region, and number of species with 0 photos from each global region. See text for
definitions of global regions. MIVS = medically-important venomous snakes *most marine snakes are potentially dangerous but rarely bite, whereas 4 species have
atrophied fangs and venom glands (Li et al., 2005; Shine et al., 2004).
  Global            Snake group        Number of      Number of species   Average number of          Standard deviation of             Maximum number of           Total number
  region                               species        with no photos      photos per species         number of photos per              photos per species          of images
                                                                                                     species

  Africa            blindsnakes        125            72                  34                         141                               1048                        4228
                    non-MIVS non-      418            67                  117                        372                               3159                        48708
                    blindsnakes
                    MIVS               92             11                  221                        605                               4491                        20325
  Asia              blindsnakes        77             47                  28                         205                               1797                        2154
                    non-MIVS non-      792            181                 46                         127                               1352                        36591
                    blindsnakes
                    MIVS               148            2                   167                        458                               4850                        24745
  Australia         blindsnakes        61             23                  5                          10                                54                          335
                    non-MIVS non-      129            18                  92                         235                               2174                        11927
                    blindsnakes
                    MIVS               34             0                   219                        332                               1366                        7458
  Europe            blindsnakes        1              0                   14                         NA                                14                          14
                    non-MIVS non-      20             0                   1309                       2619                              11840                       26186
                    blindsnakes
                    MIVS               17             0                   534                        1358                              5415                        9082
  Canada +          blindsnakes        7              1                   169                        390                               1050                        1184
    USA             non-MIVS non-      136            7                   2550                       5883                              48696                       346760
                    blindsnakes
                    MIVS               22             0                   3831                       5042                              14887                       84286
  Latin             blindsnakes        126            46                  10                         49                                532                         1270
    America         non-MIVS non-      967            182                 72                         260                               4176                        69299
                    blindsnakes
                    MIVS               186            9                   150                        477                               3612                        27920
  marine            non-MIVS*          4              0                   21                         14                                33                          83
                    MIVS               67             18                  22                         73                                480                         1493

                                                                                        7
A.M. Durso et al.                                                                                                                 Toxicon: X 9–10 (2021) 100071

ln(number of photos + 1) ∼ ln(years after 1758 + 1)                               it was likely to be of medical importance, although not all potentially
                                                                                  life-threatening species are responsible for significant mortality and
                           + presence of name in GARD (y / n)
                                                                                  morbidity in a given area (Silva, 2013) and species that are found in close
to ask whether the more widespread sensu lato species names in GARD or            proximity to humans vary in their contribution to the burden of snakebite
the more restricted sensu stricto species name(s) that have been revali-          (Glaudas, 2021; Udyawer et al., 2021).
dated since the GARD mapping project had more photos (assumptions                      The Reptile Database provided data on dates of original description
tested in Fig. S1). Adding one is to avoid the undefined natural log of 0.        (Uetz, 2010), synonyms, and higher taxonomy, as well as scans of
    We obtained gridded data on human population density (30 arc-                 hard-to-find original descriptions. Although we attempted to connect
second grid cells) from the Center for International Earth Science In-            names from the different data sources to those in the Reptile Database
formation Network (CIESIN) at Columbia University and calculated the              using the R package taxize (Chamberlain et al., 2019), we found that a
mean human population density within each GARD range map polygon                  substantial number remained unmatched and had to be connected using
using the Zonal Statistics tool of the Spatial Analyst toolbox of ArcGIS          custom dictionaries created manually. This issue also affects other
v.10.2. We assigned species to global regions using the coords2continent          biodiversity databases, such as NCBI GenBank (Garg et al., 2019).
function in the rworldmap package (South, 2011) on the centroid of
each GARD range, and creating a custom dictionary for any species that            2.3. Data analysis
were unmatched because they were not mapped in GARD or their cen-
troids lay outside of a continent. Although we include a marine region in             We used dredge function in the multi-model inference (MuMIn;
some summaries, this region was not part of our statistical model                 Bartón, 2020) package to perform model selection on all subsets of a
because range size and population density data are lacking. We exam-              global linear regression (function lm) model in R 3.6.3 (R Core Team,
ined the relationship between range size and number of people living              2020). We ranked models using AICc. We log-transformed the response
within the range by global region (Fig. 2).                                       variable (number of photos) to meet assumptions of normality and ho-
    We used the World Health Organization ((WHO 2016)) list of                    mogeneity of variance of the residuals (Fig. S2), and we log-transformed
medically-important venomous snake (MIVS) species as a starting point             the continuous explanatory variables to make interpretation of effect
and updated this list to reflect taxonomic changes and newly described            sizes more intuitive. Fixed explanatory variables for each species were:
species from medically-important genera since 2016. This resulted in 3313
species with non-medically-important designations and 566 species with             • geographic range size (in millions of km2) from CIESIN
medically-important designations. Note that totals may differ below (i.e.,         • population density (millions of people per km2) from CIESIN
531 MIVS and 2883 non-MIVS mapped by GARD, 499 MIVS and 2859                       • a quadratic term for population density, because we reasoned that at
non-MIVS with complete panel data for analysis) because of the necessity of          very high and very low population densities (i.e., very urban and
connecting these names with those from GARD and other sources (see                   very rural areas) photos would be rare, in the first case because of
above). This is not intended to be a systematic review of clinical impor-            habitat destruction and in the second because of little effort
tance; we simply assumed that if a species belonged to a genus that was            • global region (North America = USA + Canada; Latin America
made up of medically-important species, or a genus not listed by the WHO             including Mexico, the Caribbean, Central and South America, Oce-
that had recently been split from another medically-important genus, then            ania including Australia, Papua New Guinea, New Zealand, and

Fig. 5. Non-linear relationship between population density (people/km2) and number of photos (log). Y-axis breaks are of unequal size to better show the
relationship.

                                                                              8
A.M. Durso et al. Toxicon: X 9–10 (2021) 100071
Pacific Islands, Asia including the Middle East, the Caucasus, Turkey, found in no other data source (Table 2). More than half of all species
Russia east of the Ural mountains, and West Papua; Africa including (56.7%) were represented by 10 or fewer photos, whereas a small
Madagascar and the Mascarene Islands; and Europe including Russia number (12; 0.3%) were represented by > 10,000 photos each (Table 3).
west of the Ural mountains)
• medically-important venomous snake (MIVS) (yes or no) from the 3.1. Geographic distribution of the dataset
World Health Organization
• blindsnake (yes or no) from the Reptile Database A total of 107 countries (not including countries that lack snakes
• year of original description (1758–2020) from the Reptile Database entirely, such as Ireland, Iceland, New Zealand, and Cape Verde) have
all species represented, mostly in Europe, central Asia, North and Cen-
so the overall model was: tral America, and the Lesser Antilles. Many other countries with com-
plete coverage are relatively small (e.g., Belize, Lebanon, Qatar), insular
ln(number of photos + 1) ∼ ln(range size) + ln(population density)
(e.g., Bahrain, Comoros, Maldives, Nauru, Palau, Seychelles, Tonga,
+ ln population density2 + continent + mivs + blindsnake + year Vanuatu), or occur in more temperate regions with somewhat lower
( )
biodiversity (e.g., Chile, North Korea, South Korea, Uruguay). Only a
3. Results handful of countries in Africa, all from the far north (Morocco, Algeria,
Tunisia) and far south (Botswana, South Africa, Lesotho, Eswatini) have
The number of photos and species obtained from each data source 100% of their snake species represented by at least one photo in our
are found in Table 1. Combined, 3098 of the world’s 3879 snake species dataset (Fig. 3).
(79.9%) are represented in these eleven data sources by at least one Globally, the Caribbean, the Horn of Africa, and the islands of
photo (Table 2). This leaves 781 “most wanted” species with no photos Southeast Asia are the regions with the greatest need for additional data
(20.1% of all currently-described species as of the 17 December 2020 collection, although large biodiverse countries that encompass a di-
release of The Reptile Database; see Table 2 for a summary and Ap- versity of ecoregions, such as Australia, Brazil, China, Colombia, India,
pendix 4 for a list sortable by family, continent, authority, and MIVS Indonesia, Mexico and Peru, are priorities because of the enormous
status). number of species found there (Fig. 3). Indonesia, Papua New Guinea,
In total we collected 725,565 photos. The largest data source, iNa- the Philippines, Cuba, Haiti, and the Dominican Republic stand out as
turalist, made up 57.4% of all photos, whereas the smallest, primary having more missing species than expected for their diversity; the USA,
literature, made up just 0.09%, but contributed photos of 163 species Brazil, Mexico, Costa Rica, Ecuador, Nicaragua, Suriname, and Belize
Fig. 6. Year of original species description (Uetz, 2010) plotted against the number of photos (log) in our dataset, by family. Each point is one species. Species that
were described before 1900 are more likely to have >1000 photos (Spearman’s rho = −0.54; see Appendix 5 for parameter estimate). Notably, we could not locate
even one photograph in life of one species of snake, Brachyorrhos albus, described by Linnaeus in 1758 from Seram, Ambon, and nearby islands in eastern Indonesia
(Murphy et al., 2012).
9A.M. Durso et al. Toxicon: X 9–10 (2021) 100071
Fig. 7. Growth of iNaturalist & HerpMapper datasets over time, with corresponding increase in number of described snake species (each point is one Reptile
Database release; Uetz et al., 2021).
have fewer missing species than expected for their diversity (Fig. 4). 3.2.2. Effect of range size and human population density on number of
Canada and the USA have between 4 and 22 times as many photos as photos
the other global regions, a phenomenon present in citizen science data as There was a positive effect of range size on number of photos (Fig. 2).
a whole (La Sorte and Somveille, 2020). There is a positive non-linear For every additional 100,000 km2 of range area, there were 327 ± 15
relationship between range size and number of photos in all global re- more photos. For every additional thousand people per km2 within the
gions, especially in North America and Europe. The percentage of photos range, there were 1644 ± 196 more photos (Fig. 2). The sign of the
from each global region varies by data source—iNaturalist, HerpMap- significant quadratic term is negative, supporting our hypothesis that
per, and Twitter photos come mostly from North America, but many the shape of the relationship is concave down rather than concave
Flickr photos come from Asia, many CalPhotos and private photos come up—that is, snakes found in areas with very high and very low popu-
from Latin America, TRD and literature photos are concentrated in Asia, lation density tend to have fewer photos than those found in areas of
Africa, and Latin America, all ISI photos come from Asia, and all VMUS intermediate population density (Fig. 5).
photos come from Africa (Table 4).
3.2.3. Effect of date of description on number of photos
3.2. Model Species described longer ago are represented by more photos (Fig. 6).
On average, every year since 1758 corresponds to 1.8 fewer photos. Only
Of 128 explanatory variable combinations tested using the dredge three species that were described after 1900 have >1000 photos. No
function in MuMIn, the global model had the lowest AIC and 99.99% of species described since the year 2000 has more than 302 photos (Contia
the weight, with all terms significant. The second best model had a longicaudae from the northwestern part of North America). The species
ΔAICc of 31 and was missing only the quadratic term for human popu- with the most photos, Thamnophis sirtalis, was described by Linnaeus in
lation density. Thus, we describe the impact of all main effects on the 1758. There is a bi-modal distribution in the number of photos, with a
response variable, number of photos per species. For the full model table peak at 1 and a second peak near 10.
and detailed parameter estimates from the top model, see Appendices 5
and 6. 3.2.4. Relationship between number of photos and age of scientific name for
recently revalidated species
3.2.1. Variation among global regions and between blindsnakes and We used a linear model with the form:
alethinophidians
In descending order, the global regions with the most photos were
log(number of images + 1) ∼ log(years after 1758 + 1)
North America (mean ± S.D. number of photos per species = 2619 ± + presence of name in GARD (y / n)
5675), Europe (928 ± 2120), Africa (115 ± 387), Australia (88 ± 229),
Latin America (77 ± 292), and Asia (62 ± 219). Variation in the to ask whether the more widespread sensu lato species names or the more
maximum number of photos per species was comparable (Table 5). All restricted sensu stricto species name(s) that have been revalidated since
European snake species and all North American and Australian MIVS the GARD mapping project had more photos. The model had an adjusted
were represented by at least 1 photo (Table 5). R2 of 0.33.
Blindsnake species had on average 10 times fewer photos (mean ± S.D. An increase in the number of years since 1758 led to a decrease in the
= 23 ± 134 per species) than alethinophidian snake species (mean ± S.D. number of photos, but we defer to the more complex model for effect
= 241 ± 1507 per species). Nearly half (189 of 397; 47.6%) of blindsnake sizes. The more widespread sensu lato species mapped in GARD had 2.2
species in GARD are represented by 0 photos, in contrast to less than a sixth ± 0.3% more photos (379 ± 52 more photos) compared to the more
(477 of 2961; 16.1%) of alethinophidians in GARD. The blindsnake species restricted sensu stricto species that have been revalidated since the GARD
with the most photos (1,797), Indotyphlops braminus, is a globally- mapping project was published in 2017. This effect is significant at p <
distributed parthenogenetic all-female triploid human commensal species 0.001. A test removing the most extreme outlier (Boa orophias) did not
(Wallach, 2020) with a range size of 3.3 million km2, nearly five times alter the results of the model.
more widely distributed than the blindsnake with the next highest number
of photos (Rena dulcis with 1050) and the only blindsnake with a range size 3.2.5. Effect of medical importance on number of photos
larger than the average for all snakes (915,000 km2). Medically-important venomous snakes (MIVS) are represented on
average (±S.D.) by 348 ± 1385 photos, whereas non-medically-
important species are represented on average (±S.D.) by 192 ± 1422
10A.M. Durso et al. Toxicon: X 9–10 (2021) 100071
photos. Only 22 of the 499 MIVS species in GARD (4.5%) are repre- 0 photos, and 72% had 750 people/km2) to
only the 2462 non-blindsnakes are considered). This is despite the fact be represented by > 50 photos (Chilabothrus inornatus from Puerto Rico,
that six non-MIVS species are represented by more photos than the MIVS Naja sputatrix from Java, Bali, and adjacent islands, Opisthotropis
species with the highest number of photos (Crotalus oreganus with andersonii from Hong Kong and Vietnam, Sinomicrurus hatori from
14,831). northeastern Taiwan, and Thamnophis scaliger from the southern part of
the Mexican plateau in the vicinity of Mexico City). On the other end of
3.3. Growth rates of selected data sources the spectrum, six snake species are sufficiently well-known to be rep-
resented by > 50 photos in the dataset despite occurring in areas where
As of 30 March 2021, the number of observations of snakes in iNa- the human population density is < 0.05 people/km2 (Acanthophis pyr-
turalist is 487,948 (many with >1 photo, see above) and the number in rhus from central and northwestern Australia, Dipsas articulata and
HerpMapper is 124,378, with average annual growth from 2018 to 2020 Tantilla hendersoni from rural parts of Central America, Crotalus cata-
of 49% and 18%, respectively. The rate of growth of iNaturalist is linensis from the Isla Santa Catalina in the Gulf of California, Mexico, and
accelerating whereas that of HerpMapper is steady (Fig. 7). Macrocalamus chanardi and M. gentingensis from peninsular Malaysia).
4. Discussion 4.2.2. Effect of date of description on number of photos
That species described longer ago have more photos is not very
4.1. Overview surprising, although it emphasizes how much we have left to learn about
many snake species, particularly in developing countries. The number of
We present a summary of >700,000 photos of nearly 80% of snake new snake species described in the 21st century so far has averaged 33
species worldwide, adding new datasets, species, and photos to the per year, higher than at any other time except the 1860s, when colo-
recent compilation for all reptiles (Marshall et al., 2020a). Overall, our nialism was at its peak. It is now routine for new species descriptions to
spatial and taxonomic coverage were comparable, and we expect that contain at least one and sometimes several color photographs, but this
further effort would result in greater species coverage, but with has only become possible within the past few decades. Notably, we could
ever-diminishing returns. not locate even one photograph in life of one species of snake, Bra-
North America is over-represented in nearly all citizen science pro- chyorrhos albus, described by Linnaeus in 1758 from Seram, Ambon, and
jects, because it is where many of those projects began and are based, nearby islands in eastern Indonesia (Murphy et al., 2012). More recently
and many North Americans have substantial recreational and leisure described species can lack photos in life if they are described from
time to contribute observations compared to many people living in museum specimens.
developing countries (Millar et al., 2019), who likely have different Only a few species that were described after 1900 have >1000
priorities, different interests, different beliefs about touching animals photos, and all of these are North American species that were re-elevated
and taking photos (Hauenstein, 1978), and poorer access to cameras and from more widespread species relatively recently (Agkistrodon conanti,
broadband (although this is improving rapidly even in remote areas; A. laticinctus, Lampropeltis holbrooki). We attempted to test whether the
Broadband Commission, 2019; James, 2020). Spatial bias is important photo dataset is biased towards older names when species have been
to account for when using crowd-sourced data to map species distribu- recently split, as described by Marshall et al. (2020), because we had the
tions (Johnston et al., 2020). High-income countries supply most snake impression that when widespread species are split or elevated from
observations in citizen science platforms, whereas countries with the subspecies to species, creating new binomials, originally correct iden-
highest snakebite burden have much more limited participation (Gen- tifications can become incorrect. We found evidence that this is the
eviève et al., 2018). case—the more widespread sensu lato species mapped in GARD had
Blindsnake species are inherently difficult to detect and identify, almost 400 more photos compared to the more restricted sensu stricto
even more so than snakes in general. Most blindsnakes are tiny (5000 photos in their venom composition. Rigorous tracking of locations and photographs
the dataset were all found in areas between 6 and 86 people/km2. Of that allow reassessment of key characters can help mitigate the identifi-
snake species that occur in areas withA.M. Durso et al. Toxicon: X 9–10 (2021) 100071
updates to geo-tagged observations in case of taxonomic changes (https plant ecologists (Boyle et al., 2013; Garg et al., 2019; Patterson et al.,
://www.inaturalist.org/taxon_changes) and makes up the majority of our 2016; Tedersoo et al., 2015) have highlighted this critical challenge.
dataset, this problem is not as bad as it might be, but non-geo-tagged data Weiser et al. (2007) compiled >300,000 plant observations from 51
sources (e.g., Flickr, CalPhotos, photos in private collections) are probably sources, resulting in >22,000 unique names, which fell to 12,980
very susceptible. after correcting misspellings and updating synonymous names—that
is, >42% of the names in the original data were erroneous, obsolete,
4.2.3. Effect of medical importance on number of photos or otherwise inconsistent with the then-currently accepted names
There is a significant effect of MIVS status. This could reflect a bias (and even a one-time effort to correct such names will drift
towards reporting medically-important species, that these species are out-of-date as new taxonomic changes are made)! Our experience
more abundant, more detectable, and/or that their ranges include collecting this dataset suggests that the problem for snakes is of a
higher levels of participation in citizen science. Many people are fasci- similar magnitude and, left unaddressed, represents an insidious
nated by venomous snakes (Roll et al., 2016), but in most areas MIVS are source of error. Adherence to DarwinCore standards (Wieczorek
not more abundant or diverse than non-MIVS (Luiselli et al., 2020). et al., 2012) is a good start, as is the R package taxize (Chamberlain
Citizen scientists in the Carolinas were more likely to submit photos of et al., 2019), although we found that even using these tools resulted
snakes than of other reptiles and amphibians (Price and Dorcas, 2011), in a substantial number of names that remained unmatched and had
suggesting that fascination with or fear of snakes might motivate people to be connected using custom dictionaries created manually.
to document them at higher rates than other taxa, but whether this is 3. Over- and under-representation. Some data sources, particularly
particularly true for venomous snakes remains to be rigorously tested Flickr, contain many photos that show only the habitat, without an
(and in many cases the citizen scientist submitting the photo might not actual snake, despite being tagged with a snake name. A similar
know whether the snake is venomous or not). attempt to scrape plant biodiversity data from Flickr (August et al.,
2020) found that photos were spatially aggregated around tourist
4.3. Growth rates of selected data sources sites and under-represented native species, and that photos focused
on a single individual were most reliably identified by computer
Linear extrapolation of slopes of species accumulation curves sug- vision approaches. They also recommend attempting to quantify the
gests that observations of previously-unreported species are added to degree to which charismatic species are over-represented or
online biodiversity platforms more quickly (iNaturalist: 9.5 new species nocturnal species under-represented, and that adequately doc-
per month; HerpMapper: 12.3 new species per month) than the current umenting procedures for data collection and filtering will be essen-
rate of new species description (4.9 new species per month) and that tial for meeting data standards for biodiversity photo datasets which
online biodiversity platforms might contain at least one photo of every have not yet been formalized.
species as early as 2050, although it is more likely that all three of these 4. Our experience collecting photos from Twitter was less fruitful than
curves will begin to asymptote during the 21st century, causing a hoped. This data source contained many duplicates, even after tar-
persistent deficit of rare species. Obviously such simplistic extrapola- geted attempts to remove them. A close look at the photos for a
tions of future trends in species description and citizen science partici- species (Atheris hispida) where Twitter photos made up a high pro-
pation are highly uncertain and likely to be influenced by a variety of portion (35%) of the total photos in the dataset revealed that
unforeseeable forces. For example, Hochachka et al. (2021) documented numerous duplicate photos remained, despite our efforts to filter
regional variation in the impacts of the COVID-19 pandemic on the them out in advance. Differences in photo size, format (.png vs.jpg),
quantity and quality of data collected by the citizen science project cropping, saturation, and other attributes that cause identical or
eBird, and we expect that social, economic, and political factors play a near-identical photos to appear different to a computer, combined
large role in which species are most well-documented in online biodi- with the pulsed, real-time nature of Twitter content, probably ac-
versity databases. count for most of these duplicates. Another limitation is that only a
small number of the photos (289; 0.1%) had geographically-tagged
4.4. Limitations of the different data sources data, without which it is often difficult to confirm the identity. In
addition, examining the three species (one photo each) that were
We highlight six limitations of the dataset: added to the dataset exclusively through Twitter revealed that two of
these were photos that came from recently-published and publicized
1. All data sources contain some misidentified photos. A crowd- original descriptions (Jins et al., 2018; Rödel et al., 2019), where
sourced review in which an average of 110 participants identified they would have been easy to find had we looked there first. The
each photo (min 68, max 156) found that five (1.5%) of 336 Research third was a photo of a nearly extinct species, Erythrolamprus ornatus,
Grade photos of snakes from iNaturalist were incorrectly identified taken by a Fauna & Flora International (FFI) photographer on Maria
(Durso et al., 2021a); likewise, 16 of 703 photos (2.3%) reviewed Major Island off the coast of St. Lucia in the West Indies, which may
from 20 Snake ID Facebook groups were incorrectly identified. Most be represented by fewer than 20 wild individuals (Williams et al.,
of these were due to recent taxonomic changes or confusion with 2016). This last species is the only one that would not have been
similar species. If we assume similar error rates for our other data included through our other sources, and led to additional photos of
sources, there could be as many as 13,700 incorrectly identified this and other rare species when we contacted FFI. Although these
photos in our dataset, although platforms without formal species gains are undoubtedly important, we suggest that the cost:benefit of
identification curations (e.g., Flickr) likely have higher misidentifi- Twitter photos is among the lowest of the data sources we attempted.
cation rates. Finding and correcting these is a priority, as is keeping a We anticipate that other popular online photo-sharing platforms,
record of the misidentification and its repair. iNaturalist in particular such as Instagram or Pinterest, would suffer from the same problem,
does an admirable job of showing the annotated identification his- and are even more likely to have had the color or other attributes
tory in a transparent way. altered or to show snakes in captivity. The only exceptions are the
2. Using a consistent taxonomy across data sources would make de- highly-curated Facebook snake ID groups (see appendix of Durso
siloing and connecting photos of the same species that are tagged et al., 2021a for a list), which are essentially impossible to access in a
using different names much easier. No single part of this project was scalable, reproducible way due to Facebook’s policies (i.e., required
more time-consuming and frustrating than trying to accomplish this use of personal access points, and removal of Exchangeable Image
in a repeatable, documented, and accurate way. This problem is not File [exif] data from uploaded images).
unique to photo data, and scientists as diverse as geneticists and
12You can also read