2022 Mid-Career Presentation - Minnesota State ...
←
→
Page content transcription
If your browser does not render page correctly, please read the page content below

2022 Mid-Career Presentation

Who we are

         Minnesota State Retirement System

State Employee      Health Care         Deferred
 Pension Plans      Savings Plan    Compensation Plan
                      (HCSP)           (MNDCP)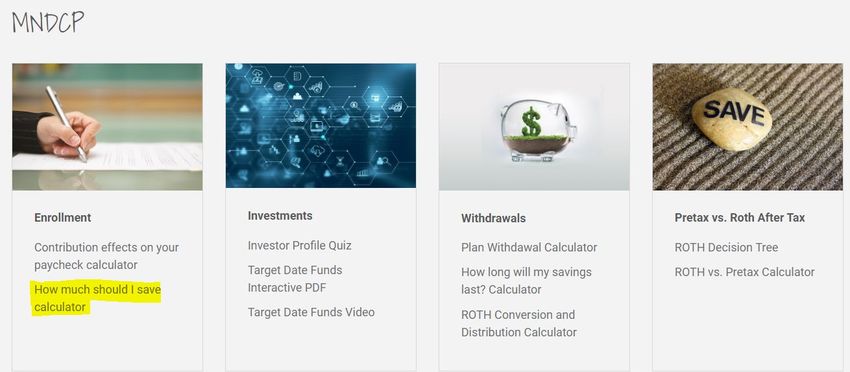
Retirement
Readiness
  Section

Be Prepared   Consider the realities
                        health care

               • High cost of health care
High cost of health care

      Amount needed to cover health care costs in retirement
   Blank this is an
                                           For a 50% chance                     For a 90% chance
   empty field
                                              of covering                          of covering

                                                   $73,000                             $130,000
          65-year-old man

                                                  $95,000                              $146,000
        65-year-old woman

                                                   $168,000                            $270,000
        65-year-old couple*

FOR ILLUSTRATIVE PURPOSES ONLY
Source: Employee Benefit Research Institute Issue Brief, May 28, 2020 Excludes long-term care
*For a couple with median prescription drug expenses
Be Prepared   Consider the realities
                life expectancy

               • High cost of health care
               • We’re living longer
Life expectancy – we’re living longer

                                 65-year-old man           65-year-old woman          65-year-old couple*

   50% Chance                      Age 87                      Age 89                       Age 93

   25% Chance                      Age 93                       Age 95                      Age 97

FOR ILLUSTRATIVE PURPOSES ONLY
Source: Society of Actuaries RP-2014 Mortality Table projected with Mortality Improvement Scale MP-2017 as of 2018
*At least one surviving individual.
Be Prepared   Consider the realities
                           inflation

              • High cost of health care
              • We’re living longer
              • Inflation
Inflation – what money will buy

        The effect of inflation over 20 years

                                                                                                        119%
                     24%                                     55%                                      increase
                   increase                                increase
                     $3.66                                   $0.14                                      $7.32

                                                $0.09

        $2.95                                                                              $3.34

         2001         2021                        2001        2021                          2001         2021
           Whole Milk                              Electricity                               Bacon, Sliced
           (per gallon)                            (per KWH)                                    (per lb)

FOR ILLUSTRATIVE PURPOSES ONLY
Source: U.S. Bureau of Labor Statistics, Consumer Price Index, U.S. City Average Price Data (10/2001 – 10/2021)
Be Prepared          Prepare your
                  retirement budget

              How much will you need to
              maintain your standard of living?

              Review your financial situation to
              determine:
                • all your sources of retirement
                  income
                • how your expenses will differ
                  in retirement
Take action
Consider how the Prepare a
following factors could retirement budget
affect your retirement
savings Visit
www.msrs.state.mn.us/create-a-budget
• Higher health care costs
• Increasing life expectancies
• InflationPension
What is a pension benefit

                 Lifetime income paid
                monthly once you retire
About MSRS pension plans 90% of state Membership is Employee and employees are mandatory employer members of the contribute a % of MSRS General employee’s gross Employees salary to fund Retirement Plan their pension
Qualifying for a pension benefit

What is vesting?                  General Plan vesting
Refers to the time period you     Hired before     3 years service
must work before you are          July 1, 2010
eligible for a lifetime pension
benefit                           Hired on/after   5 years service
                                  July 1, 2010
How your pension benefit is calculated
Service Monthly Possible
Credit X Formula X High-5 X Reduction
Factor
=
Monthly
BenefitRetirement age determines reduction EARLY RETIREMENT AGE FULL RETIREMENT AGE Age 55-65 Age 66 & older Pension benefit subject to reduction
Meet Anita & Sarah
Each began employment at the same time
Each earn the same salary
Anita
Plans to retire at age 66
With 30 years at DNR
Sarah
Plans to retire at age 62
With 26 years at DOTBenefit comparison
Anita retires age 66
30 years X 1.7% X $5,000 X N/A = $2,550
Sarah retires age 62
26 years X 1.7% X $4,619 X 0.6924 = $1,414
FOR ILLUSTRATIVE PURPOSES ONLY Your actual results will vary based on your retirement date.Benefit deferral comparison
Sarah retires age 62
26 years X 1.7% X $4,619 X 0.6924 = $1,414
Sarah retires age 62 BUT DEFERS TO AGE 66
26 years X 1.7% X $4,619 X N/A = $2,042
FOR ILLUSTRATIVE PURPOSES ONLY Your actual results will vary based on your retirement date.N/A
Survivor
Options Additional
Features
Annual
Benefit
Increase
Benefit
is
TaxableTake action 2
pension
Review Understand the
your estimated impact of retiring
pension benefit before your full
• Annual statement retirement age
• Online account Further you are from your
full retirement age, greater
• Schedule an the benefit reduction
appointment with an
MSRS RepresentativeIncome Gap
Income
GAPWhat is an income gap?
You might have an income gap if:
your savings does not meet your retirement
income needs
you retire early and need more retirement savings
or
you fear you will outlive your savingsHow much income will it take?
You may need $60,000 annual salary
80% to 100%
FOR ILLUSTRATIVE PURPOSES ONLY
Figure represents 80% of $60,000 salary
of your current income to maintain
your lifestyle in retirementPension & Social Security may not be enough
Income your MN public pension replaces1
• 10 years service = 17%
• 20 years service = 34%
• 30 years service = 51%
Income your Social Security replaces2
• Average MN public employee recipient = 32%
1 Basedon the years of service of MSRS pension recipients. Assumes full retirement age of 66. A TRA recipient
replacement percentage would be higher.
2Based on the collecting an unreduced social security benefit at age 66 and a final average salary of 2020
retirees from MSRS, PERA, TRA public pension plans. Does not assume future earnings. Salary Source: MSRS,
PERA and TRA 2020 Comprehensive Annual Financial Report. Social Security Source: SSA Benefit Calculator.Case study income replacement
Sarah Anita
Retirement Age 62 66
High-5 monthly salary $4,619 $5,000
Pension replacement 31% 51%
Social Security replacement 24% 31%
TOTAL INCOME
55% 82%
REPLACEMENT
FOR ILLUSTRATIVE PURPOSES ONLY Your actual results will vary.Case study savings needed
Sarah Anita
Retirement Age 62 66
TOTAL INCOME REPLACEMENT 55% 82%
Savings needed to replace 80% $272,500* $0
Savings needed to replace
$485,000* $186,000*
100%
FOR ILLUSTRATIVE PURPOSES ONLY Your actual results will vary.
Based on a 5% annual rate of return (not guaranteed) and 2% inflation. Assuming annual withdrawals to reach
stated income replacement lasting until age 90.Calculate how much retirement
income you will need
Do your own calculation www.msrs.state.mn.us/toolbox#mndcpTake action
Bridge the income gap
HCSP account
MNDCP account
Use your HCSP account
Maximize contributions
assets
if possible
Pension & Social Security
Consider delaying your
retirement dateMinnesota Deferred Compensation Plan
What is the MNDCP?

         i
         o
         n
 A voluntary savings    Available to all MN     State sponsored
 plan to supplement      public employees         457(b) Plan
your pension & Social   and elected officials
   Security income
Contribution limits
Take advantage of matching dollars

                     How much an employer match could help

         $0                                                                                       $29,539

FOR ILLUSTRATIVE PURPOSES ONLY Figures represents the growth of a minimum $10 contribution per pay period plus
an annual $250 employer matching contribution over 25 years at 6% interest (not guaranteed) compounded annually.
Maximize your contribution
Contribution per
10 years 20 years
pay period
$25 $8,810 $24,602
$50 $17,620 $49,203
$100 $35,240 $98,407
$200 $70,481 $196,814
$500 $176,202 $492,035
FOR ILLUSTRATIVE PURPOSES ONLY. This hypothetical illustration is not intended as a projection or prediction of
future investment results, nor is it intended as financial planning or investment advice. It assumes 26 pay periods
per year, a 6% annual rate of return and reinvestment of earnings with no withdrawals. Rates of return may vary.
The illustration does not reflect any charges, expenses or fees. The tax-deferred accumulation shown would be
reduced if these fees had been deducted.Pre-tax vs Roth after-tax bank field Pre-Tax Roth After-Tax Contributions Tax deferred Taxable Earnings Tax deferred Tax free* Distributions Taxable Tax free* *As long as Roth account was held for 5-year period and the distribution is on/after age 59½. If both conditions are not met, the earnings portion only of a Roth distribution is taxable.
How to build a diversified portfolio

Generally, there are two options to consider:

① For the Hands-Off Investor
  Invest in professionally managed, diversified funds
  such as a target retirement fund or balanced fund

② For the Hands-On Investor
  Build your own portfolio from the core investment
  options available to you
Hands off investor
Select one Target Retirement Fund
Target Date Funds Disclosure

Generally, the asset allocation of each target date
fund will gradually become more conservative as
the fund nears the target retirement date. The date
in a target date fund’s name is the approximate
date when investors plan to start withdrawing their
money (which is assumed to be at age 65). The
principal value of the fund(s) is not guaranteed at
any time, including at the time of the target date
and/or withdrawal. For more information, please
refer to the fund disclosure document.
Hands on investor
                          Choose your investments
   Higher Risk     Asset Class                      MNDCP Investment Options
Potential Reward

                   Small-Cap U.S. Stock             T. Rowe Price Small-Cap Stock Fund
                                                    Fidelity Diversified International Fund
                   International Stock
                                                    Vanguard Total International Stock Index Fund

                   Mid-Cap U.S. Stock               Vanguard Mid-Cap Index Fund

                                                    Vanguard Total Stock Market Index Fund
                   Large-Cap U.S. Stock             Vanguard Institutional Index Fund
                                                    Vanguard Dividend Growth Fund
                   Balanced                         Vanguard Balanced Index Fund
                                                    Dodge & Cox Income Fund
                   Bond
                                                    Vanguard Total Bond Index Fund
                                                    Stable Value Fund
                   Short-Term Investments
                                                    Money Market Fund
   Lower Risk
Potential Reward                 Investing involves risk, including possible loss of principal.
How different investments have
performed over time
Growth of $100 over past 20 years
FOR ILLUSTRATIVE PURPOSES ONLY. Returns are presented per year on average. Source: Factset Systems, as of December 31, 2020.
Barclays US Aggregate, S&P 500, and Citigroup (3M) Treasury Bill are benchmark indexes. A benchmark index is not actively managed, does
not have a defined investment objective, and does not incur fees or expenses. Therefore, performance of a fund will generally be less than
its benchmark index. You cannot invest in a benchmark index. Past performance is not a guarantee or prediction of future results.Comparing two investment portfolios
Growth of $100 over past 20 years
FOR ILLUSTRATIVE PURPOSES ONLY. Intended to illustrate possible investment portfolio allocations that represent an
investment strategy based on risk and return. It is not intended as financial planning or investment advice nor as a projection
or prediction of future investment results. Past performance is not a guarantee or prediction of future results.
Annual return data from Factset Systems, as of December 31, 2020. Example assumes portfolios are not rebalanced.Keep perspective
It has paid to stay invested in U.S. stocks during troubled times
Subsequent 5-year S&P 500® return
FOR ILLUSTRATIVE PURPOSES ONLY Past performance is not a guarantee or prediction of future results. You cannot invest
directly in a benchmark index. U.S. stock market returns represented by total return of S&P 500®, which is an index used
as a proxy for the stock market in general.
Source: Fidelity Investments. https://institutional.fidelity.com/app/item/RD_13569_23965.html With data
provided by Ibbotson, Factset, FMR Co., Fidelity Asset Allocation Research Team (AART) as of 3/31/2015.Managing investments in economic downturns Returns of S&P 500® 20 years ended December 31,2020 FOR ILLUSTRATIVE PURPOSES ONLY. Source: Data obtained from Factset Systems. S&P 500® returns January 1, 2001 through December 31, 2020. Returns expressed as total returns. This chart is intended for illustrative purposes only; it is not investment advice. Past performance is not a guarantee of future results. S&P 500® Index is a registered trademark of Standard & Poor’s Financial Services LLC, and is an unmanaged index considered indicative of the domestic Large-Cap equity market. An index is not actively managed, does not have a defined investment objective, and does not incur fees or expenses. Therefore, performance of a fund will generally be less than its benchmark index. You cannot invest directly in a benchmark index.
Diversify to manage risk
Diversification - Holding a mix of investments such as stocks in large,
small and international companies, bonds (government and corporate)
          and cash alternatives (Stable Value, Money Market)

    FOR ILLUSTRATIVE PURPOSES ONLY. Diversification does not ensure a profit or guarantee against loss.
Asset allocation example
BONDS BONDS BONDS
STOCKS
STOCKS
STOCKS
Early Years Middle Years Later Years
FOR ILLUSTRATIVE PURPOSES ONLY. Intended to illustrate possible investment portfolio allocations that represent an
investment strategy based on risk and return. This is not intended as financial planning or investment advice.Funds Disclosure Money Market Fund Disclosure You could lose money by investing in a money market fund. Although the fund seeks to preserve the value of your investment at $1 per share, it cannot guarantee it will do so. An investment in the fund is not insured or guaranteed by the Federal Deposit Insurance Corporation or any other government agency. The fund’s sponsor has no legal obligation to provide financial support to the fund, and you should not expect that the sponsor will provide financial support to the fund at any time. Investment Disclosure Please consider the investment objectives, fees and expenses carefully before investing. The prospectus and/or disclosure documents contain this and other important information about the investments offered through your plan. To obtain a prospectus or disclosure document, or to learn more about the investment options, visit www.msrs.state.mn.us or call 800-657- 5757. Read such materials carefully before investing.
Distribution eligibliity
You are not required to withdraw
your MNDCP account balance
upon severance of employment
Distribution eligibility begins:
• 30 days after ending employment,
at any age
• On/After age 59½, regardless of
employment status
• Upon death or disability
No IRS 10% tax penalty on
withdrawals prior to age 59½How long will your savings last?
Blank field
Savings Balance
Gross Withdrawal $50,000 $100,000 $150,000
$500/month 11 yrs 4 mos >50 yrs >50 yrs
$1,000/month 4 yrs 9 mos 11 yrs 4 mos 22 yrs 3 mos
$1,500/month 3 yrs 6 yrs 8 mos 11 yrs 4 mos
FOR ILLUSTRATIVE PURPOSES ONLY
Your actual results will vary. This hypothetical example assumes a 6% annual rate of return. Rate of return not guaranteed.Calculate how long your savings will last Do your own calculation www.msrs.state.mn.us/toolbox#mndcp
Take action   3

Maximize                           Keep in mind
your contributions                 you are not required to
                                   roll out or close your
                                   MNDCP account
Minimize
account fluctuations
with a diversified
investment strategy

Get free money
enjoy any employer
matching dollars
Health Care Savings Plan
What is the HCSP?
A tax-free savings account
Tax-free contributions
Tax-free potential growth
Tax-free reimbursements
No Social Security, Medicare or income taxes
Reimburse post-employment health care expenses for
employee, spouse, legal tax dependents, and children
up to 26th birthday.
NOTE: Your Social Security benefit may be slightly reduced because no FICA tax is collected on contributionsTax-free matters
Taxable Cash Payout Tax-Free HCSP Payout
Severance payment $10,000 Severance payment $10,000
Federal Income Tax 2,200 Federal Income Tax 0
State Income Tax 680 State Income Tax 0
FICA Tax 765 FICA Tax 0
Net cash payment $6,355 Net cash payment $10,000
FOR ILLUSTRATIVE PURPOSES ONLY
This hypothetical example assumes a 22% federal withholding rate + 6.80% state withholding rate + 7.65% FICA (Social Security
and Medicare) tax rate. Individual tax rates will vary based on total taxable income and filing status for the year.Eligibility for participation
Participation MUST be… Participation CANNOT be…
negotiated in union contract individual choice—group
or participation must be
included in personnel policy
specified in union contract
for non-union employees or personnel policyState employee participation
Paycheck
Union Severance Vacation
contribution
AFSCME √ √
MAPE √ √ √
MMA √ √ √
Managerial
& √ √ √
Commissioners
For participation specifics, refer to your union contract at:
https://mn.gov/mmb/employee-relations/labor-relations/labor/Investment Default Money Market Fund
Seeks to maintain the value of
the original investment
Seeks to earn interest competitive
with short-term interest rates
Plan expenses may exceed
earned interest
Other investment options available
You could lose money by investing in a money market, it cannot guarantee it will do
so. An investment in the fund is not insured or guaranteed. Although the fund seeks
to preserve the value of your investment at $1 per share by the Federal Deposit
Insurance Corporation or any other government agency. The fund’s sponsor has no
legal obligation to provide financial support to the fund, and you should not expect
that the sponsor will provide financial support to the fund at any time.Investments matter
Growth of an investment earning 1% vs 6% annual return
$80,000
$70,000 $66,429
$60,000
$50,000
$40,000
$31,379
$30,000 $26,476
$20,000 $16,676
$12,865
$8,866
$10,000
$0
15 Years 25 Years 35 Years
1% 6%
FOR ILLUSTRATIVE PURPOSES ONLY Figures represents the growth of 1% of salary for the periods shown
at 1% and 6% interest (not guaranteed) compounded annually less the 0.65% annual HCSP administrative
fee. Data assumes a starting $50,000 annual salary with annual 2% raises.Click to edit Master title
Higher Risk
style
Investment options
Potential Reward
T. Rowe Price Small Cap Stock Fund
Vanguard Total International Stock Index Fund
Vanguard Mid Cap Index Fund
Vanguard Total Stock Market Index Fund
Vanguard Dividend Growth Fund
Vanguard Balanced Index Fund
Dodge & Cox Income Fund
Vanguard Total Bond Market Index Fund
Lower Risk Stable Value Fund
Potential Reward
Investing involves risk, including possible loss of principal.Investment Disclosure 2 Please consider the investment objectives, fees and expenses carefully before investing. The prospectus and/or disclosure documents contain this and other important information about the investments offered through your plan. To obtain a prospectus or disclosure document, or to learn more about the investment options, visit www.msrs.state.mn.us or call 800-657-5757. Read such materials carefully before investing. No investment is 100% risk free. You can incur loss of principal by investing. There is no assurance that investing will ensure a profit or protect against loss. Foreign investments involve special risks, including currency fluctuation, taxation differences and political developments. Equity securities of small and mid-sized companies may be more volatile than securities of larger, more established companies. Asset allocation and balanced investment options and models are subject to the risks of the underlying funds, which can be a mix of stocks/stock funds and bond/bond funds. A bond fund’s yield, share price and total return change daily and are based on changes in interest rates, market conditions, economic and political news, and the quality and maturity of its investments. In general, bond prices fall when interest rates rise and vice versa.
Click to edit Master title
style
Request reimbursements
Upon termination of employment…
at any age
Once retired
If collecting a disability benefit
from a MN public pension planWhat is reimbursable
Eligible medical/dental expenses, including:
Insurance Premiums
• Health, Medicare, Dental, Long-Term Care
Dental costs
Eye-care costs
Co-payments & prescription drugs
Over-the-counter drugs with prescription
For other eligible expenses, see IRS Publication 502What cannot be reimbursed Life insurance premiums Teeth bleaching Cosmetic surgery Finance charges on bills Fees for health club membership Funeral expenses Vitamins
Take action   5

Review                    Remember
your investments          post-employment account
The Money Market          for health expenses only
Fund is the
investment default
                          No tax reporting
                          since reimbursements are
                          exempt from federal and
                          state taxation
Contact us
Receive more details about the
information you just saw
or
Make an appointment to speak to
one of our retirement counselors
www.msrs.state.mn.us
Locations:
St. Paul - 60 Empire Drive · Suite 300 1.800.657.5757 or 651.296.2761
St. Cloud - 4150 Second Street S · Suite 330
Mankato - 11 Civic Center Plaza · Suite 150
Detroit Lakes - 714 Lake Ave · Suite 100 Follow us on Twitter: mnretire
Duluth - 625 East Central EntranceImportant Notes Today’s workshop was designed to:
Provide you with fundamental information on your
MSRS retirement plans
Securities offered and/or distributed through Objectively highlight your investment options
GWFS Equities, Inc. Member FINRA/SIPC.
Outline other sources of information for your
GWFS is not responsible for the content decisions
contained on msrs.state.mn.us.
Please read all investment-related information prior to
investing.
This presentation is for general education purposes only
and does not, nor is intended to constitute legal, tax,
investment or financial advice of any kind.
• Please consult your own advisors for such advice
RO1611049-0421You can also read